
Key take-aways
- Sea ice cover in the Antarctic has reached its annual minimum extent on the 19th of February, 20% below the long-term average (1993-2010).
- Sea Ice volume is currently at 1.18 thousand km³, 47% lower the long-term average (1993-2010).
- February 2024 remains another year of low sea ice extent and volume for the Antarctic.
Sea Ice Extent
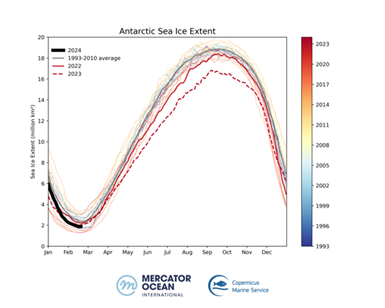
Antarctic sea ice cover has reached its annual minimum extent of 1.86 million km² on the 19th of February 2024. This represents a loss of 0.49 million km² compared to the 1993-2010 long term average (2.36 million km²), or 20% less the same period. February 2024 shows another exceptional low extent (after the record-low in February 2023, since satellite record).
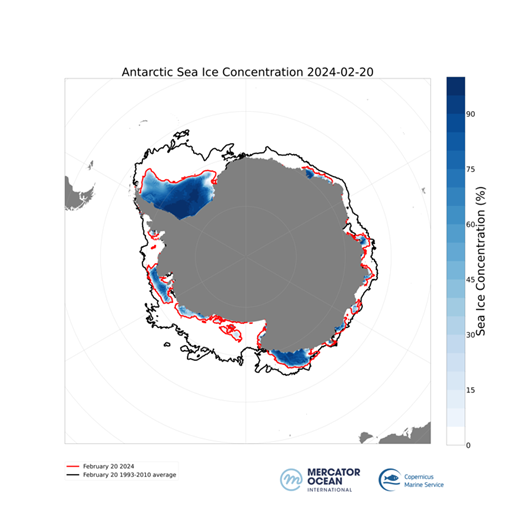
Sea Ice Concentration
On the 20th of February 2024, the Antarctic Sea ice concentration (figure 2 red line) was noticeably below the long-term average between 1993 and 2010 (figure 2 black line) for the same date in the year. Compared to the 1993-2010 period, large areas of sea ice cover are missing in the Atlantic and Pacific sectors (figure 1).
Sea Ice Volume
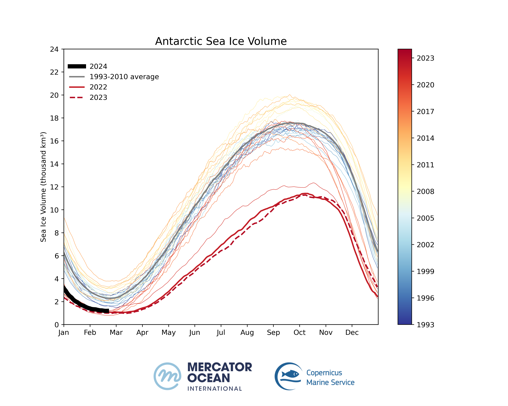

The Antarctic sea ice volume has reached its minimum volume of 1.18 thousand km³ on the 20th of February 2024. This represents a loss of 1.05 thousand km³ compared to the 1993-2010 long term average (2.24 thousand km3), or the equivalent to a 47% loss in sea ice volume. In the last two years, minimum sea ice volume in the Antarctic was 50% below the 1993-2020 yearly minimum average.
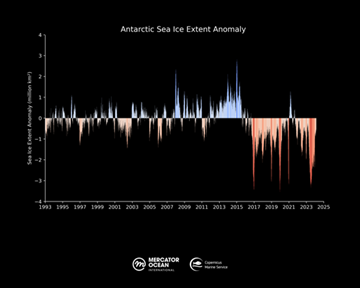
Antarctic Sea Ice Volume trend
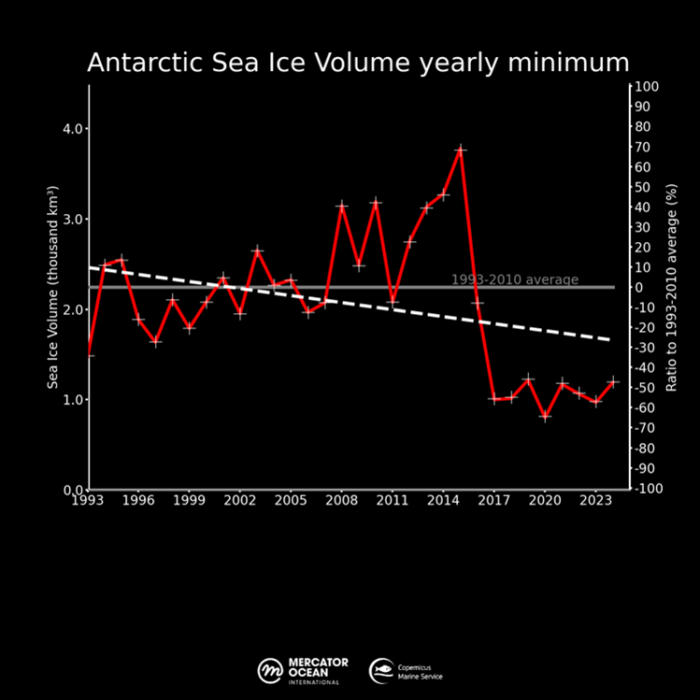
After nearly 30 years of a highly variable sea ice cover in the Antarctic region throughout the year, and therefore no clear trend, the last few years have shown a slight negative trend, particularly when considering the annual minimum value (measured in February). The 1993-2024 trend (figure 6) represents a loss of 0.25 thousand km³ per decade.
Monitoring the sea ice cover in this period of the year is crucial because it represents the annual minimum sea ice coverage in the Antarctic. These measurements provide a vital indicator on the changes happening every year, as they serve as a reference for seasonal contrasts in sea ice cover.
Recent changes in the Antarctic Sea ice extent trend are, according to scientists, a probable consequence of a decades-long ocean warming trend and atmospheric circulation changes (Eayrs et al, 2019). Other processes may be contributing to the acceleration in sea ice loss in the Antarctic, including marine heat wave events. No scientific study has demonstrated that Antarctic Sea ice loss can be attributed to the occurrence of marine heat waves. However, the study of Zhang et al., 2022 shows that the warming of subsurface water masses in the Southern Ocean could play a role in sea ice melting.
Antarctic Sea Ice Extent
Since the beginning of May, which is generally the beginning of a time when sea ice grows during the austral autumn and winter, Antarctic Sea ice is at a record-low. It sits at approximately 1.8 million km2 below the long-term average (1993-2010). This year 2023, Antarctic Sea ice has reached its maximum annual extent on the 7th of September, extending to 16.8 million km2, which is 1.9 million of km2 less compared to the 1993-2010 average for the same date. This corresponds to a sea ice loss of 3 times the size of France (all regions). Last year, 2022, was already at a low with 18.4 million km2 of sea ice. This is the first time since the beginning of the satellite record (1979) that Antarctic sea ice extent is below 17 million km2.
The September 2023 maximum is at an unprecedented low and indicates that sea ice has not well been reformed in the cold season of the southern hemisphere. Figure 1 illustrates the Antarctic Sea ice concentration for the 7th of September 2023 in dark red well below the previous record-low in 2022 (orange line). These are both far below the sea ice concentration for the long-term average between1993-2010 (grey line) for the same date in the year. Compared to the 1993-2010 period, large areas of sea ice cover are missing in the Atlantic and Pacific sectors while it is slightly compensated in Bellingshausen Sea (figure 1).
Subtitle 2
Since the beginning of May, which is generally the beginning of a time when sea ice grows during the austral autumn and winter, Antarctic Sea ice is at a record-low. It sits at approximately 1.8 million km2 below the long-term average (1993-2010). This year 2023, Antarctic Sea ice has reached its maximum annual extent on the 7th of September, extending to 16.8 million km2, which is 1.9 million of km2 less compared to the 1993-2010 average for the same date. This corresponds to a sea ice loss of 3 times the size of France (all regions). Last year, 2022, was already at a low with 18.4 million km2 of sea ice. This is the first time since the beginning of the satellite record (1979) that Antarctic sea ice extent is below 17 million km2.
The September 2023 maximum is at an unprecedented low and indicates that sea ice has not well been reformed in the cold season of the southern hemisphere. Figure 1 illustrates the Antarctic Sea ice concentration for the 7th of September 2023 in dark red well below the previous record-low in 2022 (orange line). These are both far below the sea ice concentration for the long-term average between1993-2010 (grey line) for the same date in the year. Compared to the 1993-2010 period, large areas of sea ice cover are missing in the Atlantic and Pacific sectors while it is slightly compensated in Bellingshausen Sea (figure 1).
Title 2
Since the beginning of May, which is generally the beginning of a time when sea ice grows during the austral autumn and winter, Antarctic Sea ice is at a record-low. It sits at approximately 1.8 million km2 below the long-term average (1993-2010). This year 2023, Antarctic Sea ice has reached its maximum annual extent on the 7th of September, extending to 16.8 million km2, which is 1.9 million of km2 less compared to the 1993-2010 average for the same date. This corresponds to a sea ice loss of 3 times the size of France (all regions). Last year, 2022, was already at a low with 18.4 million km2 of sea ice. This is the first time since the beginning of the satellite record (1979) that Antarctic sea ice extent is below 17 million km2.
Subtitle 1
Since the beginning of May, which is generally the beginning of a time when sea ice grows during the austral autumn and winter, Antarctic Sea ice is at a record-low. It sits at approximately 1.8 million km2 below the long-term average (1993-2010). This year 2023, Antarctic Sea ice has reached its maximum annual extent on the 7th of September, extending to 16.8 million km2, which is 1.9 million of km2 less compared to the 1993-2010 average for the same date. This corresponds to a sea ice loss of 3 times the size of France (all regions). Last year, 2022, was already at a low with 18.4 million km2 of sea ice. This is the first time since the beginning of the satellite record (1979) that Antarctic sea ice extent is below 17 million km2.
Since the beginning of May, which is generally the beginning of a time when sea ice grows during the austral autumn and winter, Antarctic Sea ice is at a record-low. It sits at approximately 1.8 million km2 below the long-term average (1993-2010). This year 2023, Antarctic Sea ice has reached its maximum annual extent on the 7th of September, extending to 16.8 million km2, which is 1.9 million of km2 less compared to the 1993-2010 average for the same date. This corresponds to a sea ice loss of 3 times the size of France (all regions). Last year, 2022, was already at a low with 18.4 million km2 of sea ice. This is the first time since the beginning of the satellite record (1979) that Antarctic sea ice extent is below 17 million km2.
Subtitle 2

Since the beginning of May, which is generally the beginning of a time when sea ice grows during the austral autumn and winter, Antarctic Sea ice is at a record-low. It sits at approximately 1.8 million km2 below the long-term average (1993-2010). This year 2023, Antarctic Sea ice has reached its maximum annual extent on the 7th of September, extending to 16.8 million km2, which is 1.9 million of km2 less compared to the 1993-2010 average for the same date. This corresponds to a sea ice loss of 3 times the size of France (all regions). Last year, 2022, was already at a low with 18.4 million km2 of sea ice. This is the first time since the beginning of the satellite record (1979) that Antarctic sea ice extent is below 17 million km2.
The September 2023 maximum is at an unprecedented low and indicates that sea ice has not well been reformed in the cold season of the southern hemisphere. Figure 1 illustrates the Antarctic Sea ice concentration for the 7th of September 2023 in dark red well below the previous record-low in 2022 (orange line). These are both far below the sea ice concentration for the long-term average between1993-2010 (grey line) for the same date in the year. Compared to the 1993-2010 period, large areas of sea ice cover are missing in the Atlantic and Pacific sectors while it is slightly compensated in Bellingshausen Sea (figure 1).
The September 2023 maximum is at an unprecedented low and indicates that sea ice has not well been reformed in the cold season of the southern hemisphere. Figure 1 illustrates the Antarctic Sea ice concentration for the 7th of September 2023 in dark red well below the previous record-low in 2022 (orange line). These are both far below the sea ice concentration for the long-term average between1993-2010 (grey line) for the same date in the year. Compared to the 1993-2010 period, large areas of sea ice cover are missing in the Atlantic and Pacific sectors while it is slightly compensated in Bellingshausen Sea (figure 1).
Forecasts for November 14
Global Ocean
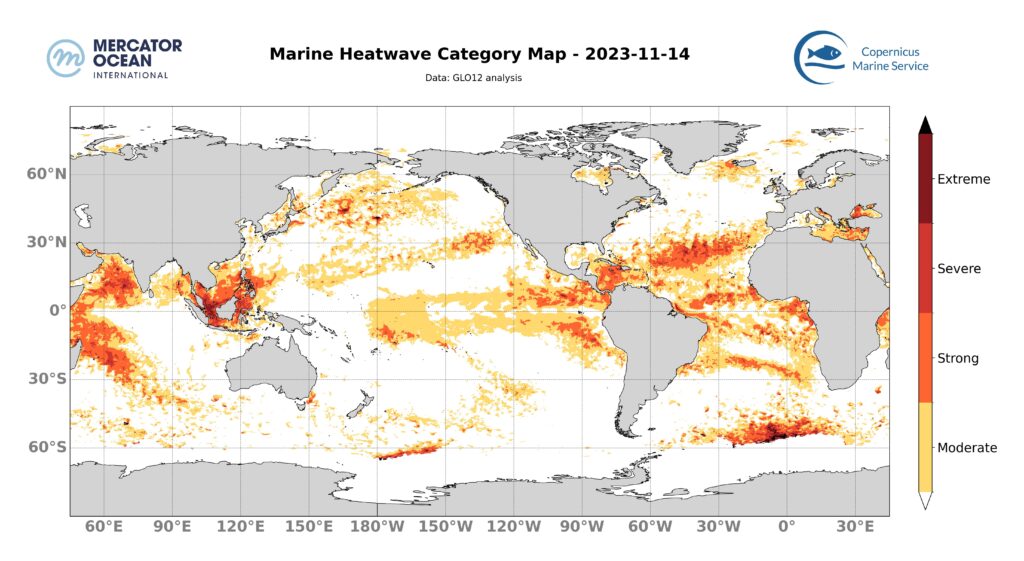
For November 14, MOi forecasts that the marine heatwave in the Tropical Atlantic will remain stable with moderate to strong categories. The marine heatwave in the Caribbean Sea is decreasing in intensity from strong to severe to moderate to strong. In the Southern Tropical Atlantic, a marine heatwave is appearing with moderate to strong levels.
In the Tropical Pacific, the situation remains stable. In the western tropical Pacific, the marine heatwave is becoming more intense, with locally extreme levels.
The marine heatwave in the North Pacific is diminishing in extent but remains at moderate to locally strong levels overall.
The marine heatwave in the south-west Indian Ocean is decreasing in extent in its eastern part. In the western part of the Indian Ocean, the marine heatwave is intensifying, reaching high levels over most of the area.
In the South-East Asian seas, the marine heatwave remains stable at strong to extreme levels.
Europe Zone
For November 14, the Mercator Ocean International (MOi) forecasting system predicts a slight re-intensification of the marine heatwave around the Iberian Peninsula and the Moroccan coast with moderate categories.
The marine heatwave in the western Mediterranean is easing. The eastern part of the basin remains stable with moderate to strong marine heatwaves.
In the South-East Asian seas, the marine heatwave remains stable at strong to extreme levels.
⇒ Discover the Mercator Ocean Marine Heatwave Bulletin.
Copernicus Marine products used:
- GLORYS12V1 global ocean eddy-resolving (1/12° horizontal resolution, 50 vertical levels) reanalysis covering the altimetry (1993 onward). https://doi.org/10.48670/moi-00021
- The Operational Mercator global ocean analysis and forecast system at 1/12 degree. https://doi.org/10.48670/moi-00016
References:
Zhang, L., Delworth, T.L., Yang, X. et al. The relative role of the subsurface Southern Ocean in driving negative Antarctic Sea ice extent anomalies in 2016–2021. Commun Earth Environ 3, 302 (2022). https://doi.org/10.1038/s43247-022-00624-1
Jean-Michel L, Eric G, Romain Bé-B, Gilles G, Angélique M, Marie D, Clément B, Mathieu H, Olivier LG, Charly R, Tony C, Charles-Emmanuel T, Florent G, Giovanni R, Mounir B, Yann D and Pierre-Yves LT (2021) The Copernicus Global 1/12° Oceanic and Sea Ice GLORYS12 Reanalysis. Front. Earth Sci. 9:698876. doi: 10.3389/feart.2021.698876
Lellouche, J.-M., Greiner, E., Le Galloudec, O., Garric, G., Regnier, C., Drevillon, M., Benkiran, M., Testut, C.-E., Bourdalle-Badie, R., Gasparin, F., Hernandez, O., Levier, B., Drillet, Y., Remy, E., and Le Traon, P.-Y.: Recent updates to the Copernicus Marine Service global ocean monitoring and forecasting real-time 1∕12° high-resolution system, Ocean Sci., 14, 1093–1126, https://doi.org/10.5194/os-14-1093-2018, 2018.