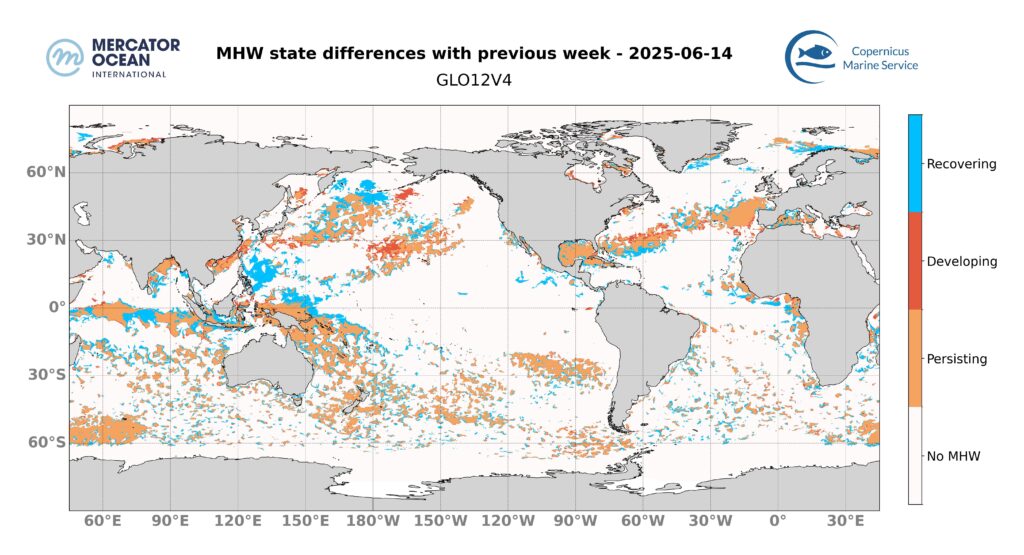
The marine heatwave bulletin provides forecasts and analysis of marine heatwave events across the globe and throughout the year. Used datasets include observations (satellite sea surface temperature maps) and numerical model analyses (assimilating satellite and in situ observations) to derive marine heatwave forecasts for a 10-day period. This week’s forecasts were produced using as a comparison the marine heatwave situation on 3/06/2025.
Global ocean
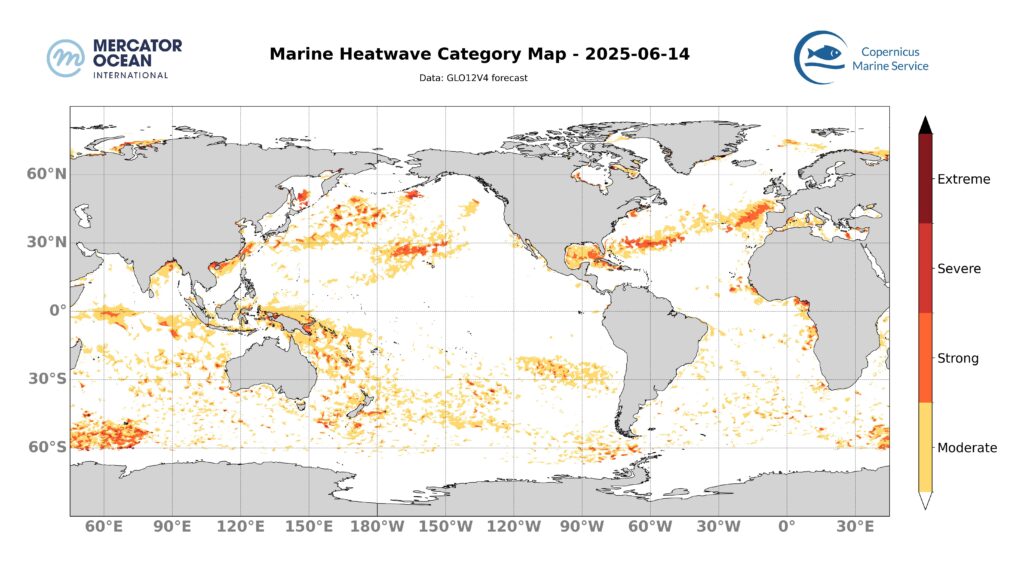
Tropical Atlantic
The marine heatwave in the Gulf of Mexico decreases in intensity as the strong category is reduced. The marine heatwave east of Florida intensifies, with more surface area in the strong category, but the overall surface area of the MHW decreases.
North Pacific
The marine heatwave in the center of the basin at around 30°N is intensifying, with the appearance of strong categories. The marine heatwave to the north-west of the basin remains stable overall, with moderate and strong categories.
Tropical Pacific
The marine heatwave east of the Philippines disappears. The marine heatwave around Papua New Guinea is decreasing in intensity and is now generally classified as moderate.
Indian Ocean
The marine heatwave in the middle of the basin is decreasing in extent, and only a few scattered moderate marine heatwaves remain.
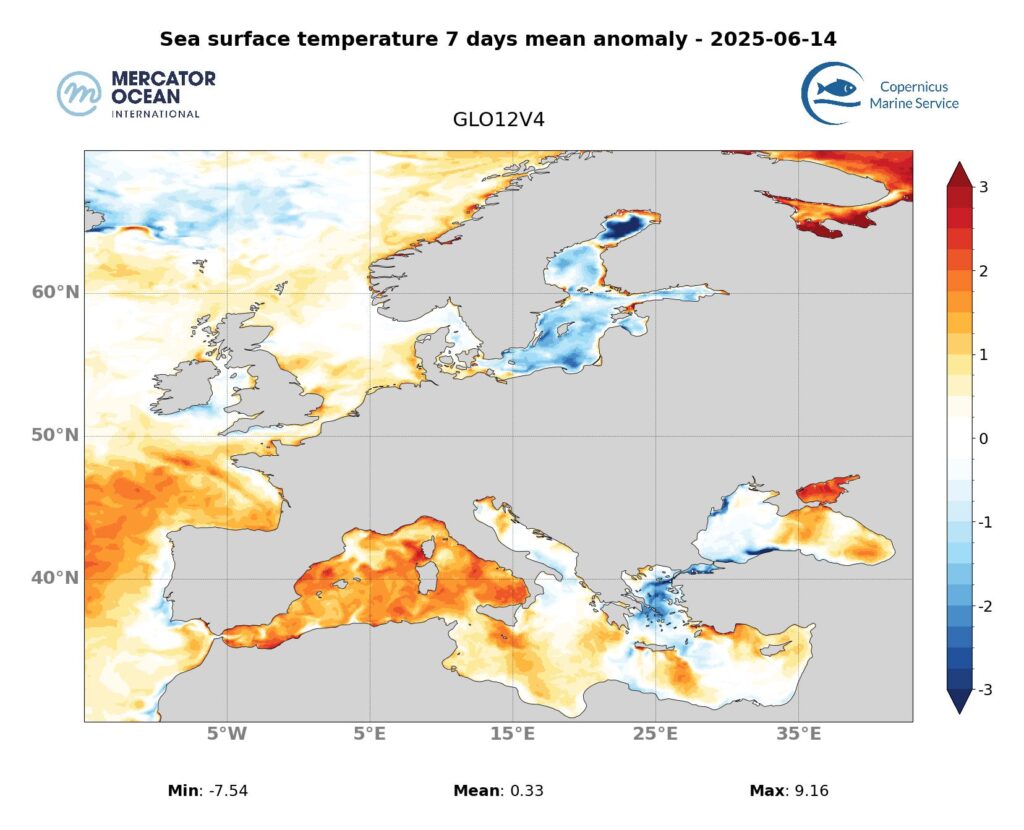
European Zone
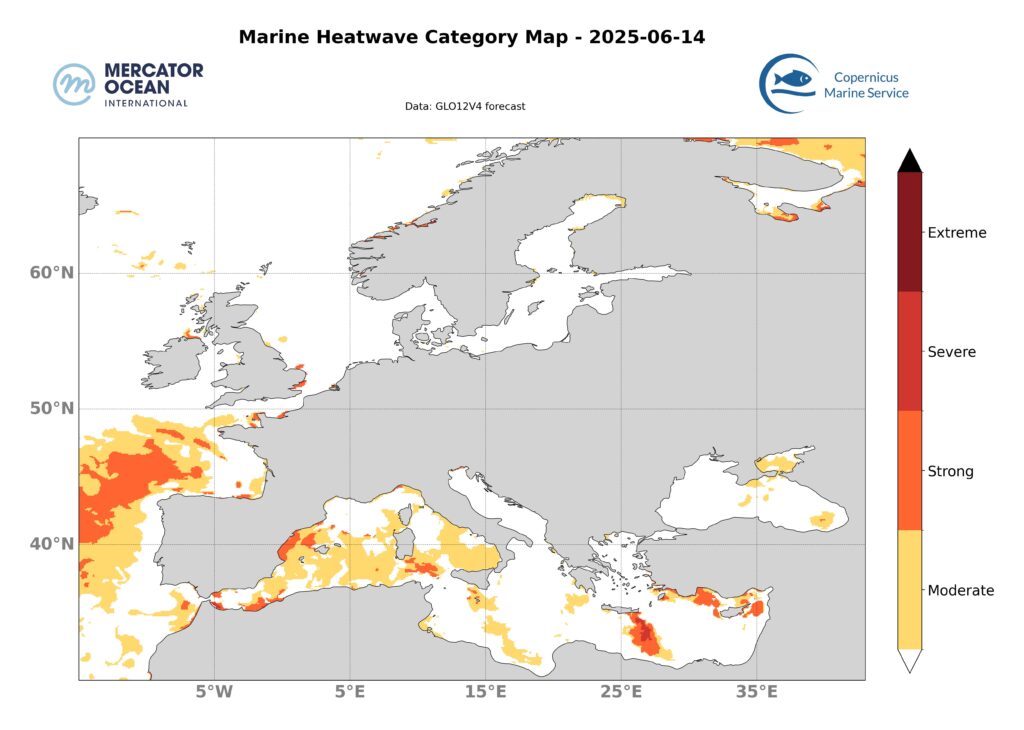
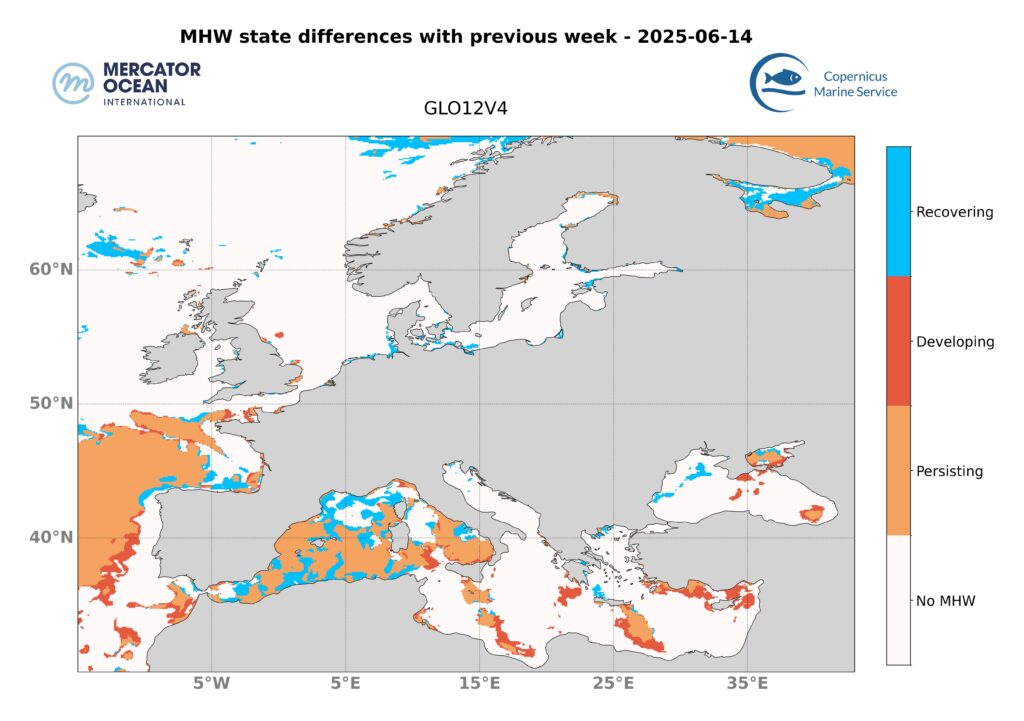
North Atlantic Ocean
The marine heatwave to the west of France and Spain diminished in intensity with the disappearance of the strong categories, but increased in surface area.
Weekly Temperature Anomalies
8 – 14 June 2025
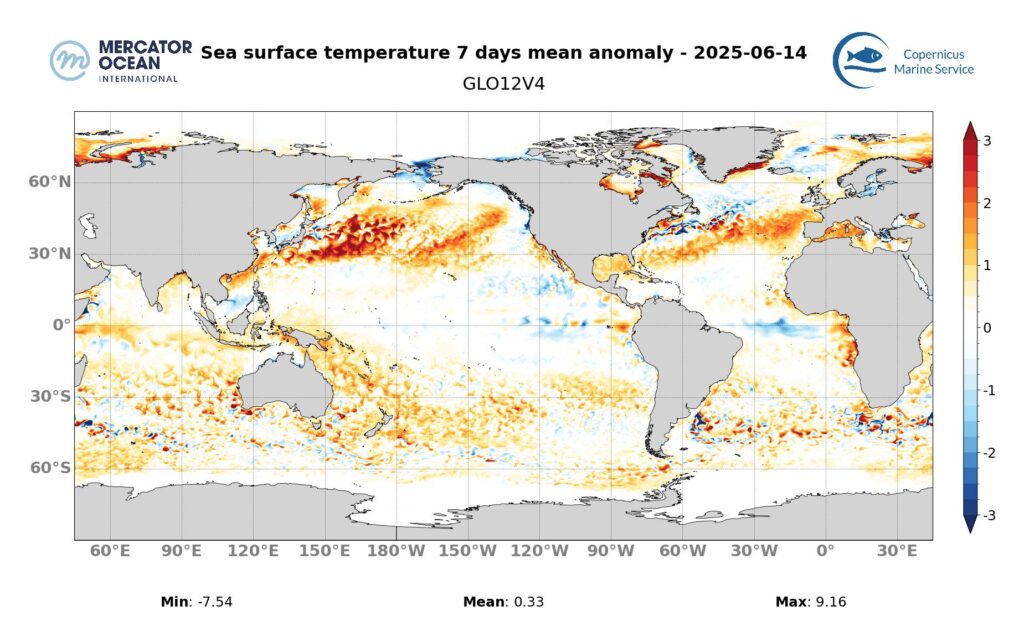
Mean sea surface temperature anomalies in each ocean region for the week 8 to 14 May , 2025.
| North Atlantic | -3°C to 3°C |
| Tropical Atlantic | -1°C to 2°C |
| North Pacific | -1°C to 3°C |
| Tropical Pacific | -1°C à 2°C |
| Indian Ocean | -0.5°C to 2°C |
Access the Daily Global Physical Bulletin for a 9-day forecast here.
SURVEY
Help us improve our content! Answer a quick survey about this bulletin here.
Notes
Datasets and products :
Global Ocean Physics Analysis and Forecast (sea surface temperature) E.U. Copernicus Marine Service/ Mercator Ocean International. https://doi.org/10.48670/moi-00016
Categories
Categories Select Category Events Marine Heatwave Bulletin News Non classé @en Ocean Temperature Bulletin presse Sea Ice Bulletin Spotted in the media
Tags
altrimetry Antarctique Argo Climate Change CMEMS Connaissance de l’environnement océanique COP21 Copernicus copernicus marine Copernicus Marine Environment Copernicus Marine Service Decade Collaborative Centre digital ocean Digital Twin Ocean EUDTO EUMETSAT European Space Solutions GEO Blue Planet GMMC GOOS IGO international ocean governance IOC-UNESCO jason-3 Jason-3 data Jean-Louis Etienne Météo France North-West Shelf Ocean Decade ocean governance ocean observation Ocean Observing System Ocean prediction Ocean State Report Oil Spill OSR partnership plastic pollution S-100 satellite sea level Sentinel Sentinel-3A UN Ocean Decade