Key takeaways
- The period January – June 2025 was the 3rd warmest first semester on record (after 2023 and 2024) for the North Atlantic (between 0°N and 60°N) with a mean Sea Surface Temperature (SST) of 21.18 ± 0.09°C.
- The first semester of 2025 was the third most extreme in terms of MHWs.
North Atlantic Region – 0°N and 60°N
January to June 2025: SST and SST anomaly
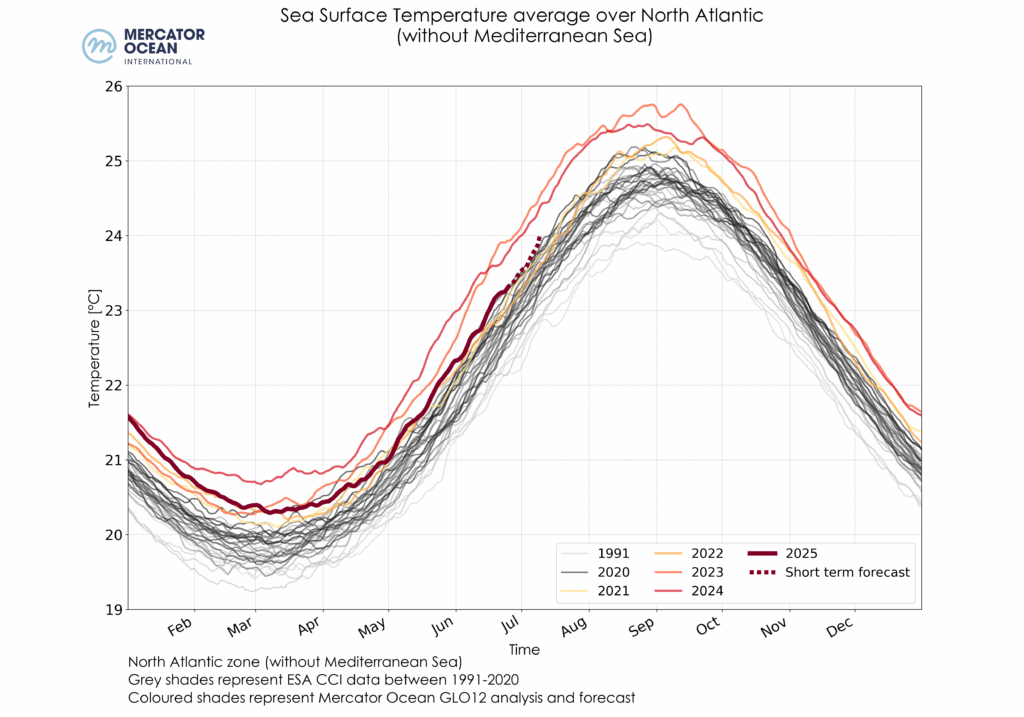
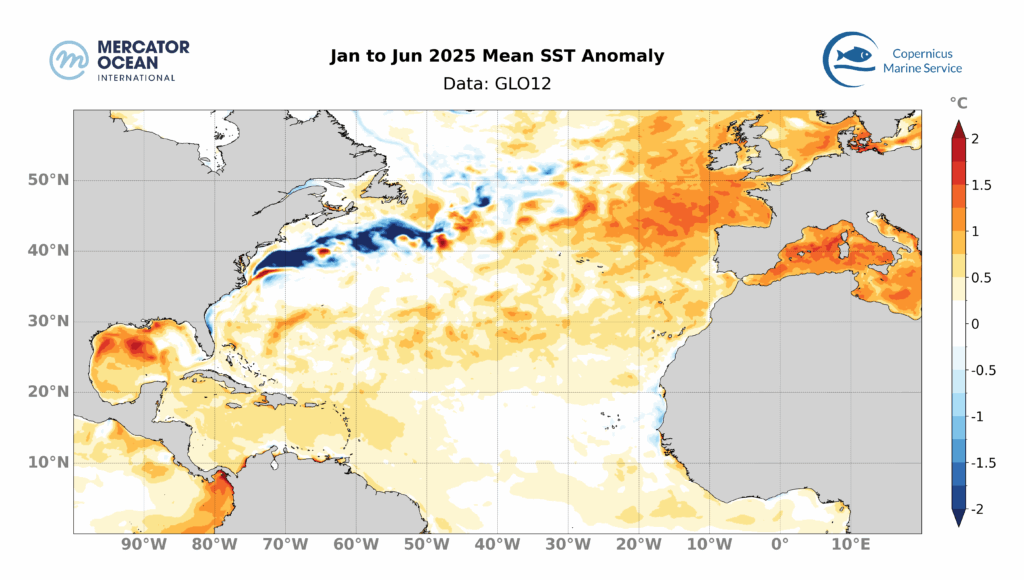
Figure 1: Top: Daily sea surface temperatures averaged for the North Atlantic (0°N and 60°N) between 1991-2020 using ESA’s Climate Change Initiative (gray shades), and between 2021-2025 (colored shades) using Mercator Ocean International’s GLO12 analysis.Bottom: : Jan to Jun 2025 Mean SST Anomaly relative to a 30-year climatology (1993-2022), calculated using daily data from Mercator Ocean International’s GLO12 analysis for 2025 and from GLORYS12 reanalysis for the climatological mean.
- The first half of 2025, from January to June, was the 3rd warmest first semester on record (after 2023 and 2024) for the North Atlantic (between 0°N and 60°N) with a mean Sea Surface Temperature (SST) of 21.18 ± 0.09°C.
- For this period, mean SSTs are above average for 89% of the North Atlantic (between 0°N and 60°N), with highest values reached toward Europe and in the Gulf of Mexico.
Highest first semester mean SST toward Europe
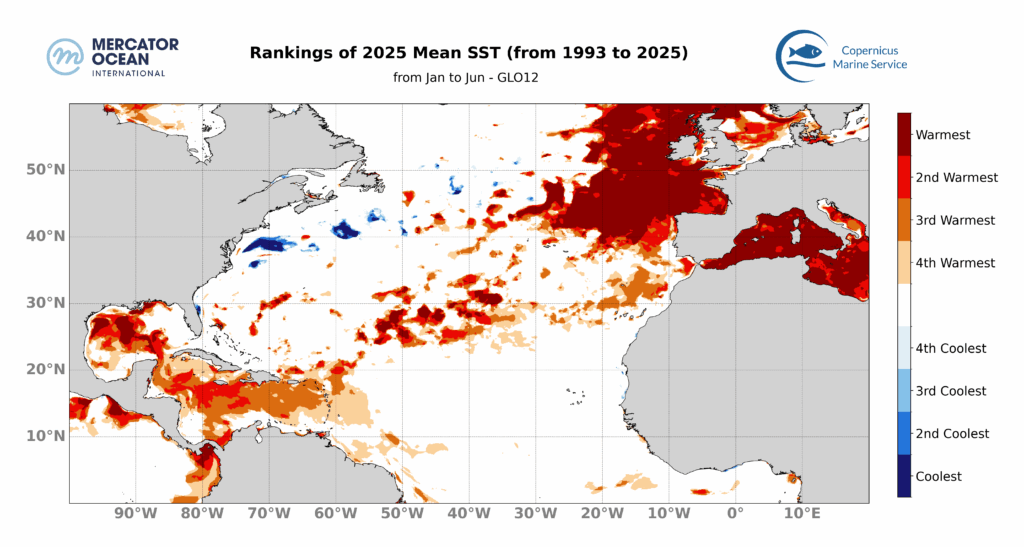
- January to June 2025 SST mean values are compared to those from previous years (since 1993). For each area of the North Atlantic, we show where the SST for the first semester of 2025 corresponded to the highest observed, warmer than usual (being part of the 4 warmest years), or inversely corresponded to the lowest SST, or was colder than usual (amongst 4 coldest years) using the 34-year period of study.
- During the first half of 2025, 29% of the North Atlantic experienced SSTs ranking in the 4 warmest since 1993 (figure 3). The European coast is the most impacted region, where SSTs have been the warmest for this period since 1993 (dark red on figure 3). In contrast, only 1% of the basin ranked among the 4 coldest years, mainly in the Gulf Stream region.
2025 Monthly sea surface temperature
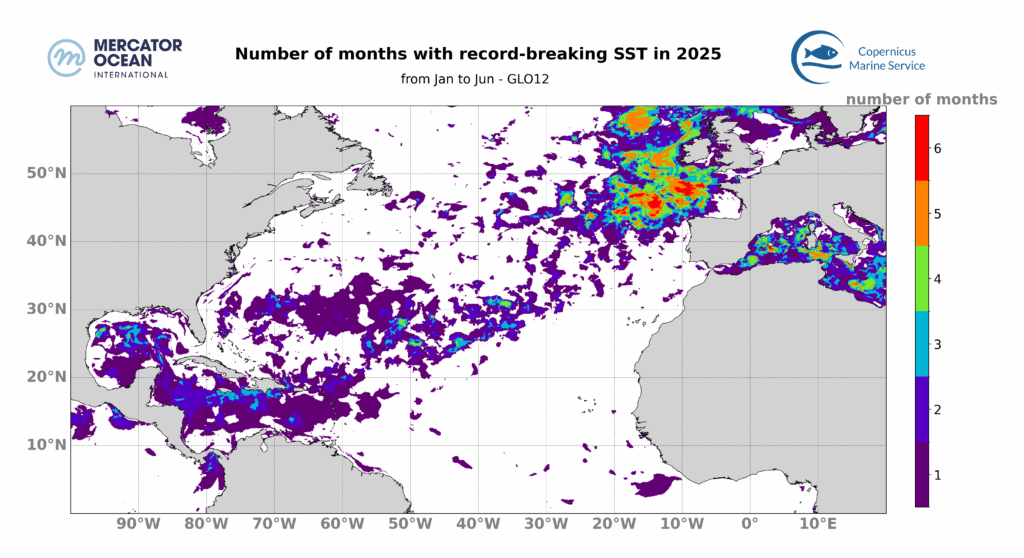
We also look at the number of months of 2025 between January and June for which record monthly means were recorded (Figure 4). For instance, regions in green correspond to areas where SST records were broken for 4 months between January and June 2025.
- The eastern North Atlantic off the coast of France and the United Kingdom showed a widespread very warm region with 4 to 6 months of record monthly mean temperatures.
- Overall, 29% of the North Atlantic (between 0°N and 60°N) experienced at least one month with a record-breaking mean SST.
MARINE HEATWAVES
Marine heatwaves (MHWs) are extreme rises in ocean temperature for an extended period of time (at least 5 consecutive days). They can occur at different locations in the ocean, and their magnitude and frequency have increased over the last couple of decades, with harmful impacts on ecosystems, and human activities.
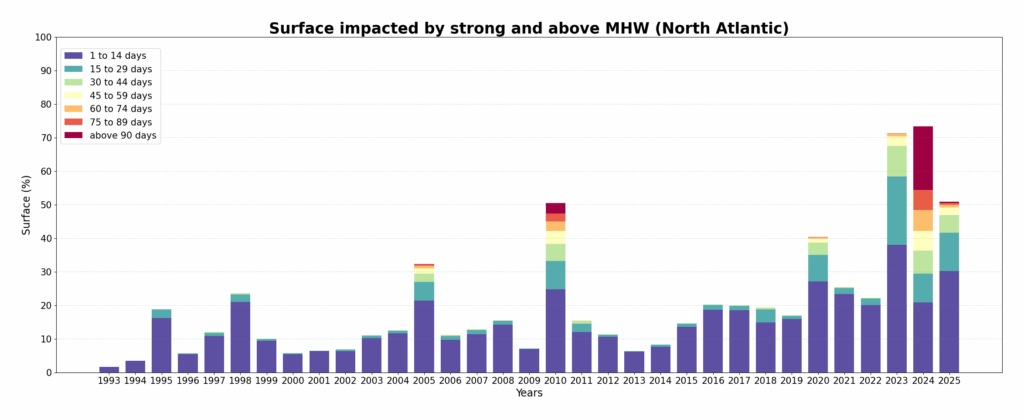
Highest Marine Heatwave categories reached in 2024
MHW can be classified based on their intensity into 4 categories (moderate, strong, severe, or extreme). Here we look at the highest category reached in each region during the first semester of 2025. For instance, North Atlantic regions in orange correspond to areas where the highest MHW category reached during 2025 is strong (meaning that no severe nor extreme MHWs occurred in those regions). We then measure the extent of the highest category and monitor its evolution since 1993.
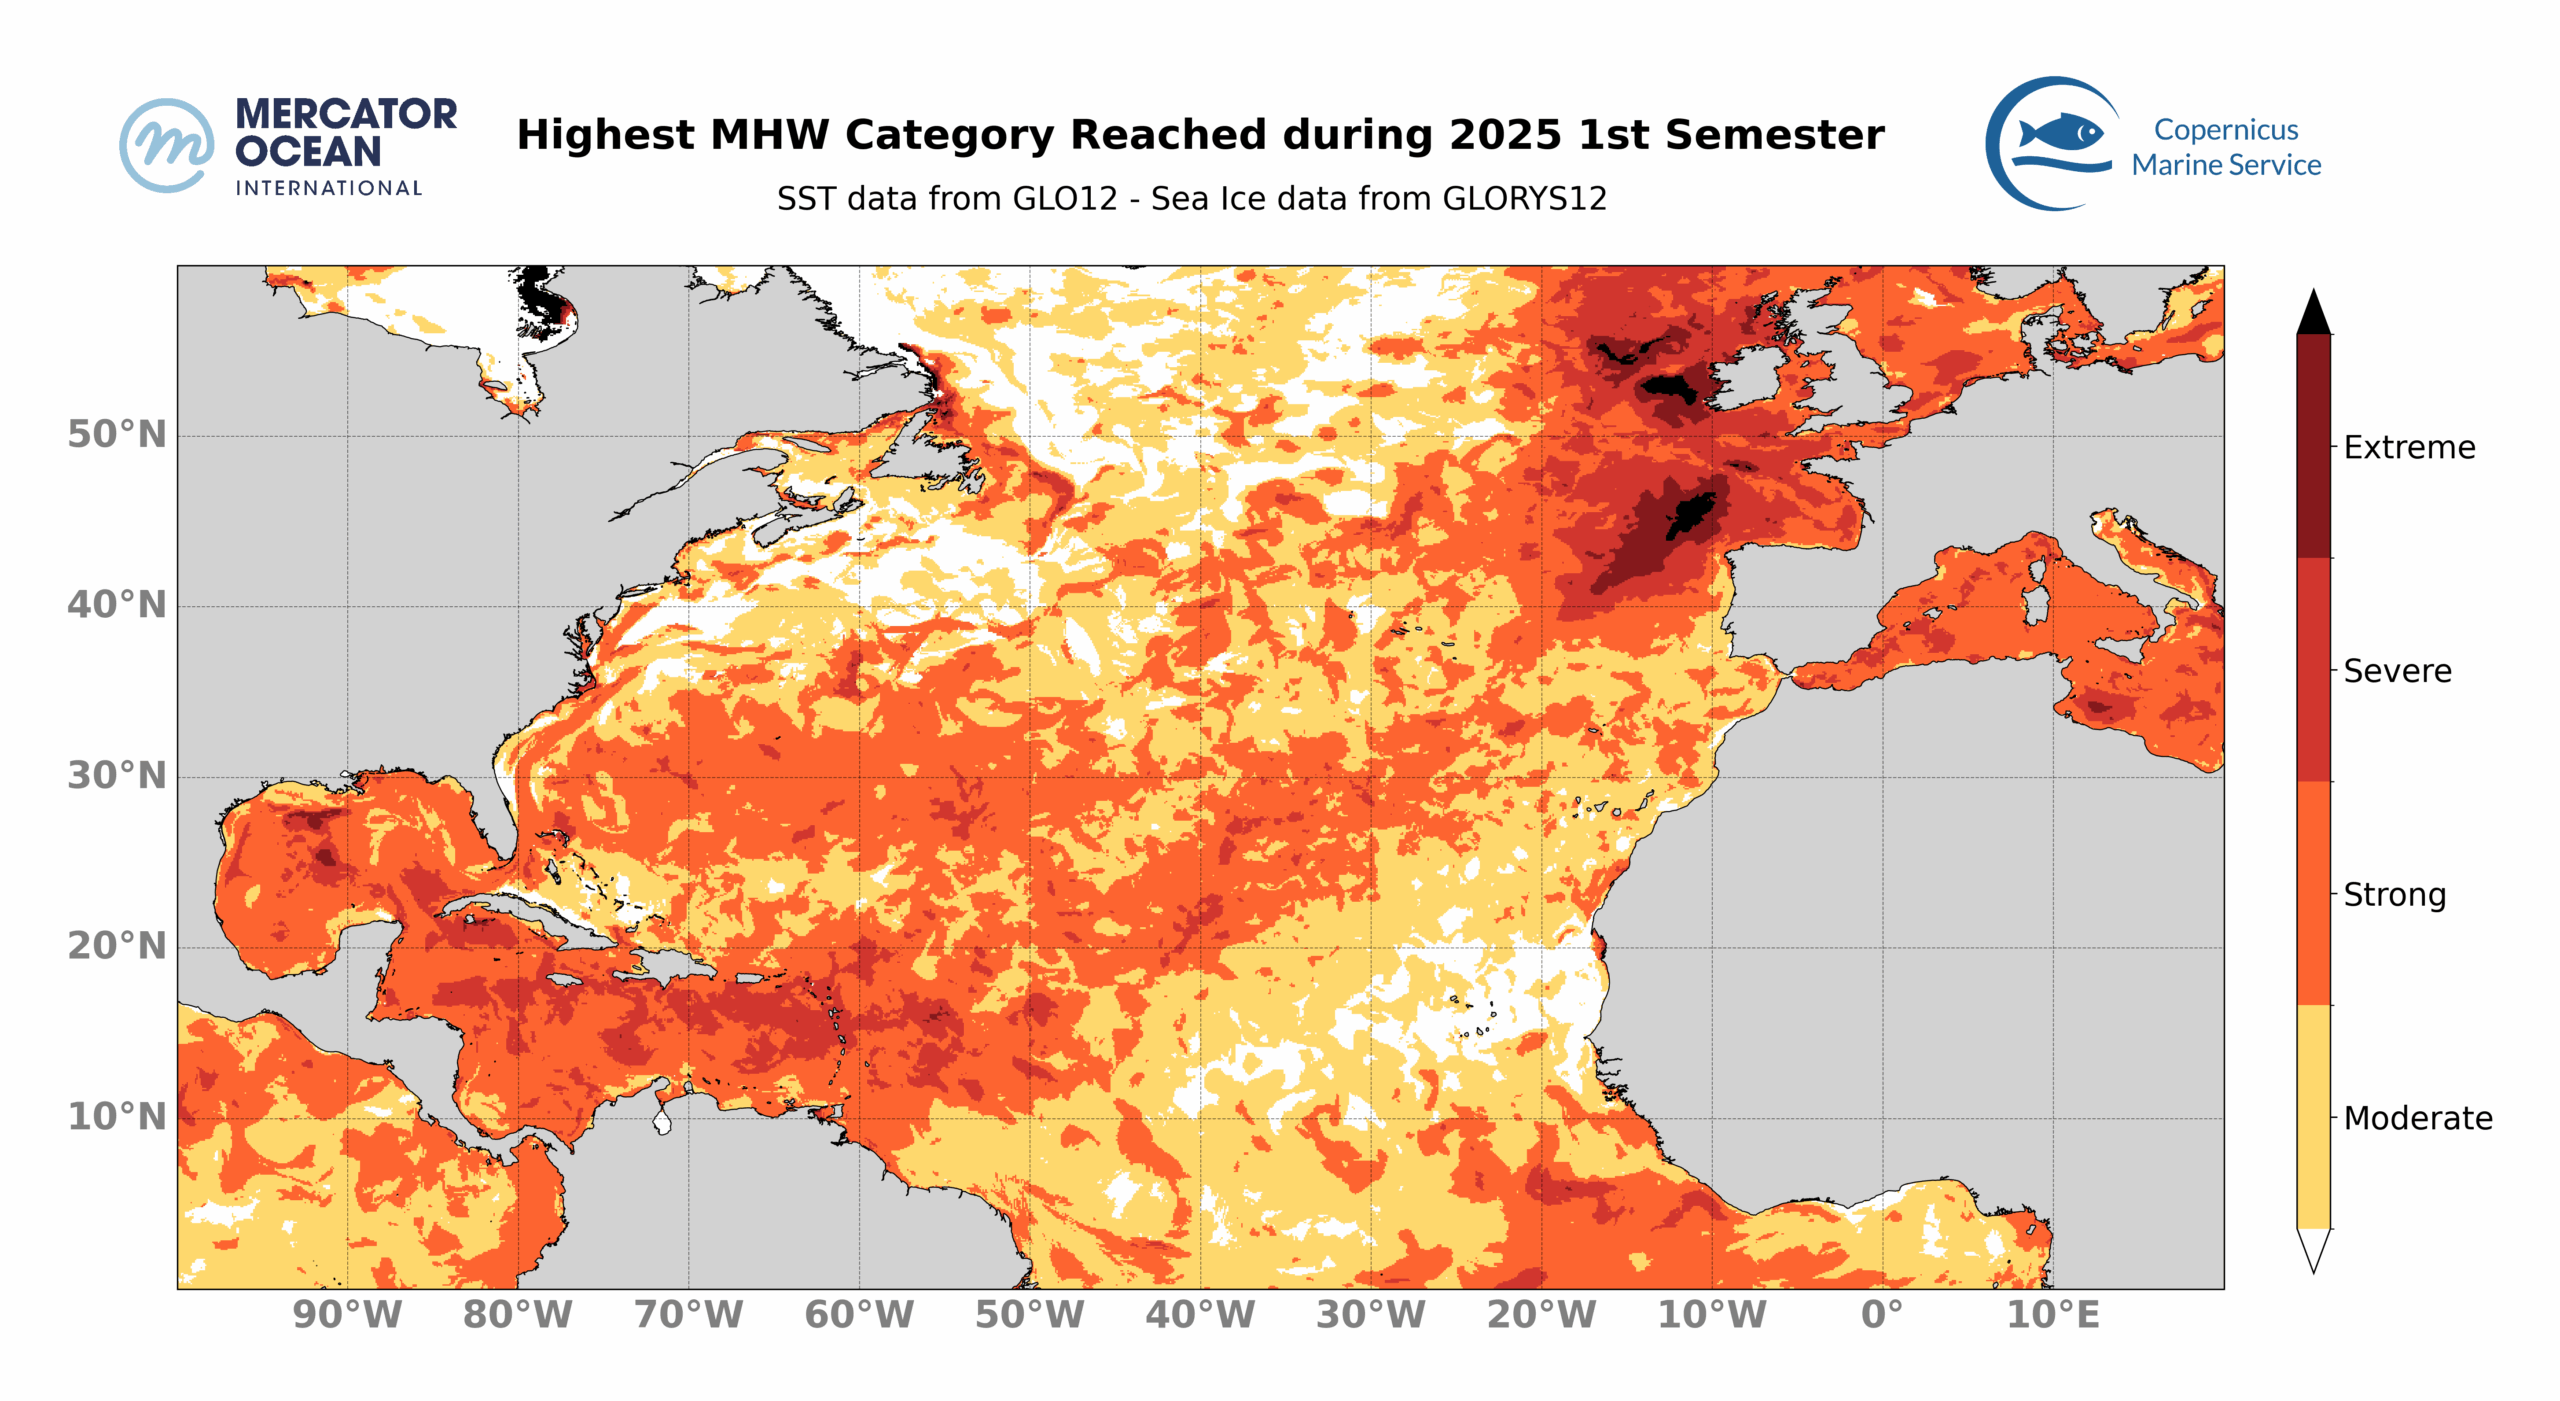
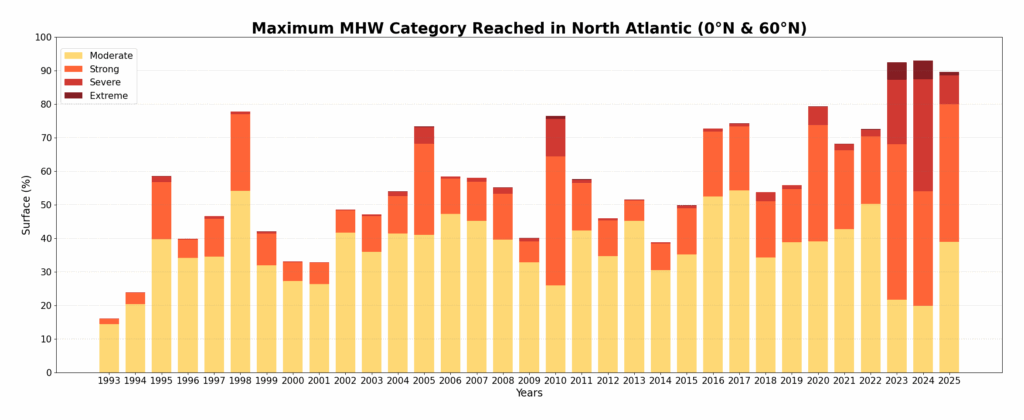
Figure 5: Evolution of the extent of the highest MHW category. For each year, the length of the bar represents the percentage of the region impacted by MHW, while the colors indicate the proportion of the highest categories reached within that region. The horizontal dotted line represents the average surface of the region impacted by MHW during the semester between 1993 and 2025. The region displayed is the North Atlantic (between 0°N and 60°N).
- 90% of the North Atlantic (between 0°N and 60°N) was affected by MHW during the first semester of 2025. It is the third largest extent impacted by MHW after 2023 (92%) and 2024 (93%).
- Focusing on strong or higher category MHW events, 51% of the North Atlantic was affected by such MHWs, the third widest extent after 2023 (71%) and 2024 (73%).
Total number of MHW days during 2025 first semesters
We monitor the number of MHW days to highlight the region often impacted or impacted by long MHW. Longer and more regular MHWs increase heat stress on marine ecosystems, especially intense events.
Here we focus on MHWs of strong or higher category and look at the total number of days where such MHWs occurred between January and June 2025. For instance, North Atlantic regions in light green correspond to areas where a total of 30 to 45 days of strong or higher MHW were observed during the first semester of 2025. We then measure the extent of impacted areas and monitor its evolution since 1993.
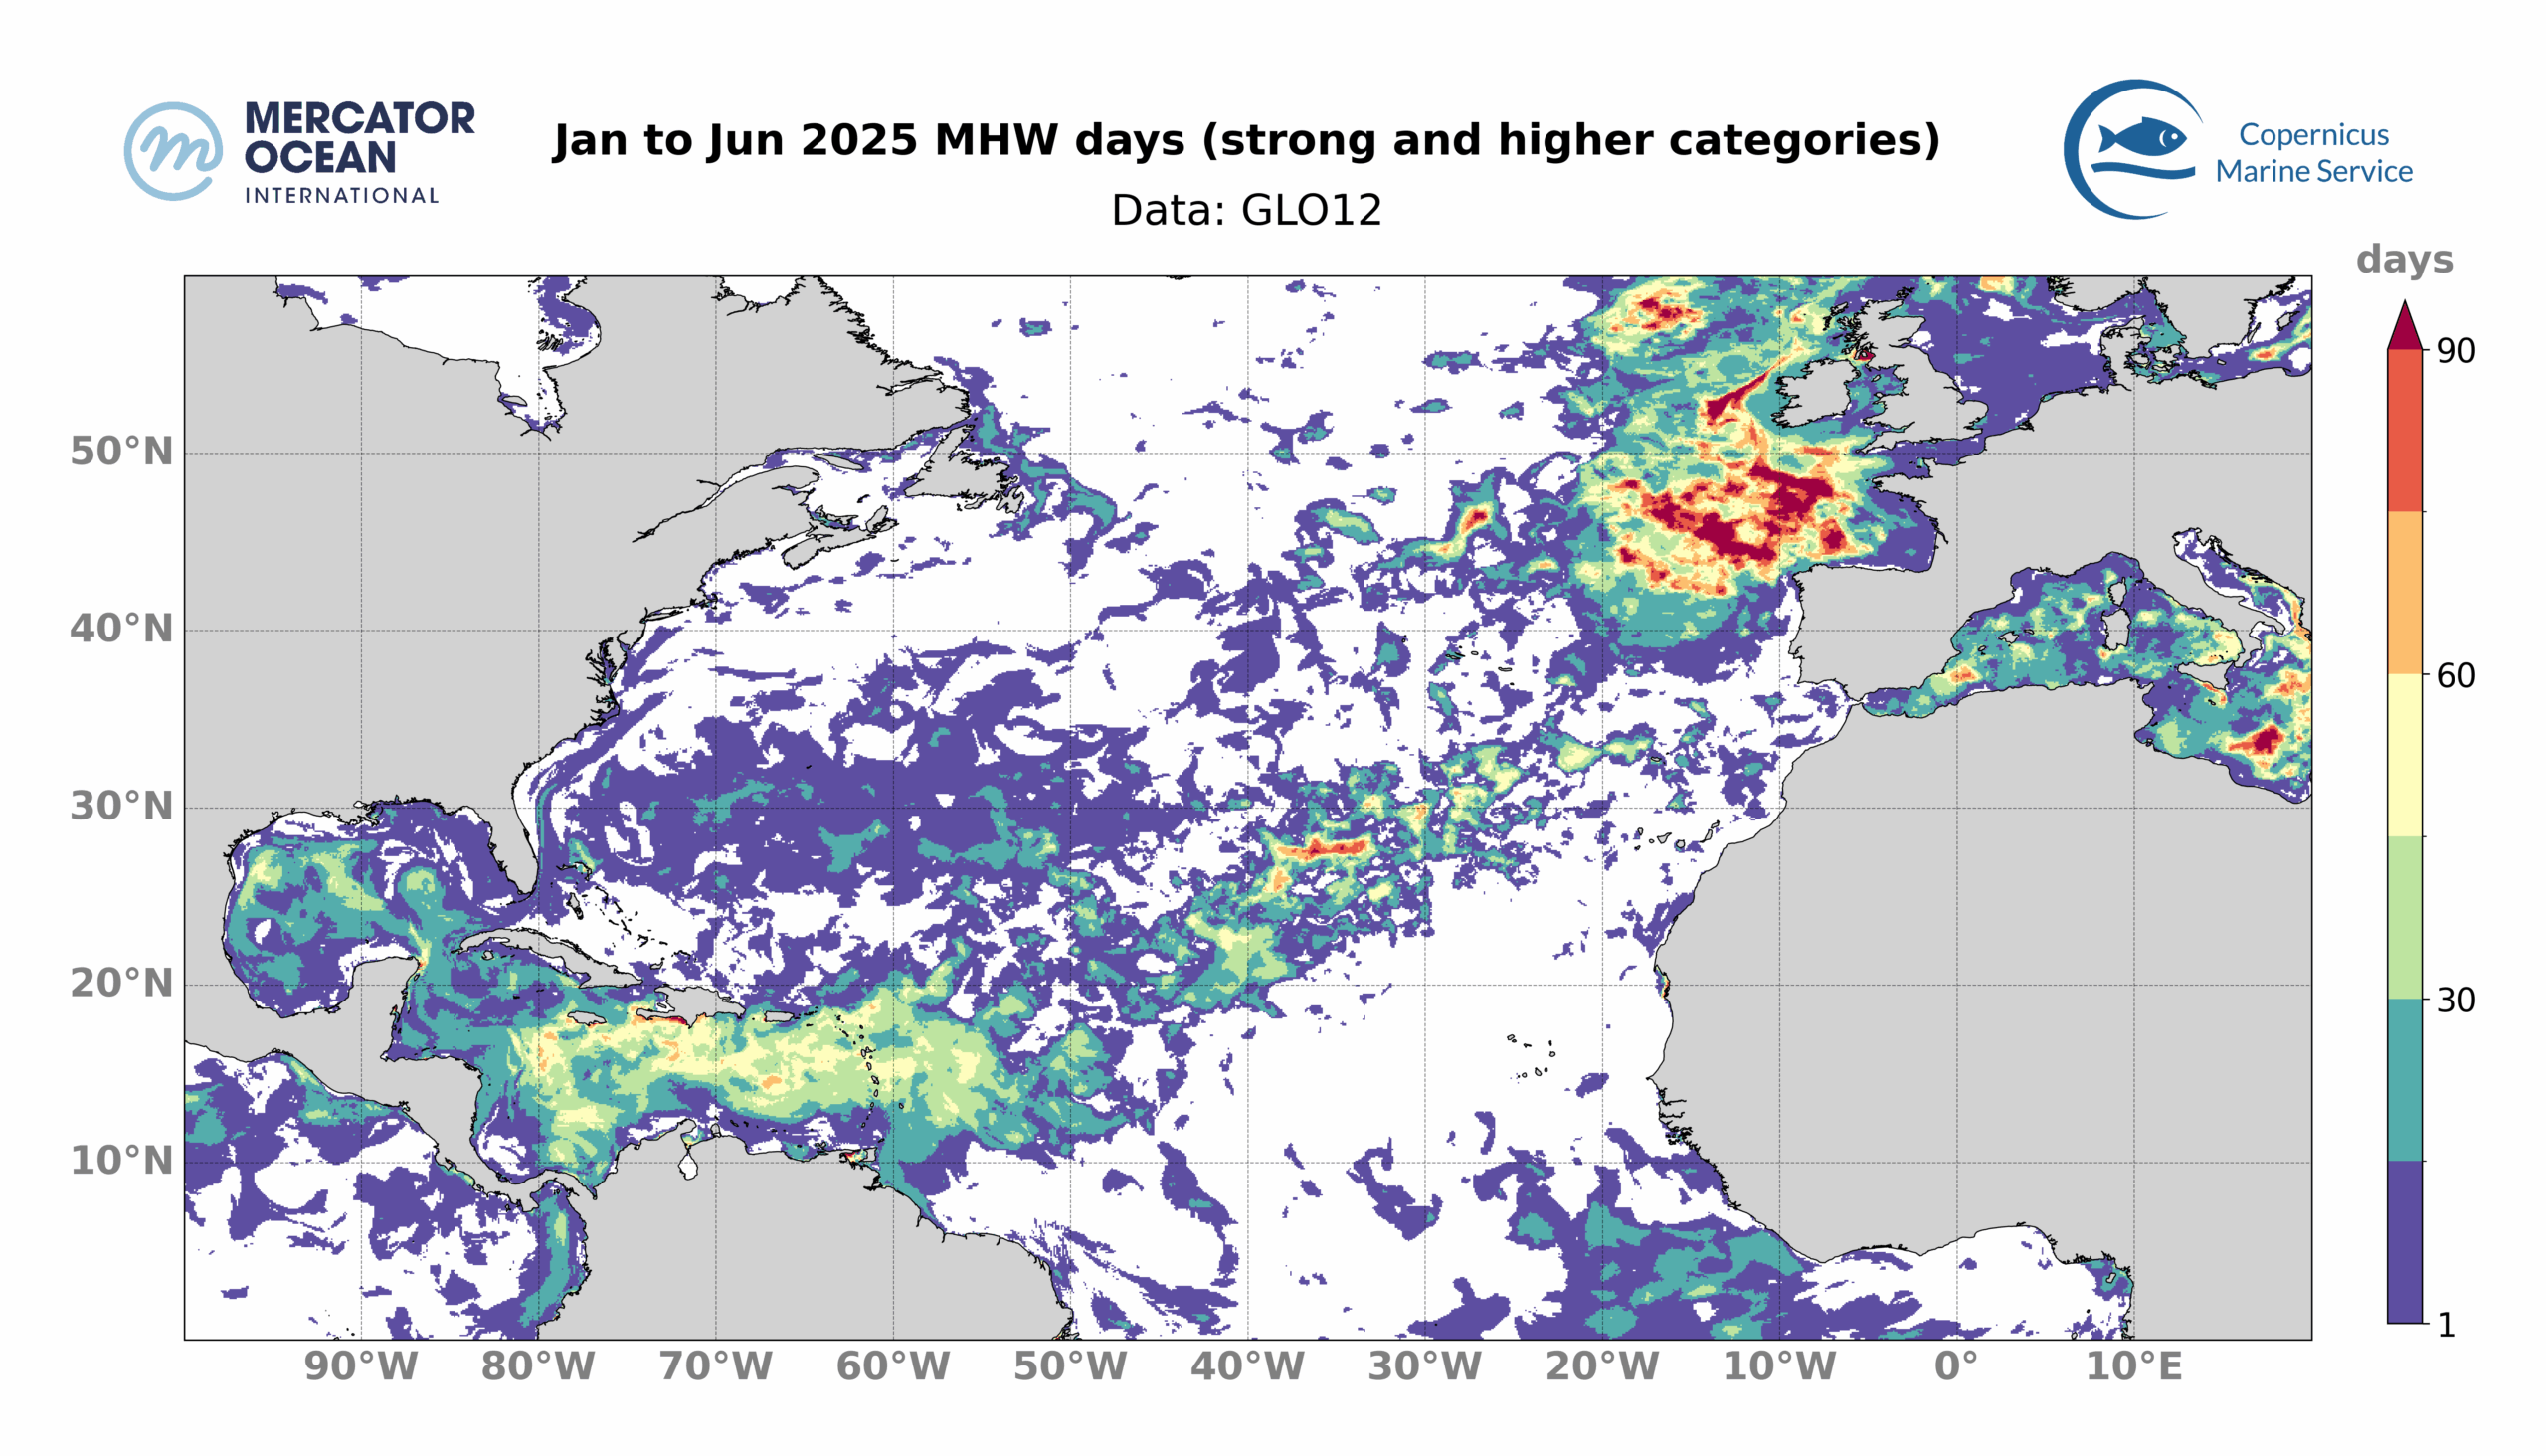
- Between January and June 2025, 21% of the North Atlantic (between 0°N and 60°N) was exposed to intense MHW conditions (i.e. strong or higher category) for more than 15 days (not necessarily consecutive days), and 9% for at least 30 days.
January to June 2025 marine heatwave statistics
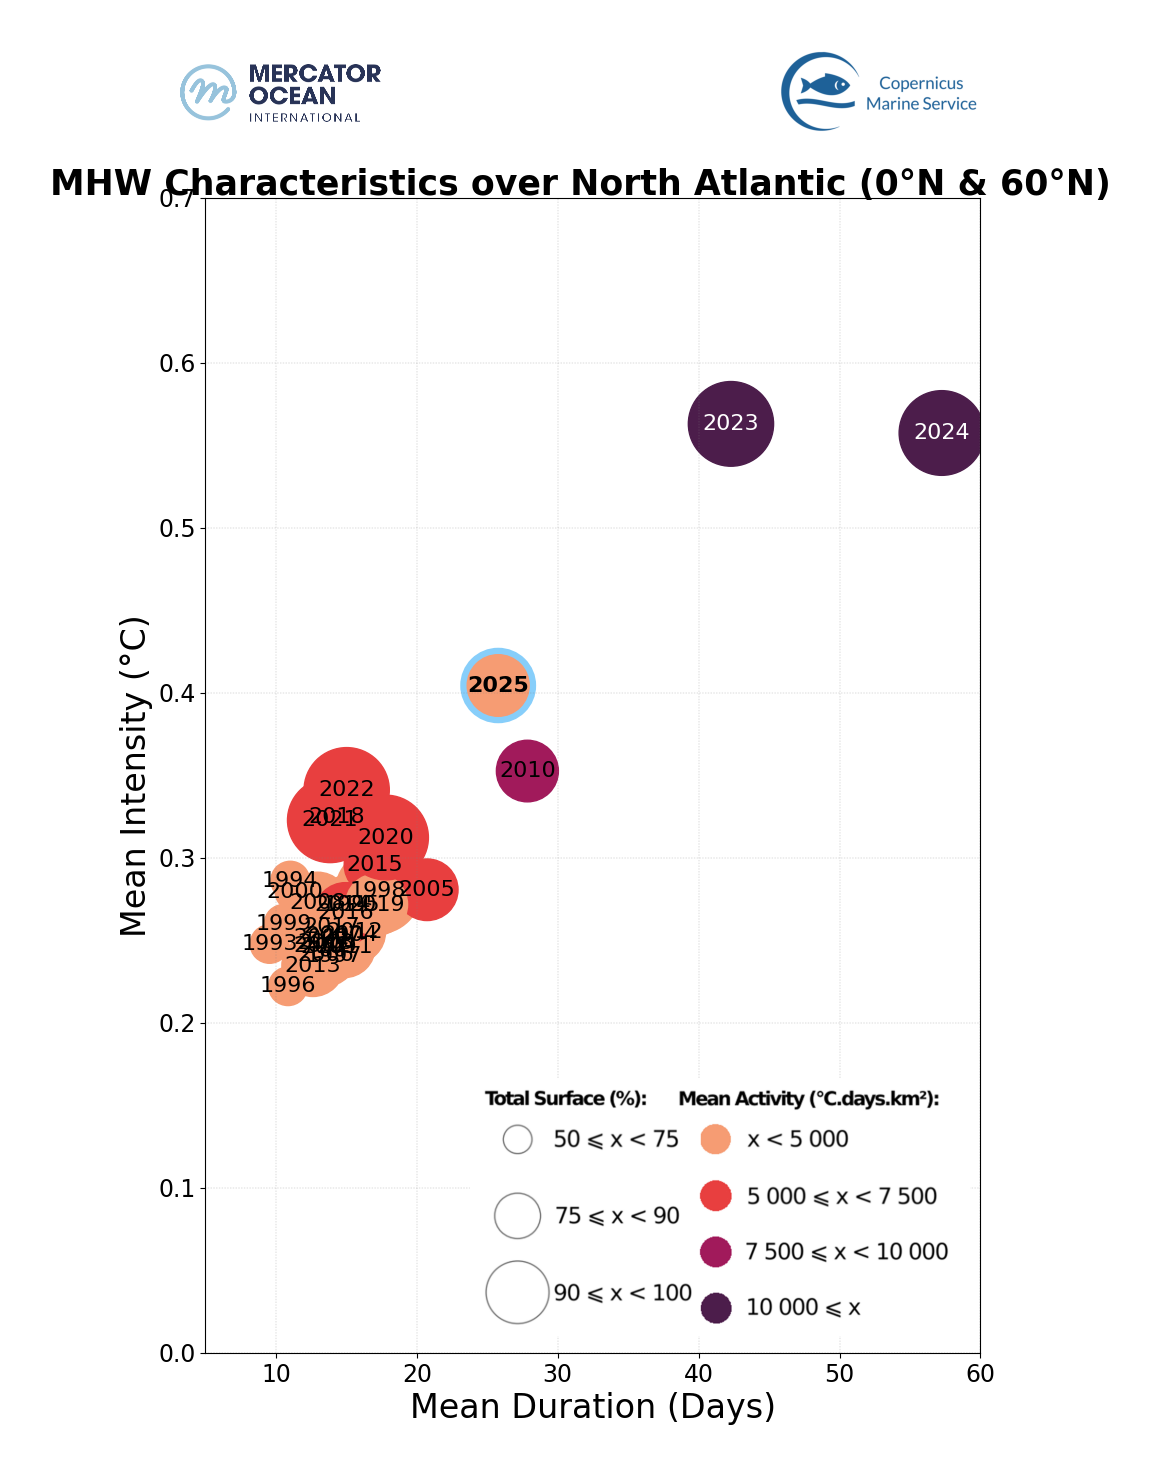
The main MHW mean statistics for a given year – duration, intensity, surface occupied and activity– are combined together in a single-colored bubble on a graph to compare the MHW landscape for different years.
- For the North Atlantic, the first semester of 2025 was the third most extreme in terms of MHWs.
About the bulletin
This mid-year surface temperature bulletin reports on mean temperature and marine heatwave (MHW) conditions for the first semester of the year 2025. This bulletin focuses on the global ocean (between 60°S ans 60°N) and 2 regions: the Mediterranean Sea and the North Atlantic (between 0°N and 60°N). It includes:
- The mean Sea Surface Temperatures and anomalies.
- The highest category reached by MHWs during the first semester of the year,
- The total number of days of exposure to MHW (including only strong and higher intensity categories),
- A comparison of the MHW landscape for different years.
Image citation: European Union, Copernicus Marine Service Data 2025 © Mercator Ocean
All images in this article can be used freely and should be cited with the information above.
Datasets and Products
Sea Surface Temperature
The results are obtained using the Copernicus Marine Service global analysis and forecasting system together with observation-based products.
- GLOBAL_ANALYSISFORECAST_PHY_001_024 Global Ocean Physics Analysis and Forecast sea surface temperature. E.U. Copernicus Marine Service Information. Marine Data Store (MDS). DOI: https://doi.org/10.48670/moi-00016
- ESA SST CCI reprocessed sea surface temperature analyses. E.U. Copernicus Marine Service Information. Marine Data Store (MDS). DOI: https://doi.org/10.48670/moi-00169
- NOAA OI SST V2 High Resolution Dataset data provided by the NOAA PSL, Boulder, Colorado, USA, from their website at https://psl.noaa.gov, Huang, B., C. Liu, V. Banzon, E. Freeman, G. Graham, B. Hankins, T. Smith, and H.-M. Zhang, 2021:
- Improvements of the Daily Optimum Interpolation Sea Surface Temperature (DOISST) Version 2.1, Journal of Climate, 34, 2923-2939. doi: 10.1175/JCLI-D-20-0166.1
- Global Ocean OSTIA Sea Surface Temperature and Sea Ice Analysis. E.U. Copernicus Marine Service Information. Marine Data Store (MDS). DOI: https://doi.org/10.48670/moi-00165
- ODYSSEA Global Sea Surface Temperature Gridded Level 4 Daily Multi-Sensor Observations. E.U. Copernicus Marine Service Information. Marine Data Store (MDS). DOI: https://doi.org/10.48670/moi-00016
Notes: The global analysis system was used to study the ocean surface temperature from 2021 and 2025. To study surface temperature for previous years (1991 to 2020), it was used the ESA CCI data. The other observation-based sea surface temperature products (OSTIA, OI SST and Odyssea) were used for calculating monthly mean and uncertainty values for the past month in 2025.
Marine Heatwaves
The results are obtained using the Copernicus Marine Service global systems including the analysis and forecasting system together with the reanalysis product.
- GLOBAL_ANALYSISFORECAST_PHY_001_024 Global Ocean Physics Analysis and Forecast sea surface temperature. E.U. Copernicus Marine Service Information (CMEMS). Marine Data Store (MDS). DOI: https://doi.org/10.48670/moi-00016
- GLOBAL_MULTIYEAR_PHY_001_030 Global Ocean Physics Reanalysis sea surface temperature. E.U. Copernicus Marine Service Information (CMEMS). Marine Data Store (MDS). DOI: https://doi.org/10.48670/moi-00021
Notes: The global analysis system was used to study MHWs for 2024 and 2025. To study MHWs for this month in previous years (1993 to 2023), it was used the reanalysis system. The reanalysis product was used for generating a daily climatology using the 30-year period from 1993 to 2022.