Ocean Temperature Bulletin
November 2025

Mercator Ocean International (MOi) oceanographers examine marine heatwaves across the global ocean. They analyse a variety of datasets from observation analyses
(satellite sea surface temperature maps) to model analyses
(assimilating satellite and in situ observations) and model forecasts.¹

All images in this article can be used freely and should be credited with the following information :
Image source: European Union, Copernicus Marine Service Data 2025 © Mercator Ocean .

Key takeaway

  • November 2025 was the 5th warmest November on record, with an average sea surface temperature (SST) of 20.48 ± 0.08°C
  • In the Mediterranean Sea, November 2025 was the 2nd warmest November of the past 33 years, with a mean SST of 21.45 ± 0.20C while in the North Atlantic, last month was the 7th warmest November with a mean SST of 22.89 ± 0.58 °C.
  • November 2025 mean sea surface temperature was above average for 62% of the global ocean (between 60°S and 60°N)
  • Almost the entire Mediterranean Sea (95%) showed above-average SST, and the month remained the third most extreme November for marine heatwave events since 1993 with rather long events.

sea Surface Temperature

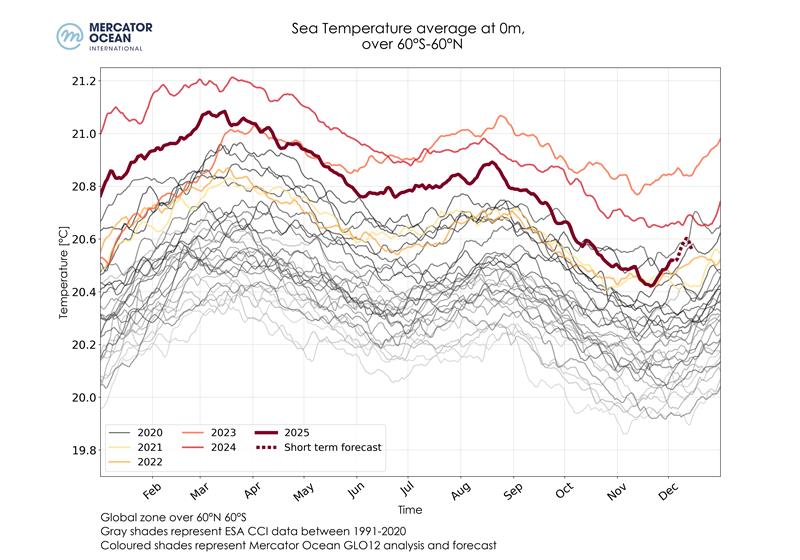
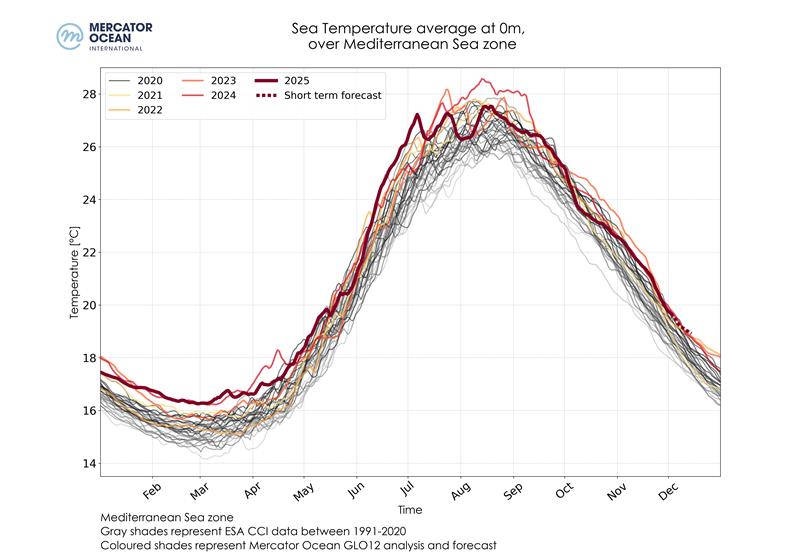
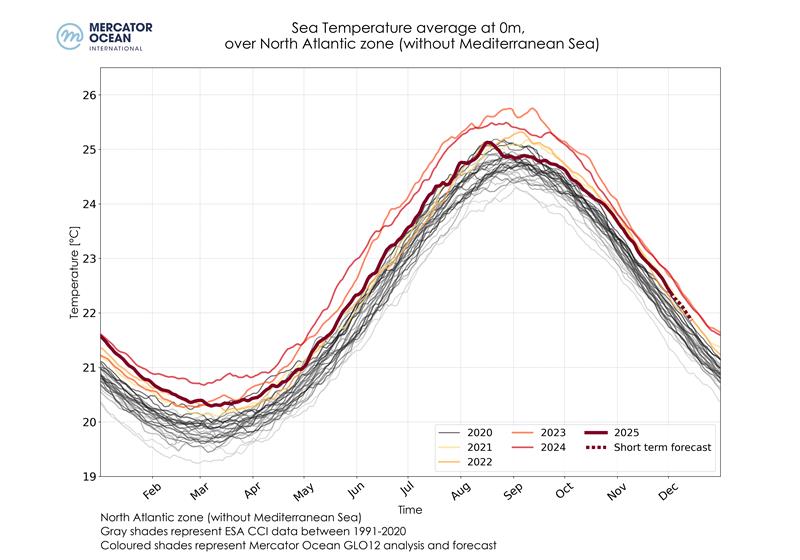
Daily sea surface temperatures averaged for the global ocean (left), the Mediterranean Sea (middle) and the North Atlantic Ocean (bottom) between 1991-2020 using ESA’s Climate Change Initiative (grey shades), and between 2021-2025 (colored shades) using Mercator Ocean International’s GLO12 analysis and forecast.


  • November 2025, at global level (between 60°S and 60°N), was the 5th warmest November on record, with a mean Sea Surface Temperature (SST) of 20.48 ± 0.08°C — the record of 20.77 ± 0.07 °C was reached in 2023.
  • Regionally, for the Mediterranean Sea, November 2025 SST was the 2nd warmest November of the past 33 years, with a mean SST of 21.45 ± 0.20C — behind only November 2023, where the mean SST reached 21.71 ± 0.18 °C.
  • For the North Atlantic, November 2025 was the 7th warmest November month with a mean SST of 22.89 ± 0.58 °C.

Sea surface teperature anomalies


November 2025 mean SST anomalies relative to a 30-year climatology (1993-2022). Data sources: daily sea surface temperature using Mercator Ocean International’s GLO12 analysis and forecasting system for 2025; GLORYS12 reanalysis to calculate a climatological mean.
  • Seasurface temperature (SST) mean for November 2025 were above average for 62% of the global ocean (between 60°S and 60°N), with 10% exceeding the average by at least 1°C.
  • Almost the entire Mediterranean Sea (95%) showed above-average SSTs, with a third of the basin reaching at least 1°C above average.
  • The North Pacific Ocean showed widespread high SSTs at midlatitude spanning the entire width of the basin and reaching 3°C above average in the western part. Above-average SSTs are also observed in the western South Pacific, extending from the Australian coast to the east of New Zealand, reaching 2°C to 3°C above average. The equatorial region is characterized by a large below-average SST (down to -2°C) continuing the transition from ENSO neutral to La Niña conditions observed in previous months.
  • The North Atlantic showed above average SSTs for 78% of the area (between 0°N and 60°N) mostly mild except in the western region around Newfoundland and in north-western Europe.
  • The Arctic region shows large above-average temperature (reaching more than 2°C above average).
  • In the Indian Ocean, SSTs were predominantly above average in the eastern part and below average in the western part.

Ongoing Marine Heatwaves

Month of onset for ongoing MHWs as of 30 November 2025. Colours indicate the month during which the MHW started. For instance, ocean pixels in red correspond to an MHW that developed during November 2025 and are less than one month old. In orange MHWs are between 1 and 2 months old, etc.
  • On the 30th of November, 17% of the global ocean (between 60°S and 60°N) was affected by MHWs.
  • The majority of these MHWs developed recently, with 13% of the global Ocean (between 60°S and 60°N) affected by MHWs less than 1 month old and more than 3% by events between 1- and 2-month-old.
  • The longest-lasting MHWs are in the mid-latitudes of the North Pacific and in the Southern Ocean between 60°E and 90°E.

Total Surface Marine Heatwaves

Total surface of the ocean exposed to marine heatwave conditions

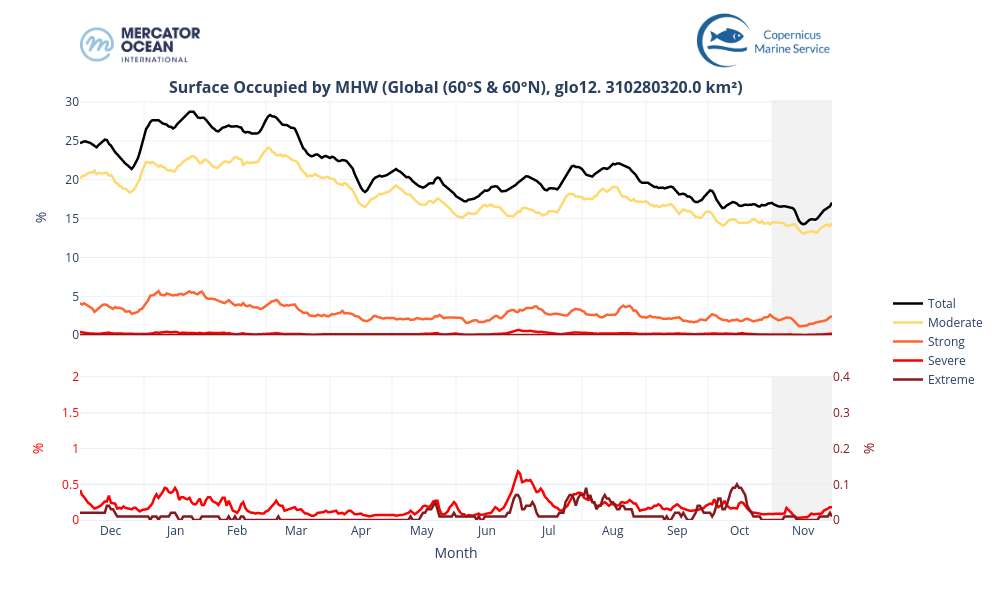
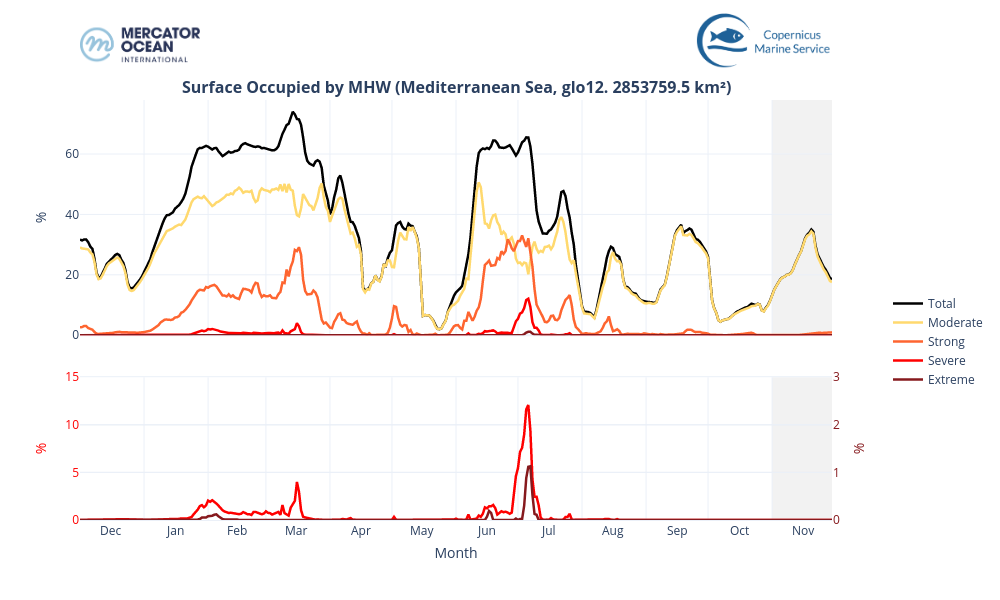
Surface occupied by MHWs in the global ocean (between 60°S and 60°N) (left), MHWs in the Mediterranean Sea (centre) and in the North Atlantic (between 0°N and 60°N)(right) between December 2024 and November 2025 based on daily monitoring. The black solid line represents the total surface of MHW, while the colored lines represent the surface of each MHW category. The gray background highlights the month of November 2025.

  • In November 2025, the total surface area of MHW (black line) remained stable around 17% of the global ocean (between 60°S and 60°N), despite a small decrease to 14% mid-month. The majority of MHWs events were of moderate category (~14% of the global ocean) and to a lesser extent strong categories (~2% of the global ocean).
  • the total MHW surface increased from 15% to 19% between the beginning and the end of November 2025, with a peak of 35% in the second half of the month. These MHW events consisted of moderate categories only.
  • For the North Atlantic (between 0°N and 60°N), the total MHW surface slightly increased from 21% to 23% of the basin. These events consist mostly of moderate and strong categories (19-21% and 2%, respectively). For comparison, in November 2024, the total MHW extent rapidly increased from under 30% to above 40% of the North Atlantic, with the noteworthy presence of strong (5-7%) and severe (almost 2%) categories (not shown).

Total Number Marine Heatwaves

Total number of intense MHW days for November 2025

  • 9% of the surface of the ocean was impacted by strong-or-higher MHW conditions for at least 1 day during November 2025. This is the 7th widest extent of the last 33 years. The South Pacific between New Caledonia and New Zeeland and the North Pacific at mid-latitude around 180°W are the most affected (Figure 7).
  • Regionally, 9% of the North Atlantic (between 0°N and 60°N) was impacted by strong, or higher, MHW conditions for at least 1 day. This corresponds to the 3rd largest extent for a November month – behind 2024 (23%) and 2023 (37%). Noteworthy, 3% of the region was affected by intense MHW condition (Strong or higher) for more than 10 days.
  • For the Mediterranean Sea, the surface affected by strong or higher MHW ranks within the third largest extent in the past 33 years.
November 2025 MHW days of strong and higher category. Number of days during which a MHW of category strong, severe or extreme occurred in November 2025. Blank areas mean that no MHW of strong or higher category happened during the month. Blue shaded areas in the polar regions represent the sea ice maximum from the climatological period (1993-2022). Monitoring SST extremes with the MHW categorization approach as used here is not best suited for such regions.


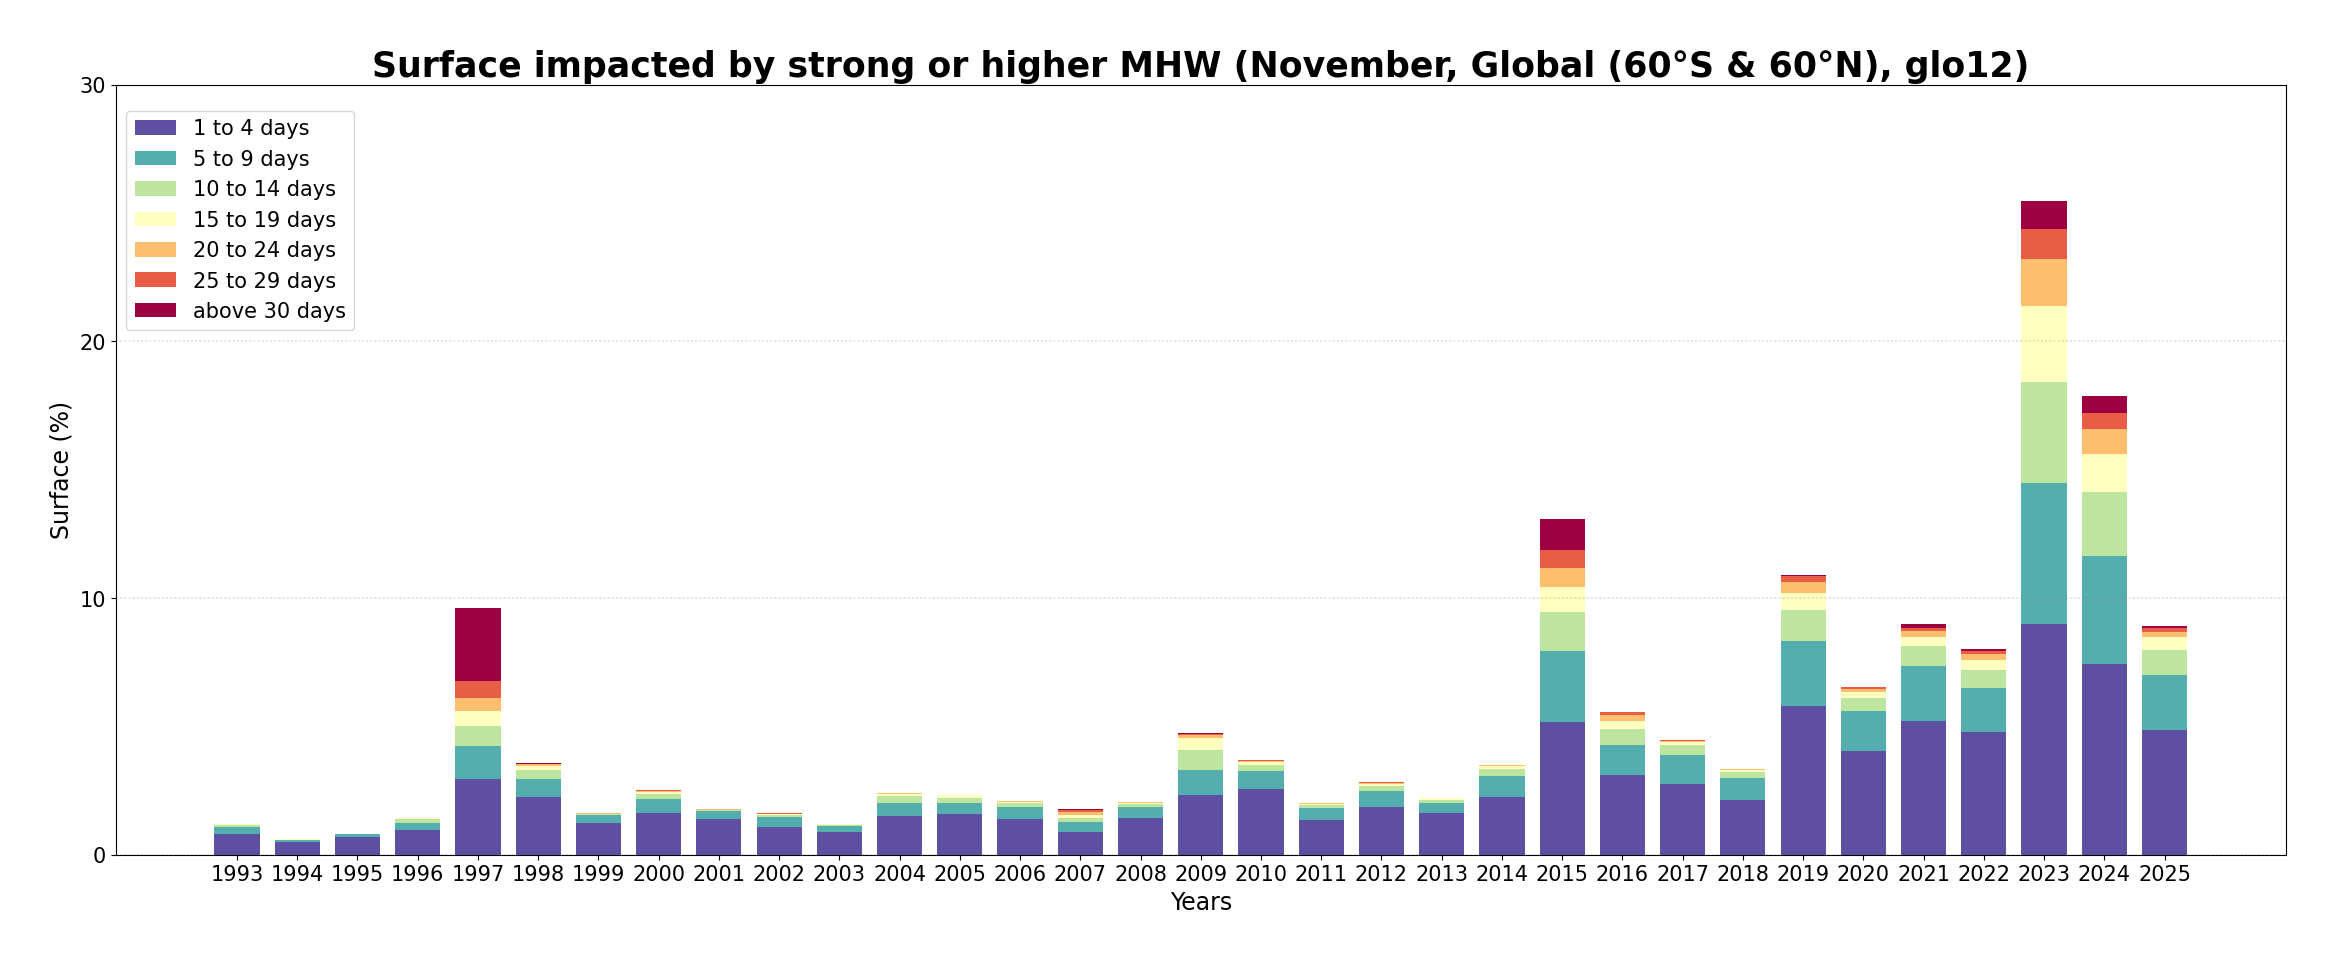
Year by year evolution of the surface impacted by strong and higher MHW during months of November. The size of the bar represents the proportion of the global ocean (60°S to 60°N) exposed to a strong or higher MHW during the month. As indicated by the colours, the proportion exposed to such MHWs is categorized according to the number of days impacted during the month. 

Statistics

Marine heatwave statistics for November 2025

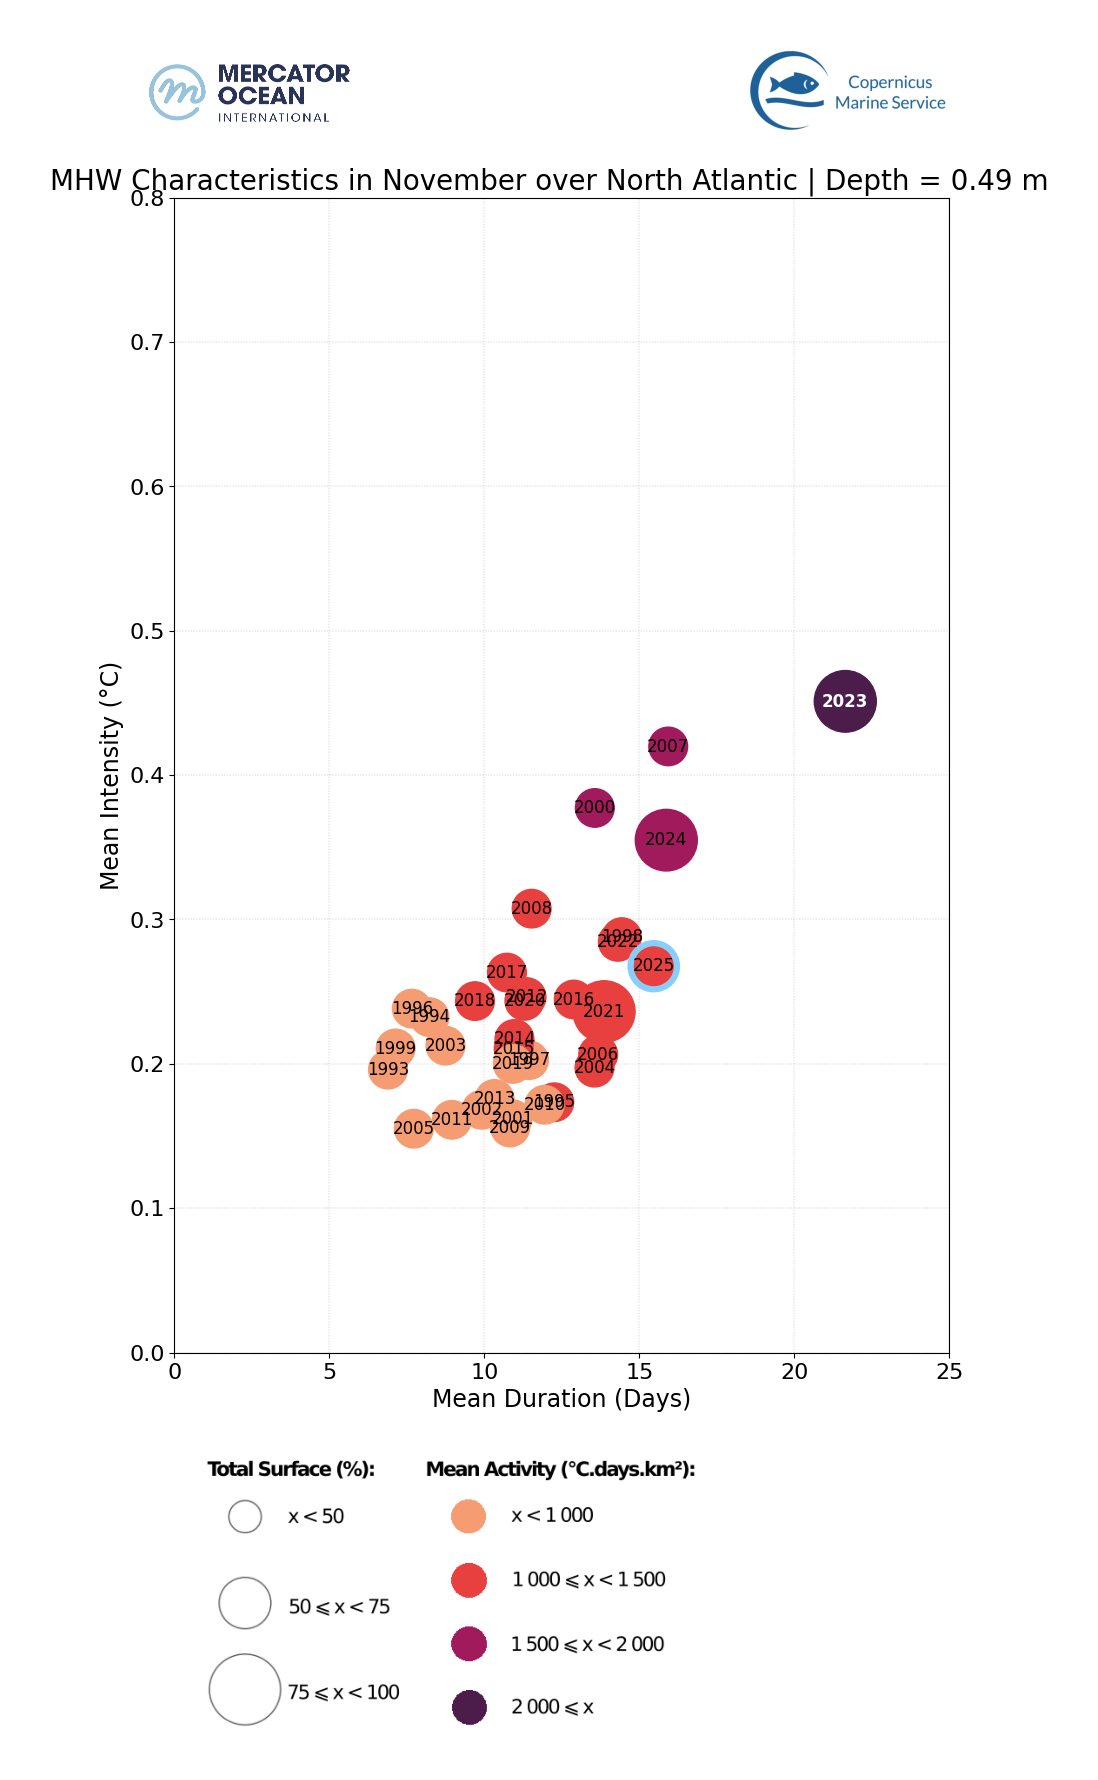
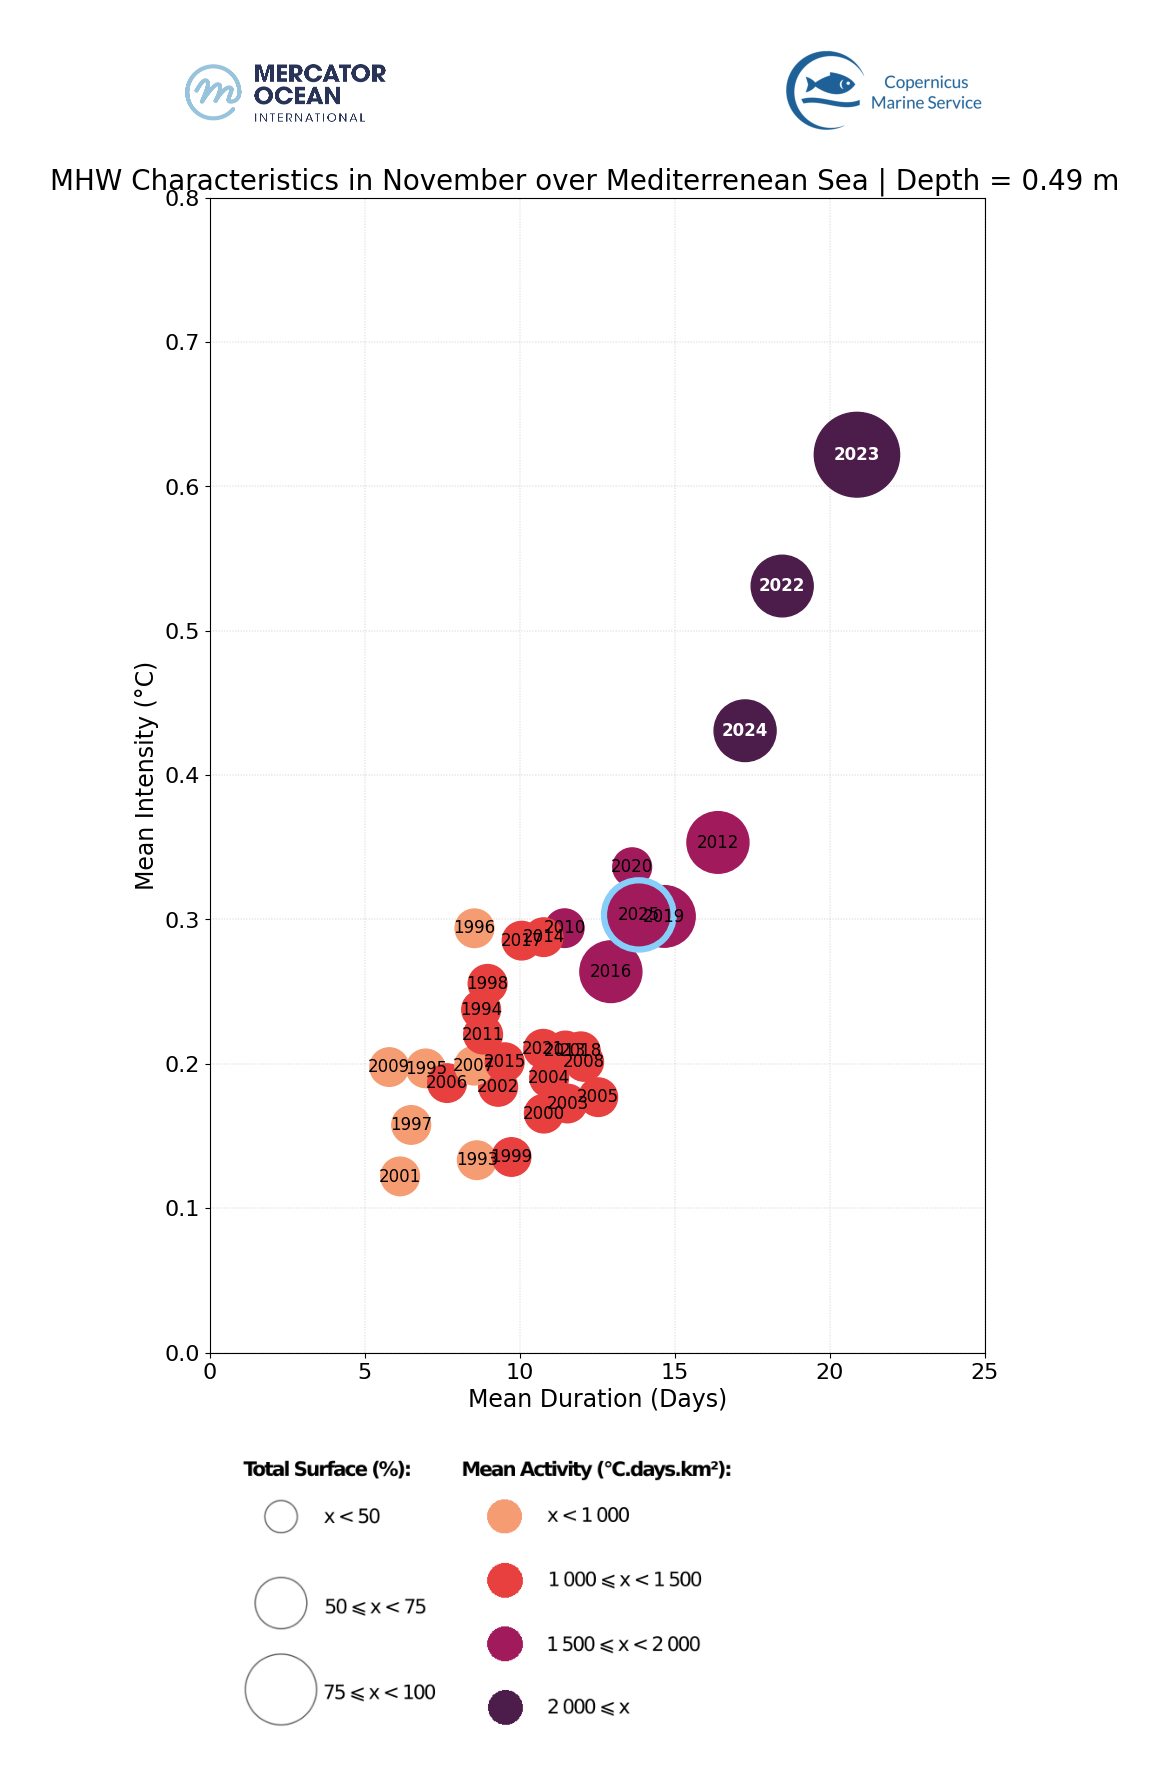
MHW characteristics for November months from 1993 to 2025. Duration, intensity, extent and activity averaged for each November month between 1993 and 2025 for the global ocean (left), for the Mediterranean Sea (center) and the North Atlantic Ocean (right). November 2025 is highlighted with a blue edge.

  • November 2025 was the 5th most extreme November month in terms of MHW after 2024, 2015, 2023, 1997. Nonetheless, events remained regional.
  • In the Mediterranean Sea, November 2025 was affected by rather long MHWs on average but not as extreme and widespread as November 2023. Last month stands in the third most extreme November since 1993.
  • In the North Atlantic, November 2025 was within the third most extreme November for MHWs over the past 33 years, with events that were relatively long-lasting but generally less intense and widespread than those observed in recent Novembers.

About the Bulletin

Mercator Ocean International publishes a monthly sea surface temperature bulletin reporting on mean temperature and marine heatwave conditions for the month just passed. It includes:

  • Regions where MHWs are present and the time these events started,
  • Timeseries showing the total surface occupied by MHWs globally and for the European region,
  • The total number of days of exposure to MHW during the month (including only strong and higher intensity categories).

Data sets and products

Sea Surface Temperature

The results are obtained using the Copernicus Marine Service global analysis and forecasting system together with observation-based products.

  • GLOBAL_ANALYSISFORECAST_PHY_001_024 Global Ocean Physics Analysis and Forecast sea surface temperature. U. Copernicus Marine Service Information (CMEMS). Marine Data Store (MDS). DOI: https://doi.org/10.48670/moi-00016
  • ESA SST CCI reprocessed sea surface temperature analyses. E.U. Copernicus Marine Service Information (CMEMS). Marine Data Store (MDS). DOI: https://doi.org/10.48670/moi-00169
  • NOAA OI SST V2 High Resolution Dataset data provided by the NOAA PSL, Boulder, Colorado, USA, from their website at https://psl.noaa.gov, Huang, B., C. Liu, V. Banzon, E. Freeman, G. Graham, B. Hankins, T. Smith, and H.-M. Zhang, 2021: Improvements of the Daily Optimum Interpolation Sea Surface Temperature (DOISST) Version 2.1, Journal of Climate, 34, 2923-2939. doi: 10.1175/JCLI-D-20-0166.1
  • Global Ocean OSTIA Sea Surface Temperature and Sea Ice Analysis. E.U. Copernicus Marine Service Information (CMEMS). Marine Data Store (MDS). DOI: https://doi.org/10.48670/moi-00165
  • ODYSSEA Global Sea Surface Temperature Gridded Level 4 Daily Multi-Sensor Observations. E.U. Copernicus Marine Service Information (CMEMS). Marine Data Store (MDS). DOI: https://doi.org/10.48670/moi-00016

Notes: The global analysis system was used to study the ocean surface temperature from 2021 and 2025. To study surface temperature for previous years (1991 to 2020), it was used the ESA CCI data. The other observation-based sea surface temperature products (OSTIA, OI SST and Odyssea) were used for calculating monthly mean and uncertainty values for November 2025.

 Marine Heatwaves

The results are obtained using the Copernicus Marine Service global systems including the analysis and forecasting system together with the reanalysis product.

  • GLOBAL_ANALYSISFORECAST_PHY_001_024 Global Ocean Physics Analysis and Forecast sea surface temperature. U. Copernicus Marine Service Information (CMEMS). Marine Data Store (MDS). DOI: https://doi.org/10.48670/moi-00016
  • GLOBAL_MULTIYEAR_PHY_001_030 Global Ocean Physics Reanalysis sea surface temperature. U. Copernicus Marine Service Information (CMEMS). Marine Data Store (MDS). DOI: https://doi.org/10.48670/moi-00021

Notes: The global analysis system was used to study MHWs for 2024 and 2025. To study MHWs for previous March (1993 to 2023), it was used the reanalysis system. The reanalysis product was used for generating a daily climatology using the 30-year period from 1993 to 2022