Ocean Temperature Bulletin Global Ocean Highlights 2025
Mercator Ocean International (MOi) oceanographers examine marine heatwaves across the global ocean. They analyse a variety of datasets from observation analyses (satellite sea surface temperature maps) to model analyses (assimilating satellite and in situ observations) and model forecasts.¹
Mercator Ocean International (MOi) publishes an annual surface temperature bulletin reporting on mean surface temperature and Marine HeatWave (MHW) conditions for the year 2025. This bulletin focuses on the global ocean (between 60°S and 60°N) and 2 regions: the Mediterranean Sea and the North Atlantic (between 0°N and 60°N).
Key takeaways for 2025 :
The year 2025 was the 3rd warmest year since 1993, despite neutral ENSO to La Niña conditions (not an El Niño year) which are typically not associated with record-high Sea Surface Temperatures (SSTs).
The mean SST over the global ocean (between 60°S and 60°N) reached 20.80 ± 0.12°C, behind 2023 (20.85 ± 0.07°C) and the 2024 record of 20.92 ± 0.05 °C.
81% of the global ocean (between 60°S and 60°N) experienced above average sea surface temperatures.
The most affected regions included the north-west European coast, the mid-latitude North Pacific, and parts of the Southern Ocean.
89% of the global ocean (between 60°S and 60°N) was impacted by at least one marine heatwave event, making it the sixth-largest extent since 1993.
More than half of the global ocean (55%) experienced intense marine heatwaves, classified as strong, severe or extreme.
sea Surface Temperature
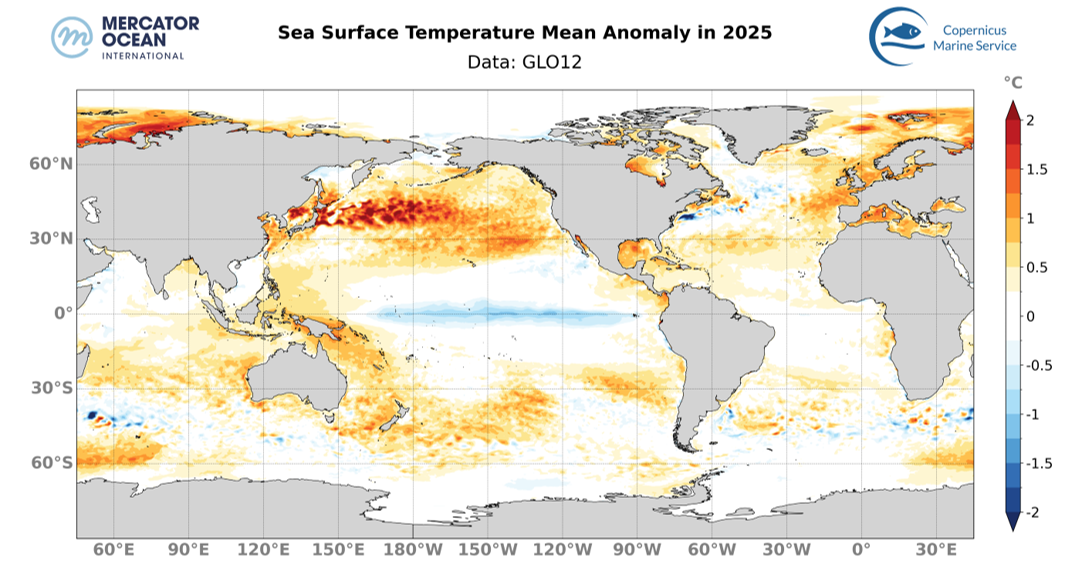
2025 Mean SST Anomaly relative to a 30-year climatology (1993-2022), calculated using daily data from Mercator Ocean International’s GLO12 analysis for 2025 and from GLORYS12 reanalysis for the climatological mean.
2025 was the 3rd warmest year since 1993, despite neutral ENSO to LaNiña conditions (not an El Niño year) which are typically not associated with record-high Sea Surface Temperatures (SSTs).
The mean SST over the global ocean (between 60°S and 60°N) reached 20.80 ± 0.12°C, behind 2023 (20.85 ± 0.07°C) and the 2024 record of 20.92 ± 0.05 °C.
2025 mean SSTs were above average for 81%of the global ocean (between 60°S and 60°N)
Almost the entire Mediterranean Sea (98%) showed above-average SSTs, with a fourth of the basin reaching at least 1°C above average.
SSTs in the North Atlantic are predominantly above average with highest values reached toward the European coasts (between 1°C and 1.5°C above average).
TheNorth Pacific Ocean showedwidespread high SSTsat midlatitudespanning the entire width of the basinandreaching 2°C above averagein the western part. Above-average SSTs are also observed in the western South Pacific, extending from the Australian coast to Chilean ones (~1°C).The equatorial regionis characterized by a large below-average SST(down to -1°C).
Closer-to-average SSTs are observed in the Indian Ocean, with the strongest values – spanning from Madagascar to the Australian coast – remaining below 1 °C above average.
In the Southern Ocean, a large area of above average SST is observed between 30°E and 90°E.
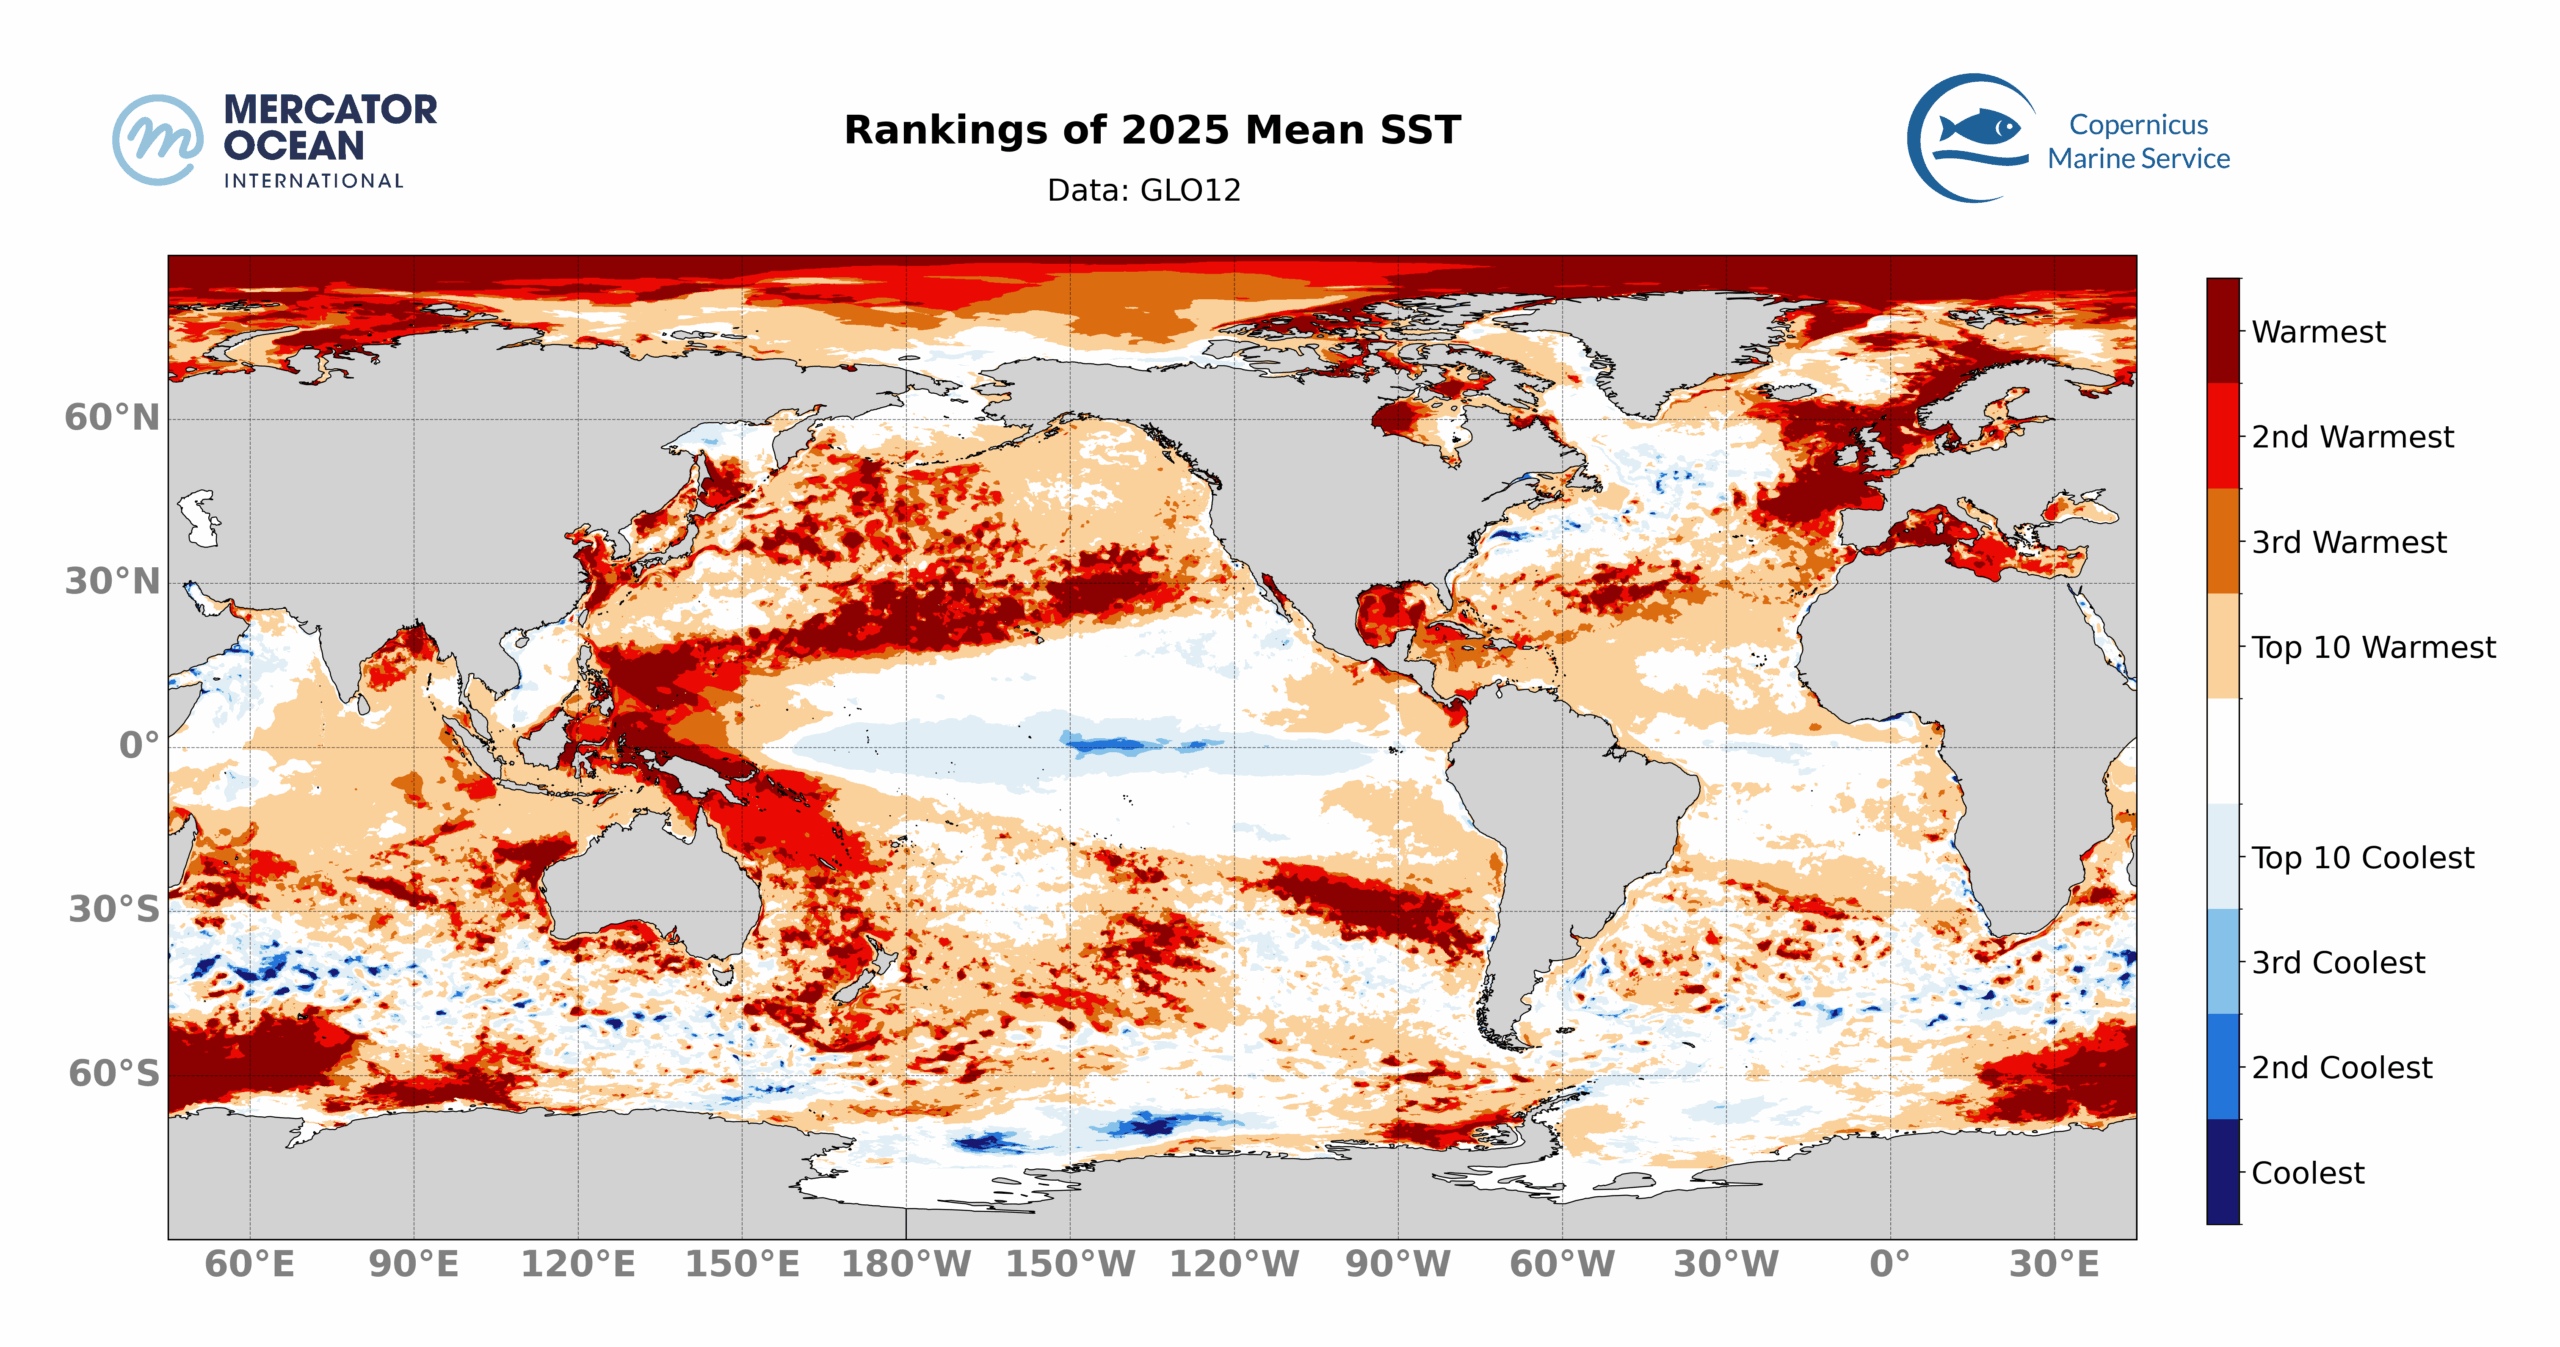
Ranking 2025 mean sea surface temperature
Rankings of 2025 mean SST since 1993 using daily data from Mercator Ocean International’s GLO12 analysis from 2021 to 2025 and from GLORYS12 reanalysis from 1993 to 2020. Blank areas mean that 2025 mean SST doesn’t rank in the 10 warmest or 10 coolest mean SST since 1993.
2025 was the warmest year since 1993 for 8% of the global ocean (between 60°S and 60°N) with the northwest European region, the north Pacific at mid-latitude and the Southern Ocean (between 15°E and 90°E) most affected (figure 3).
More generally, 2025 was amongst the warmest 4 years for 30% of the global ocean (between 60°S and 60°N).
In contrast, less than 1.5% of the global ocean ranked among the 4 coldest years, mostly in the Equatorial Pacific and the South of the Indian Ocean.
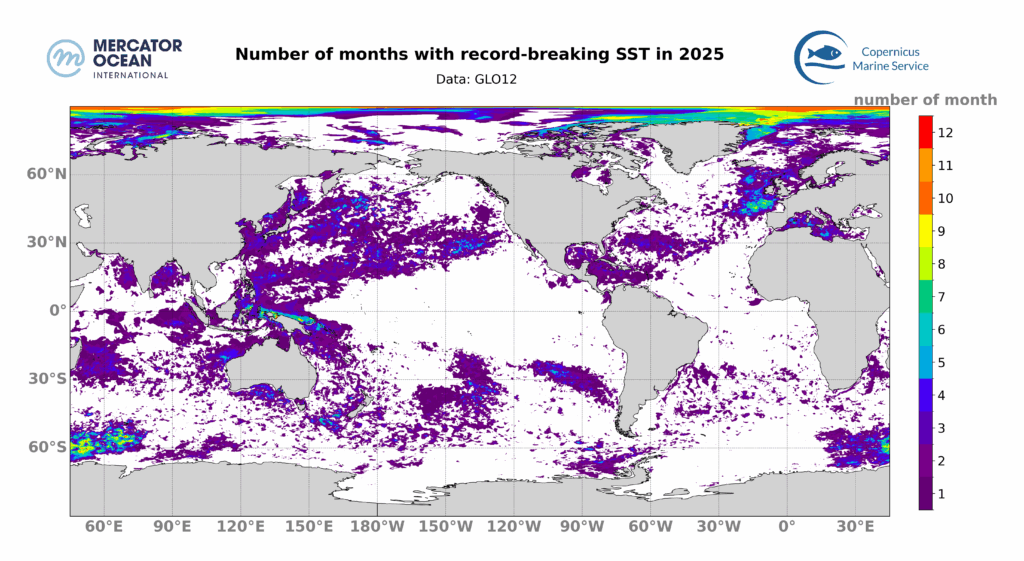
Months of record sea surface temperature
Number of months with record-breaking mean SST between January and December 2025. Blank areas mean that no month ranked as the warmest since 1993.
37% of the global ocean (between 60°S and 60°N) experienced at least one month with a record-breaking mean SST.
Ongoing Marine Heatwaves
Marine heatwaves (MHWs) are abnormally warm events for which extreme temperatures are observed for at least 5 consecutive days; their occurrence and severity is monitored as MHWs – when prolonged or intense – can have negative impact on the environment and ecosystems. MHW can be classified based on their intensity into 4 categories (moderate, strong, severe, or extreme). We monitor daily the surface occupied by MHWs and show for the entire year the proportion of the global Ocean (between 60°S and 60°N) exposed to MHWs (Figure 5).
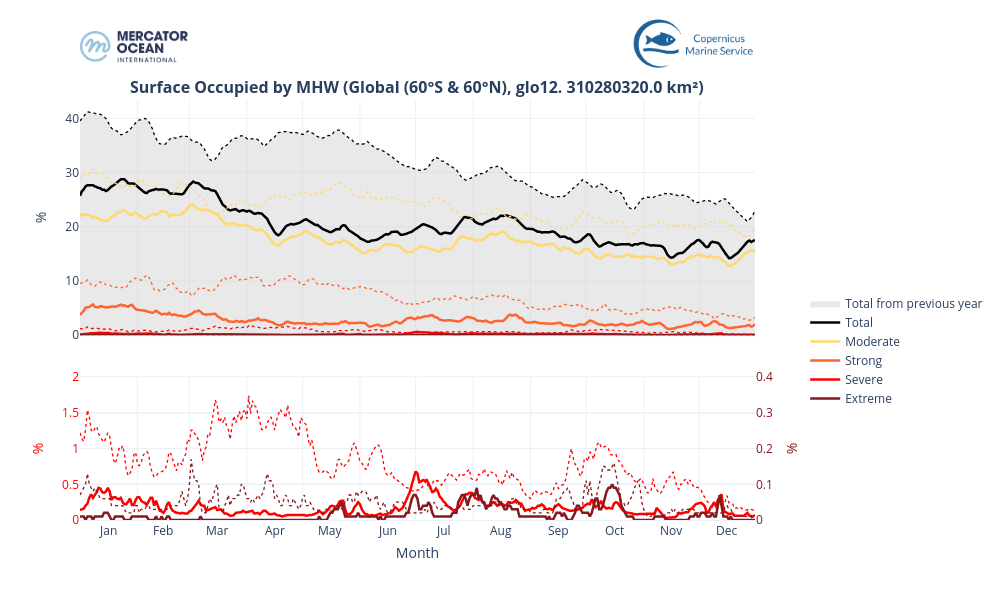
Total Surface Marine Heatwaves
Surface occupied by MHWs in the global ocean (between 60°S and 60°N) in 2025 based on daily monitoring. The black solid line represents the total surface of MHW, while the colored lines represent the surface of each MHW category for the year 2025. The dashed lines show the MHW surface for 2024 (total surface in black and categories in color). The gray shaded area refers to the total MHW surface from 2024.
The total surface of MHWs for 2025 (solid black line) decreased throughout the year (from ~26% to ~17%). These MHWs consist mostly of moderate and strong categories (yellow and orange lines). Compared to the same day in 2024 (dashed lines), the daily MHW extent in 2025 is lower, both for the total affected area and for each category.
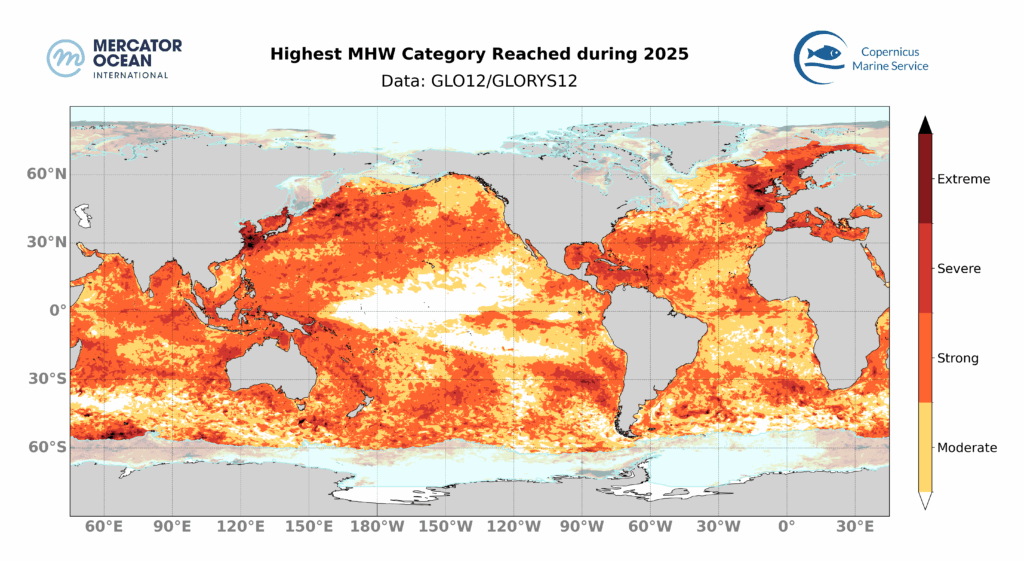
Highest marine heatwaves categories reached in 2025
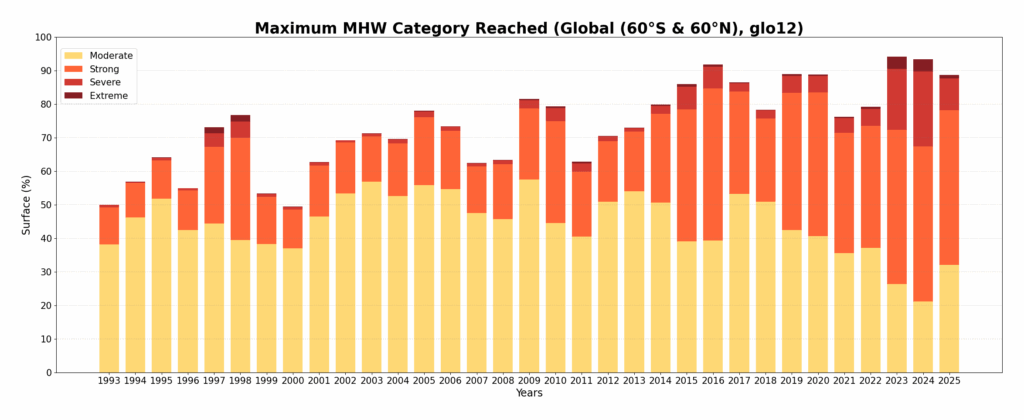
Highest MHW Category reached in 2025. Blank areas mean that no MHW occurred in these regions in 2025. Blue shaded areas in the polar regions represent the sea ice maximum from the climatological period (1993-2022). Monitoring SST extremes with the MHW categorization approach as used here is not best suited for such regions. Evolution of the extent of the highest MHW category. For each year, the length of the bar represents the percentage of the region impacted by MHW, while the colors indicate the proportion of the highest categories reached within that region. The region displayed is the global ocean (60°S to 60°N).
89% of the global ocean was affected by MHW in 2025. It is the 6th largest extent impacted by MHW since 1993, not surpassing 2023 record of 94%.
Focusing on strong or higher category MHW events, more than half (55%) of the global ocean (between 60°S and 60°N) was affected by such MHWs, the 3rd widest extent after 2023 (68%) and 2024 (72%).
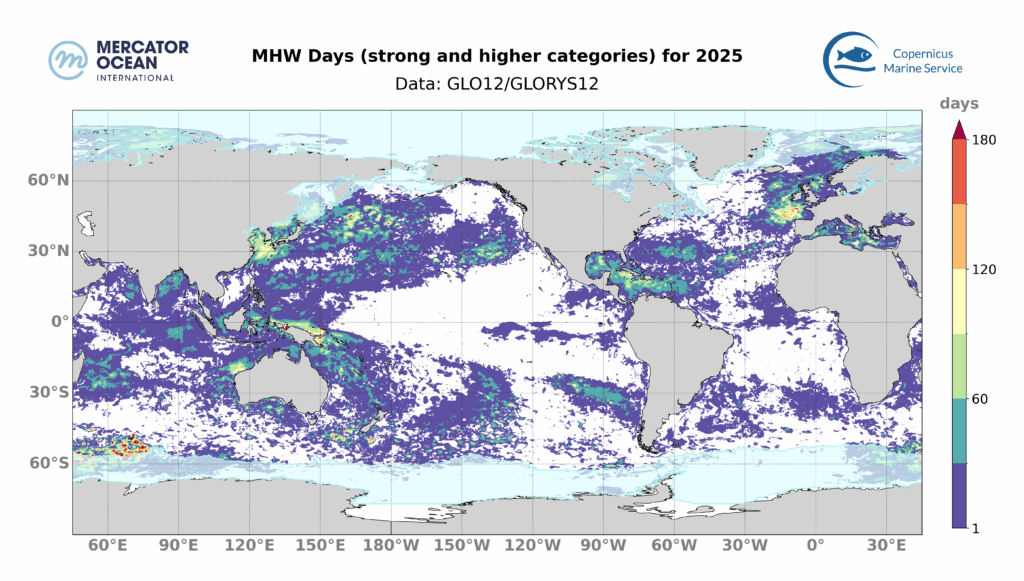
Total Number Marine Heatwaves
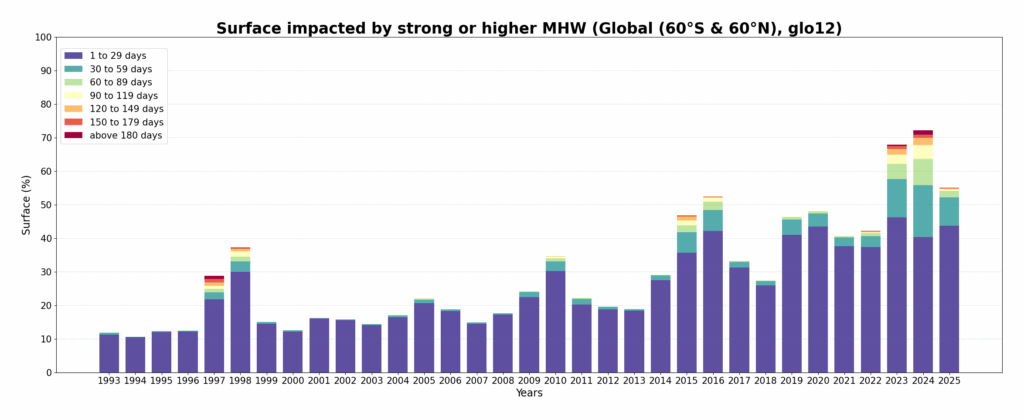
2025 MHW days of strong and higher category. Number of days during which a MHW of category strong, severe or extreme occurred in 2025. Blank areas mean that no MHW of strong or higher category happened in 2025. Blue shaded areas in the polar regions represent the sea ice maximum from the climatological period (1993-2022). Monitoring SST extremes with the MHW categorization approach as used here is not best suited for such regions.Year by year evolution of the surface impacted by strong and higher MHW. The size of the bar represents the proportion of the global ocean (60°S to 60°N) exposed to a strong or higher MHW during the year. The colours indicate the number of days impacted by such MHW.
In 2025, 11% of the global ocean (between 60°S and 60°N) was exposed to intense MHW conditions (i.e. strong or higher categories) for more than 30 days (not necessarily consecutive days).
Statistics
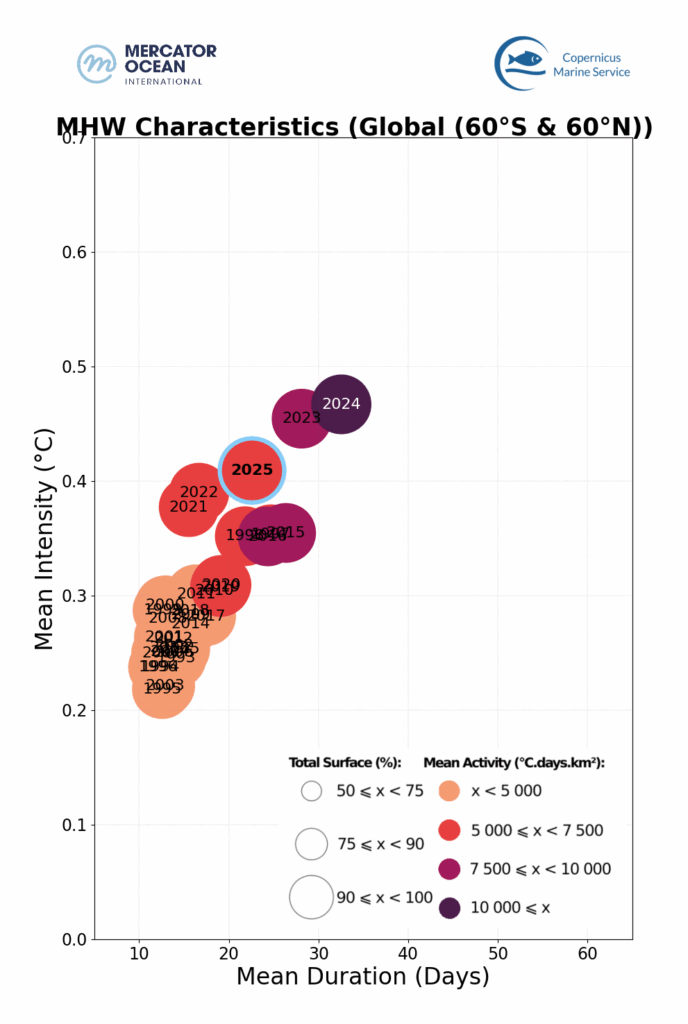
2025 Marine heatwave statistics (duration, intensity, extent and activity)
Annual MHW Characteristics from 1993 to 2025. Duration, intensity, extent, and activity averaged for each year between 1993 and 2025 for the global ocean. 2025 is highlighted with a blue edge.
At global level, 2025 had the 3rd most extreme semester in terms of MHW intensity.
About the Bulletin
Datasets
Sea Surface Temperature
The results are obtained using the Copernicus Marine Service global analysis and forecasting system together with observation-based products.
GLOBAL_ANALYSISFORECAST_PHY_001_024 Global Ocean Physics Analysis and Forecast sea surface temperature. U. Copernicus Marine Service Information (CMEMS). Marine Data Store (MDS). DOI: https://doi.org/10.48670/moi-00016
ESA SST CCI reprocessed sea surface temperature analyses. E.U. Copernicus Marine Service Information (CMEMS). Marine Data Store (MDS). DOI: https://doi.org/10.48670/moi-00169
NOAA OI SST V2 High Resolution Dataset data provided by the NOAA PSL, Boulder, Colorado, USA, from their website at https://psl.noaa.gov, Huang, B., C. Liu, V. Banzon, E. Freeman, G. Graham, B. Hankins, T. Smith, and H.-M. Zhang, 2021: Improvements of the Daily Optimum Interpolation Sea Surface Temperature (DOISST) Version 2.1, Journal of Climate, 34, 2923-2939. doi: 10.1175/JCLI-D-20-0166.1
Global Ocean OSTIA Sea Surface Temperature and Sea Ice Analysis. E.U. Copernicus Marine Service Information (CMEMS). Marine Data Store (MDS). DOI: https://doi.org/10.48670/moi-00165
ODYSSEA Global Sea Surface Temperature Gridded Level 4 Daily Multi-Sensor Observations. E.U. Copernicus Marine Service Information (CMEMS). Marine Data Store (MDS). DOI: https://doi.org/10.48670/moi-00016
Notes: The global analysis system was used to study the ocean surface temperature from 2021 and 2025. To study surface temperature for previous years (1991 to 2020), it was used the ESA CCI data. The other observation-based sea surface temperature products (OSTIA, OI SST and Odyssea) were used for calculating monthly mean and uncertainty values for March 2025.
Marine Heatwaves
The results are obtained using the Copernicus Marine Service global systems including the analysis and forecasting system together with the reanalysis product.
GLOBAL_ANALYSISFORECAST_PHY_001_024 Global Ocean Physics Analysis and Forecast sea surface temperature. U. Copernicus Marine Service Information (CMEMS). Marine Data Store (MDS). DOI: https://doi.org/10.48670/moi-00016
GLOBAL_MULTIYEAR_PHY_001_030 Global Ocean Physics Reanalysis sea surface temperature. E.U. Copernicus Marine Service Information (CMEMS). Marine Data Store (MDS). DOI: https://doi.org/10.48670/moi-00021
Notes: The global analysis system was used to study MHWs for 2024 and 2025. To study MHWs for previous March (1993 to 2023), it was used the reanalysis system. The reanalysis product was used for generating a daily climatology using the 30-year period from 1993 to 2022.