Sea Ice Bulletin
2025

Key Takeaways

Iceberg pictogram

Arctic

  • Arctic sea ice maximum extent in March 2025 was the 2nd lowest winter extent.
  • Minimum sea ice was reached in September, ranking the 7th lowest summer sea ice extent.
  • In November 2025, high sea surface temperatures in the Arctic region, exceeded the to 2°C above average (mainly in the Barents and Kara Seas), causing winter sea ice to drop to a record low in December 2025. 
Iceberg pictogram

Antarctic

  • In 2025, Antarctic sea ice formation was delayed over unusually large areas, particularly in the Indian Ocean sector.
  • September 2025, ranked the 3rd lowest winter sea ice, with major deficits in sea ice are visible in the Indian Ocean and Bellingshausen Sea sectors.  
  • Sea ice extent remained well below average for most of the winter – from June to October – and 2025 followed 2023 and 2024’s patterns very closely. 

Arctic 

Daily Arctic sea ice extent between 1993-2025. Data : GLO12 Credits: European Union, Copernicus Marine Service/Mercator Ocean International. 
Arctic Sea ice extent daily anomaly between 1993-2025 (using 1993-2010 climatology).


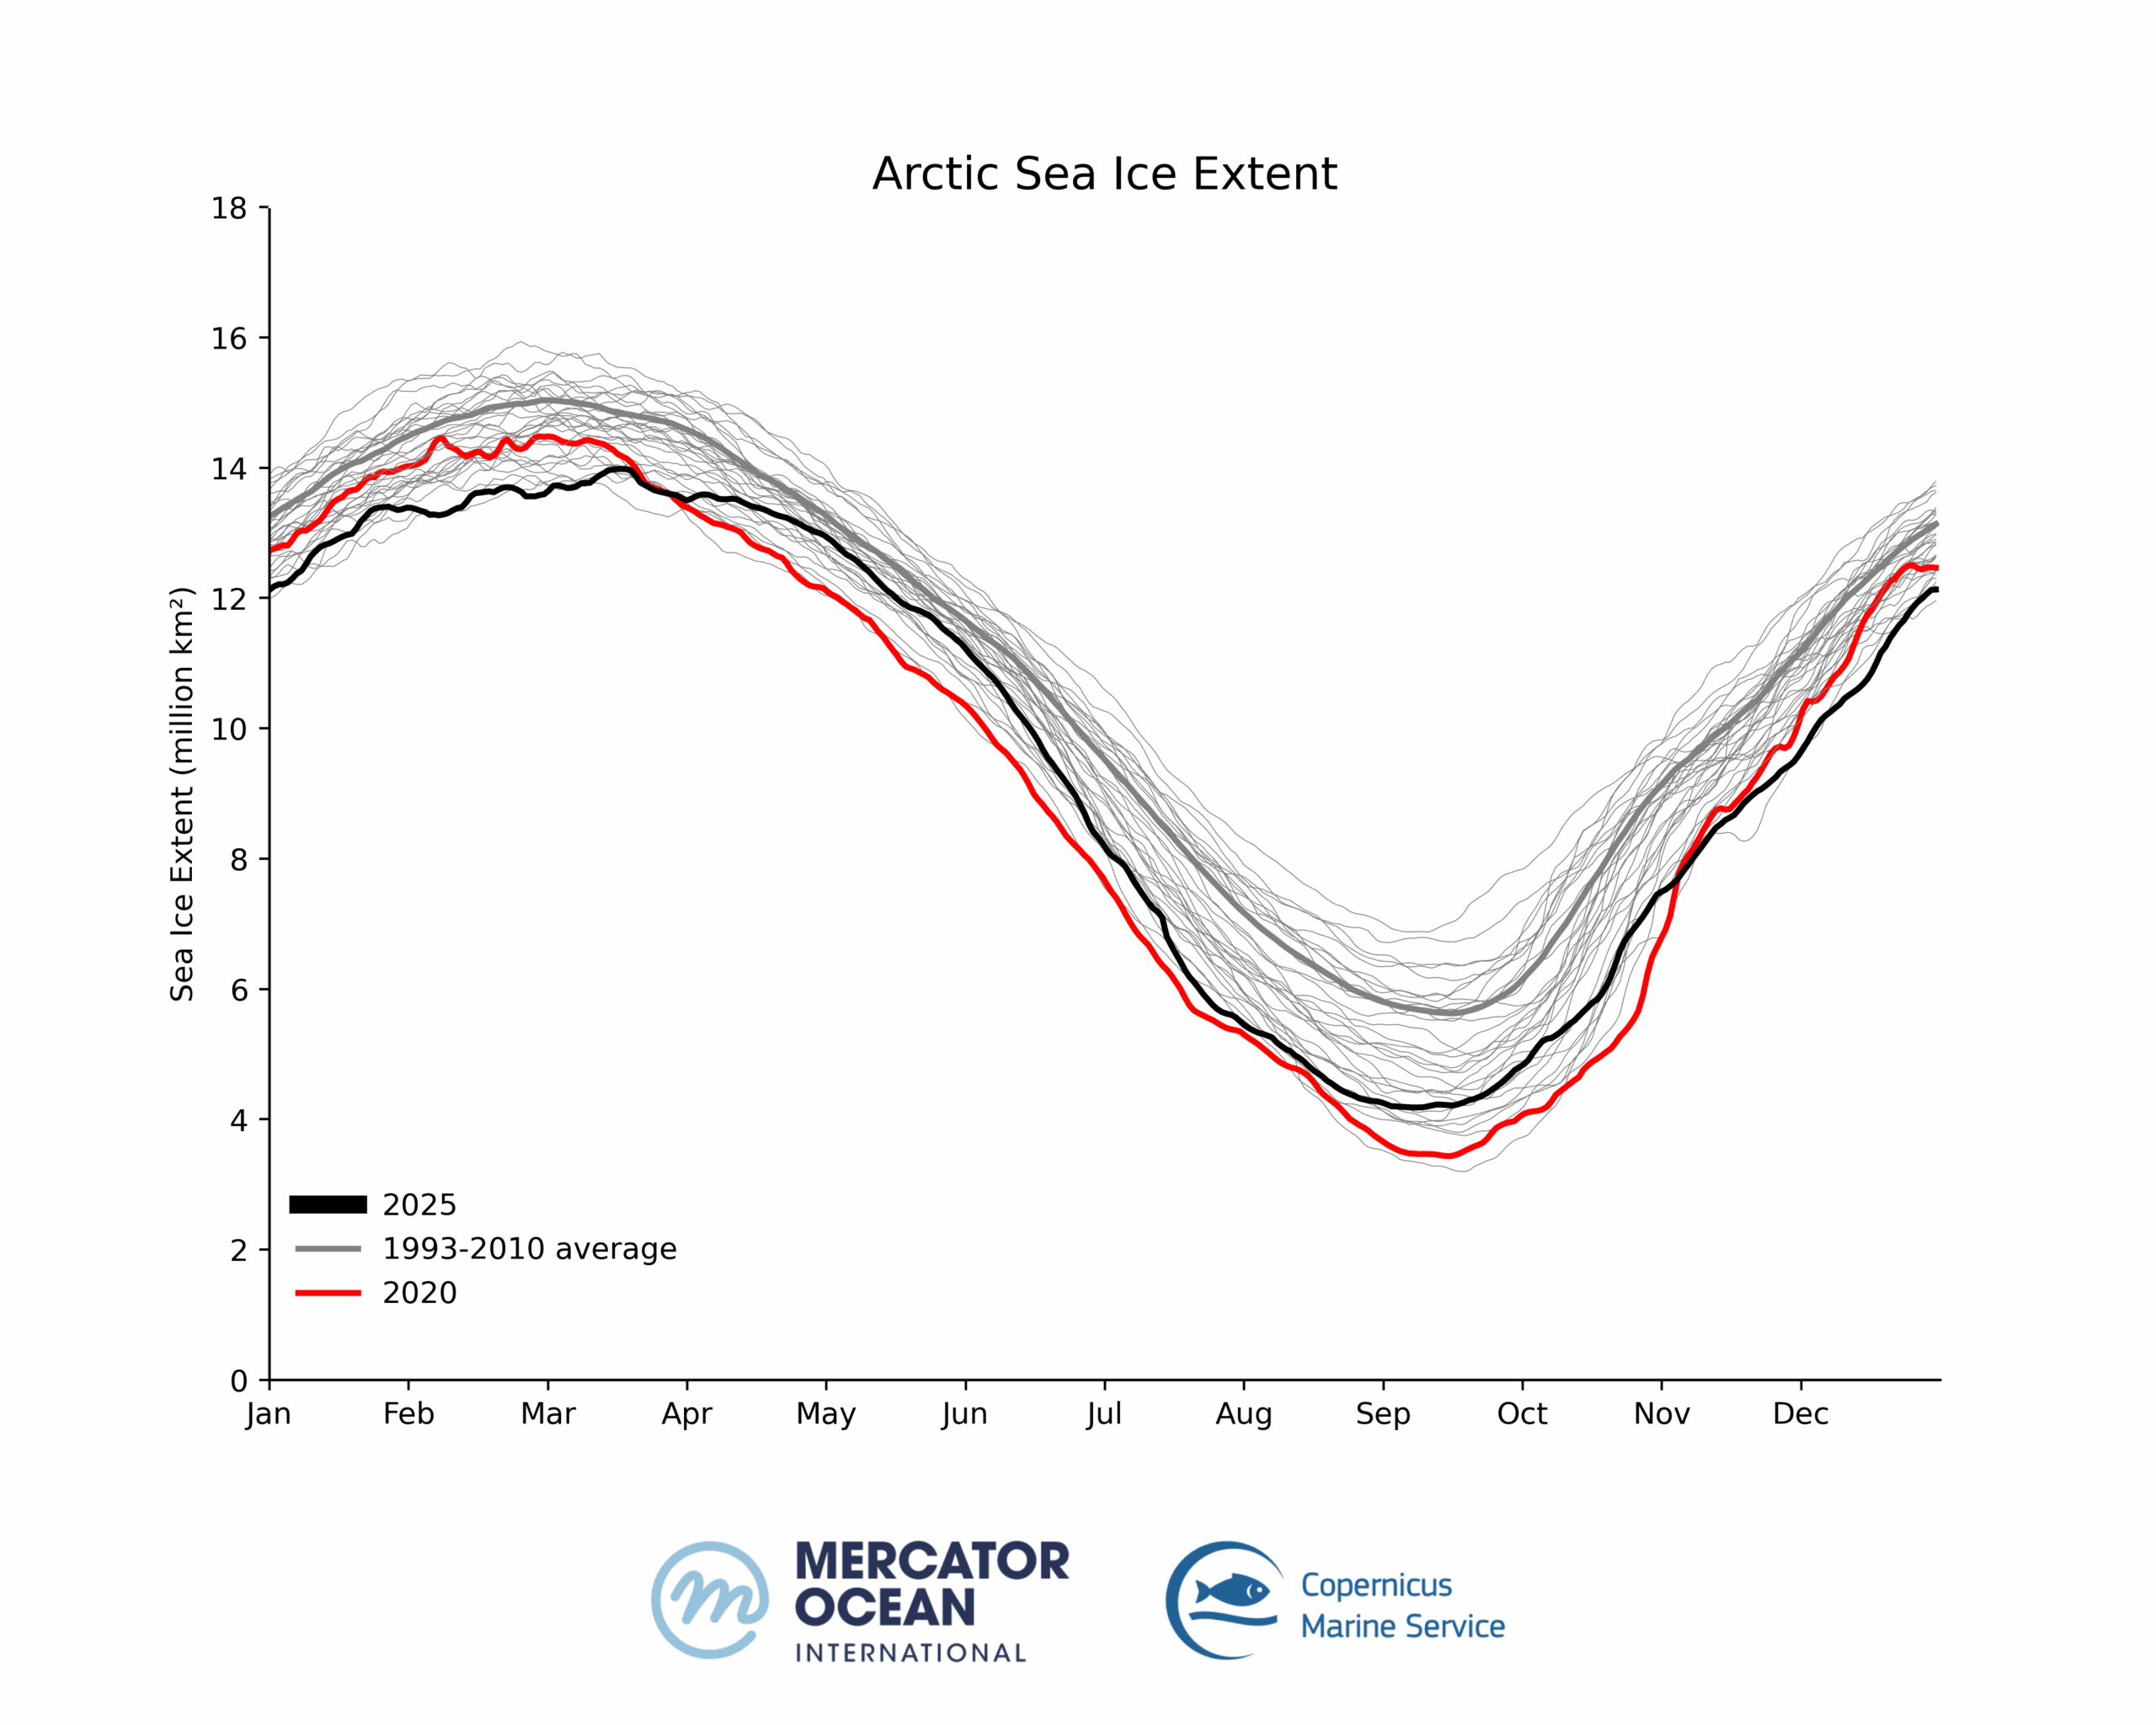
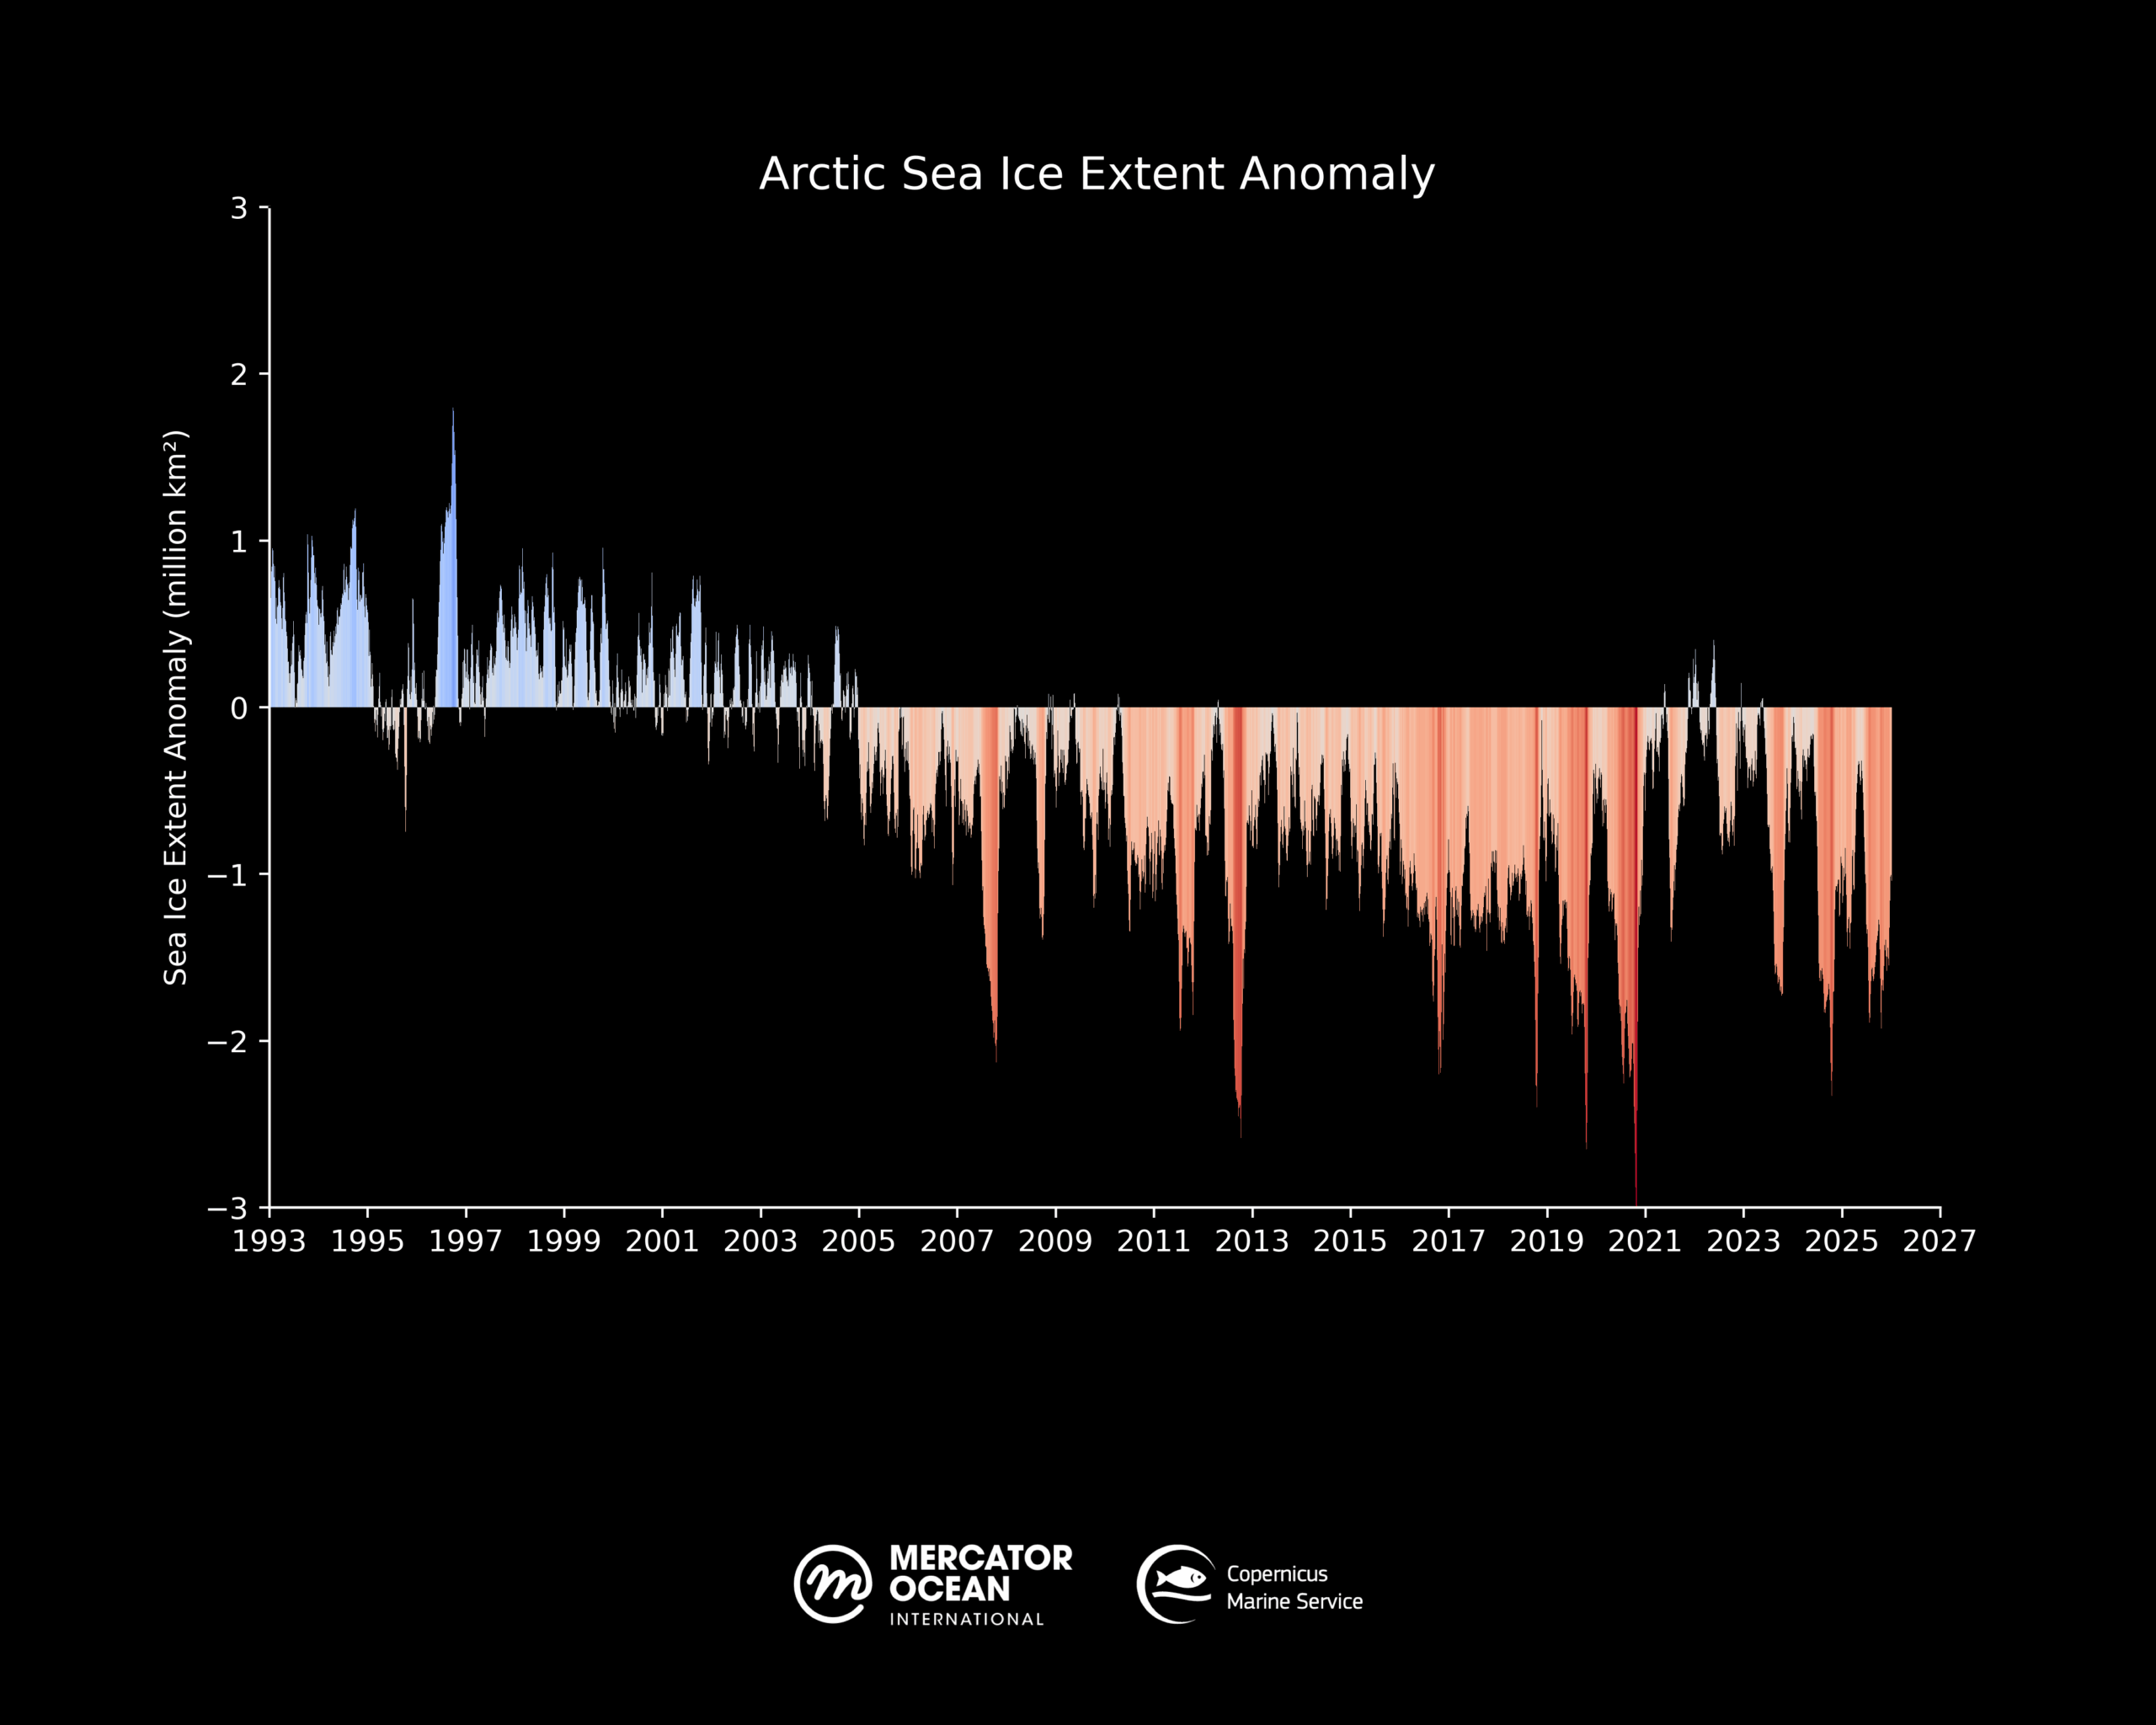
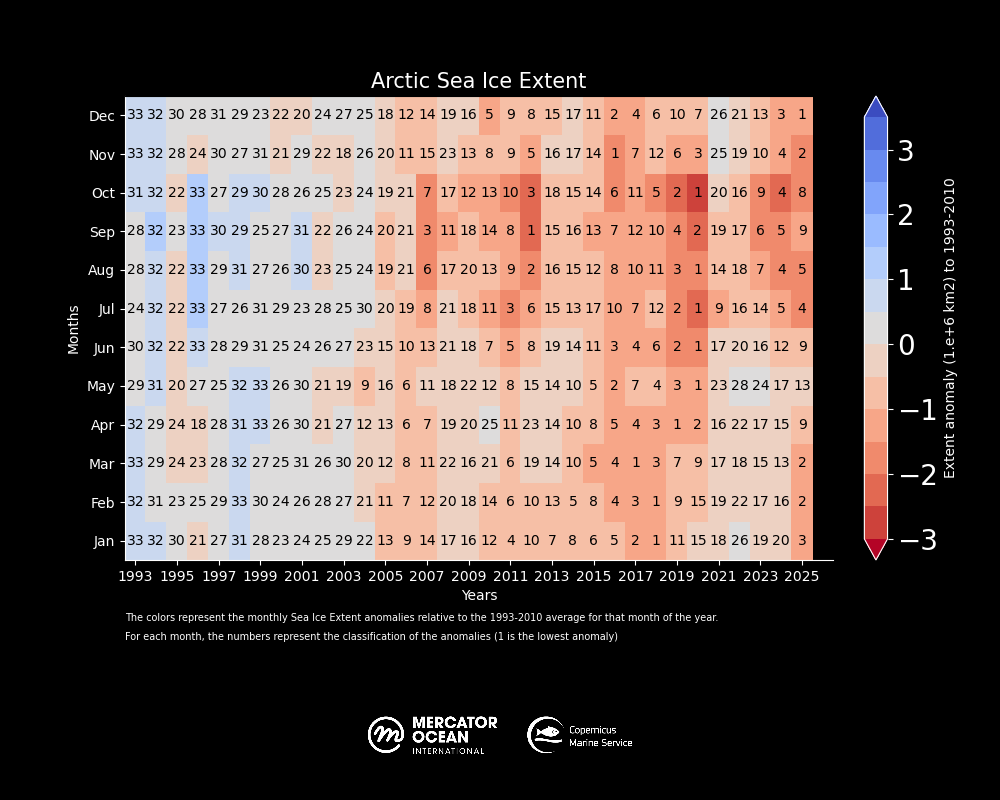
Sea ice cover in the Arctic registered among the 3 lowest winter values during the first trimester of 2025. By September, at the end of the summer in the Northern Hemisphere, sea ice remained as low as the 7th lowest.  

Sea surface temperature anomalies in the Arctic for November 2025 

Sea surface temperature average anomalies in the Arctic region for November 2025, and sea ice extent (white) for November 2025. Climatology for November (1993-2010) is represented with the black line. Data: Mercator Ocean’s GLO12/GLORYS12. Credit: Copernicus Marine Service/ Mercator Ocean International


Entering November 2025, the formation of sea ice remained very low for the season below the long-term average of 1993-2010) and as the second lowest for this month after 2016.  December 2025 reached record low sea ice values in the region. 


Arctic sea ice extent ranking by month since 1993 with sea ice extent monthly anomalies (shaded) using the 1993-2010 climatology. Data: Mercator Ocean’s GLO12/GLORYS12. Credit: Copernicus Marine Service/ Mercator Ocean International


Antarctic 

Daily Antarctic sea ice extent between 1993-2025. Data: Mercator Ocean’s GLO12/GLORYS12. Credit: Copernicus Marine Service/ Mercator Ocean International
Daily Antarctic Sea ice extent anomaly for the period 1993-2025 (using 1993-2010 climatology). Data: Mercator Ocean’s GLO12/GLORYS12. Credit: Copernicus Marine Service/ Mercator Ocean International
Antarctic sea ice extent ranking by month since 1993 with sea ice extent monthly anomalies (red and blue shades) using the 1993-2010 climatology. Data: Mercator Ocean’s GLO12/GLORYS12. Credit: Copernicus Marine Service/ Mercator Ocean International


Global sea ice

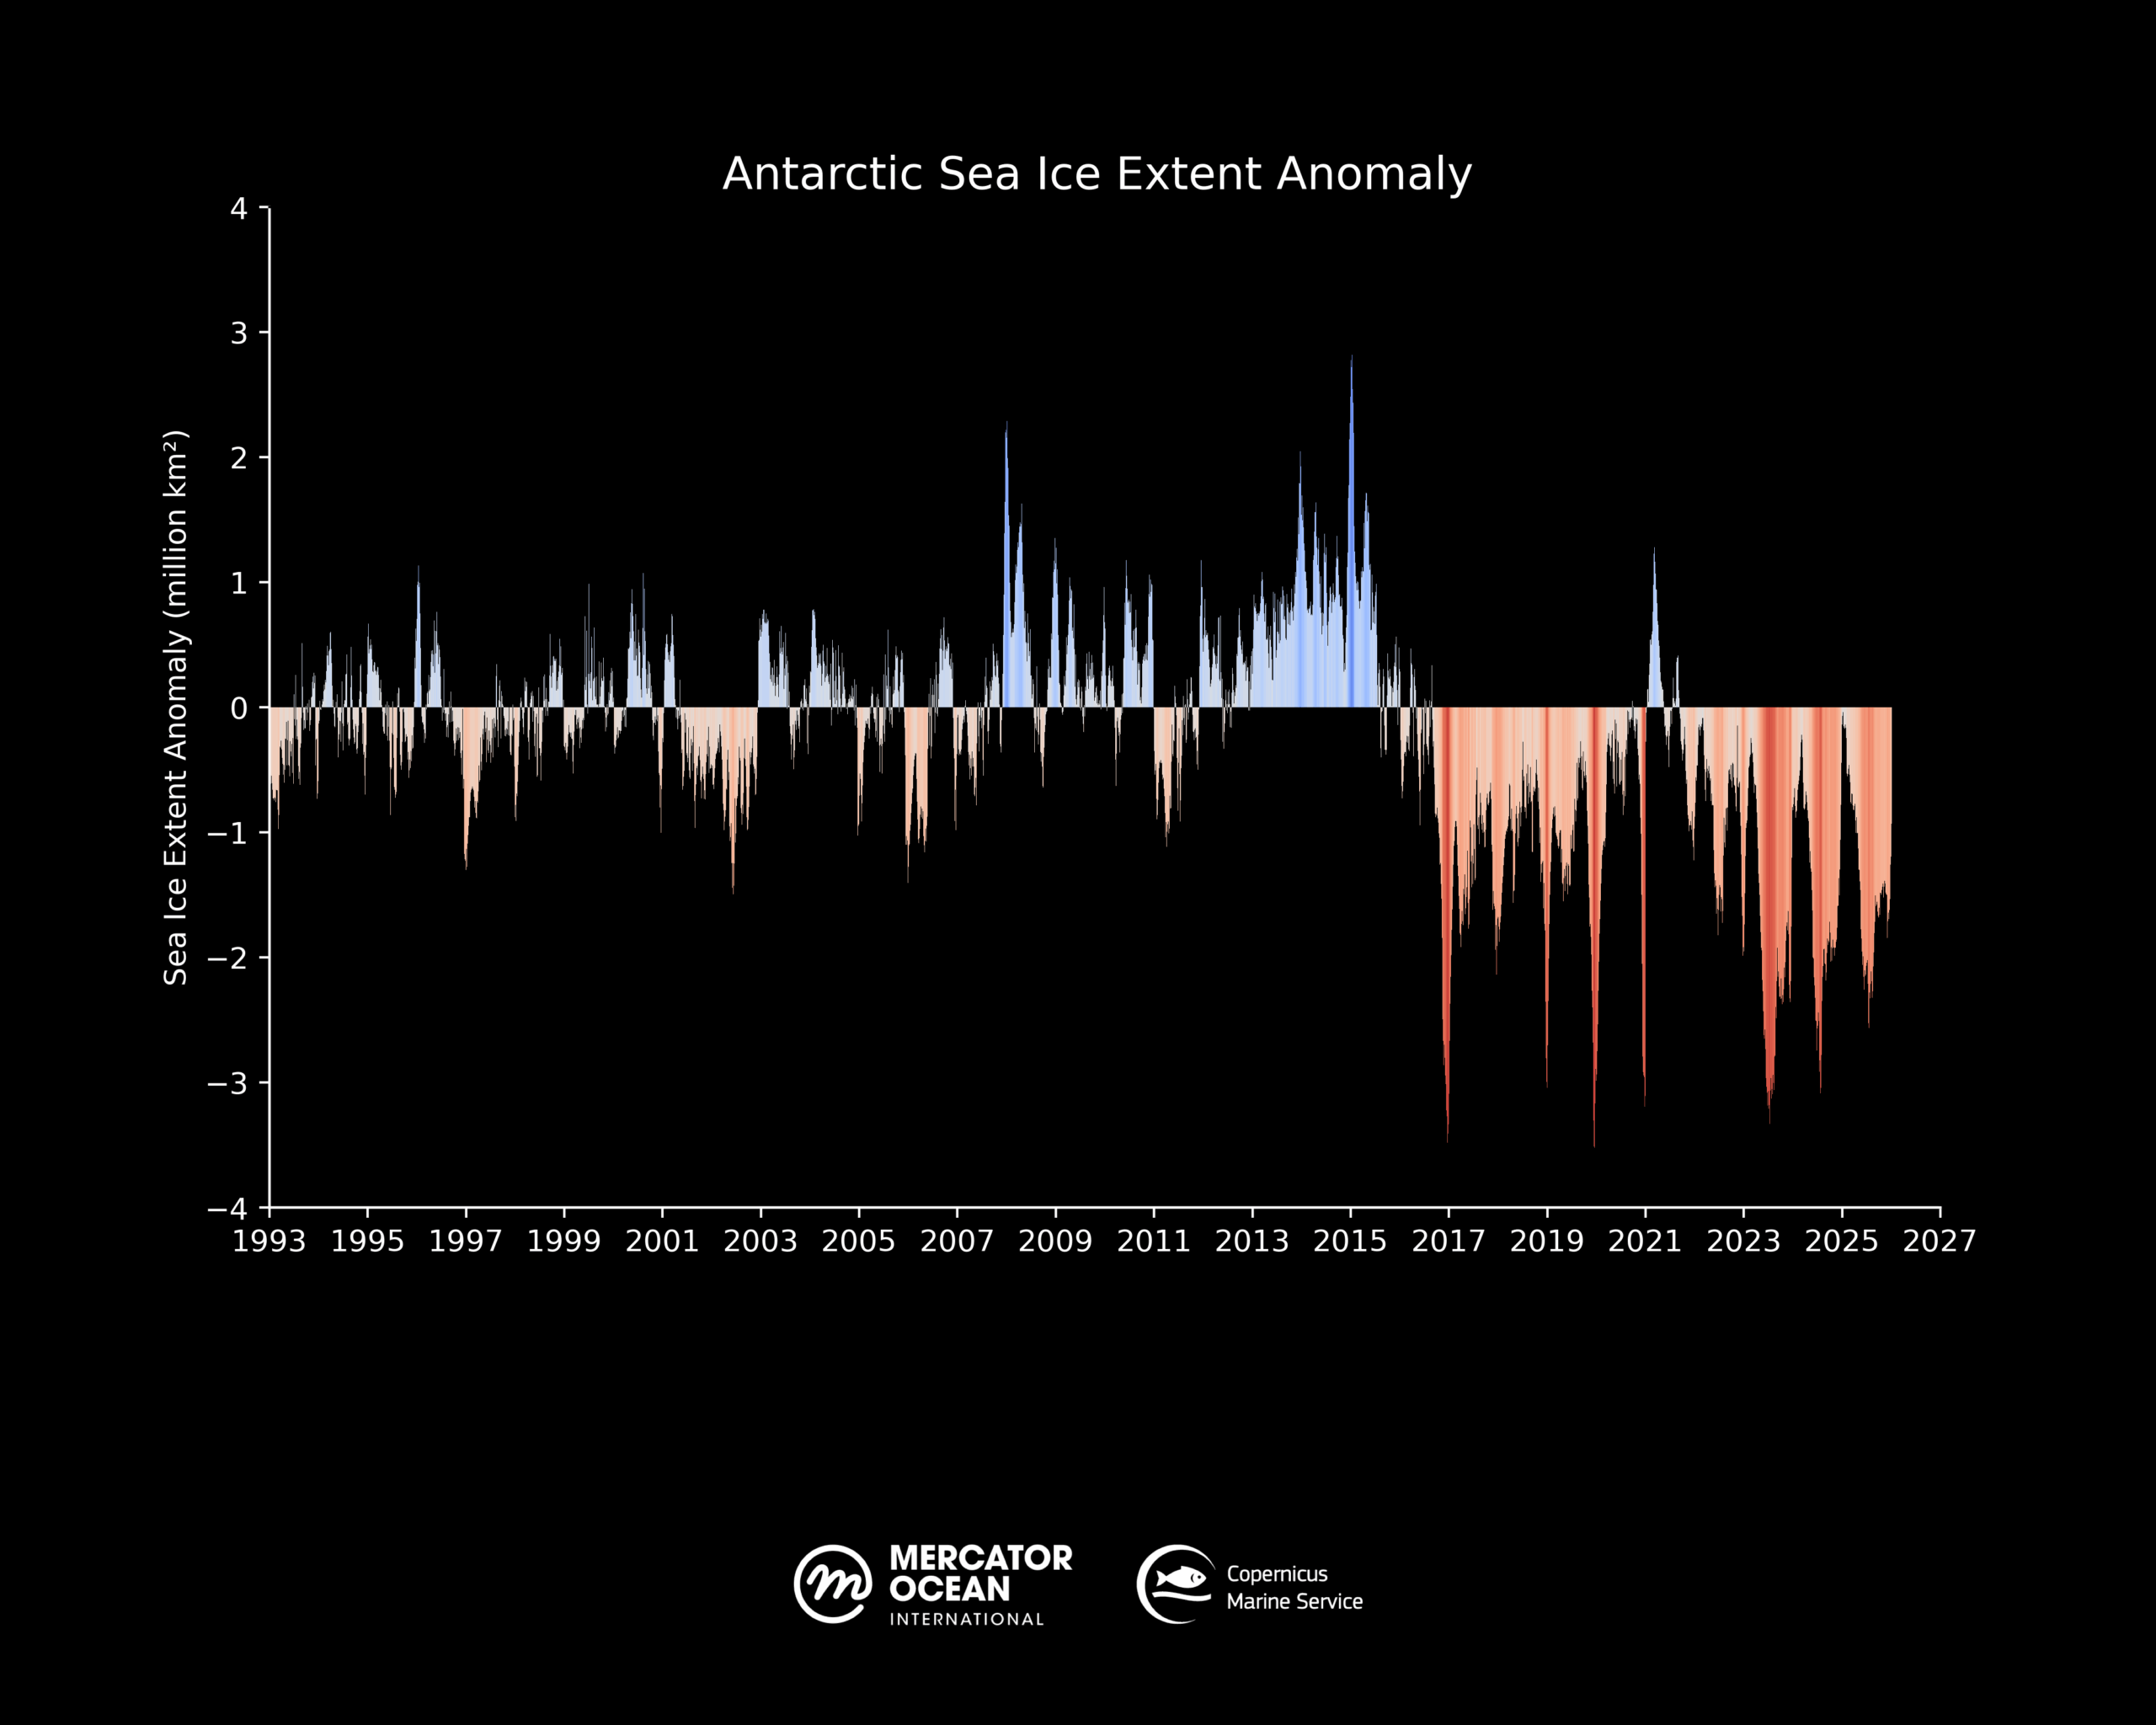
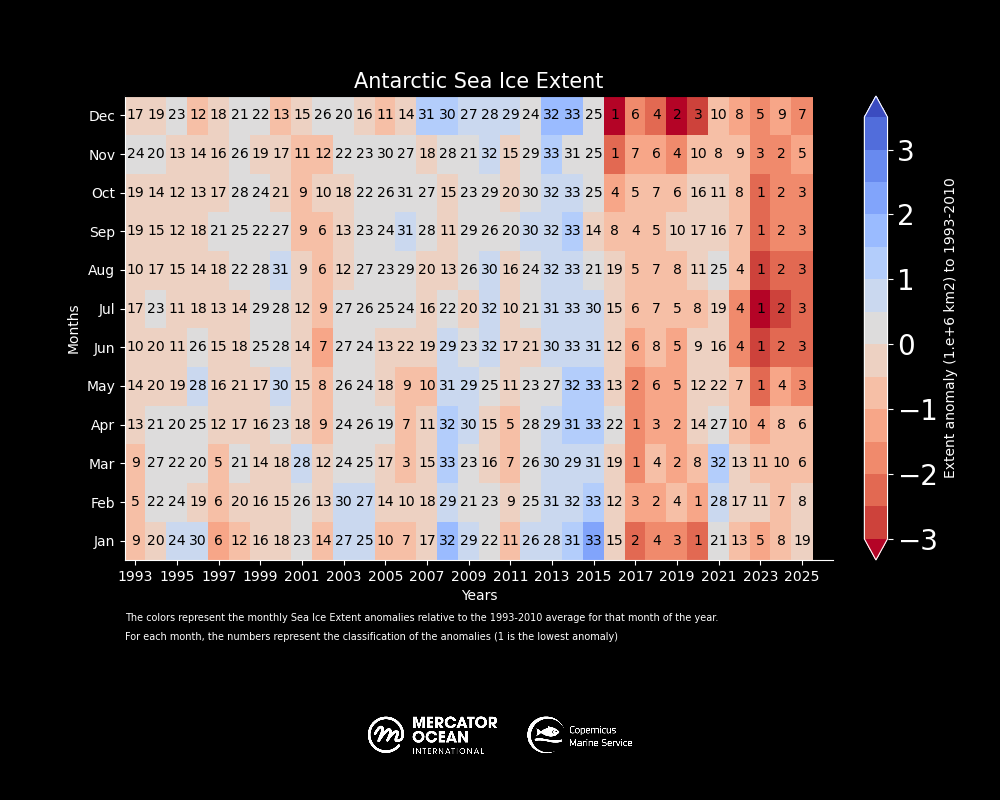
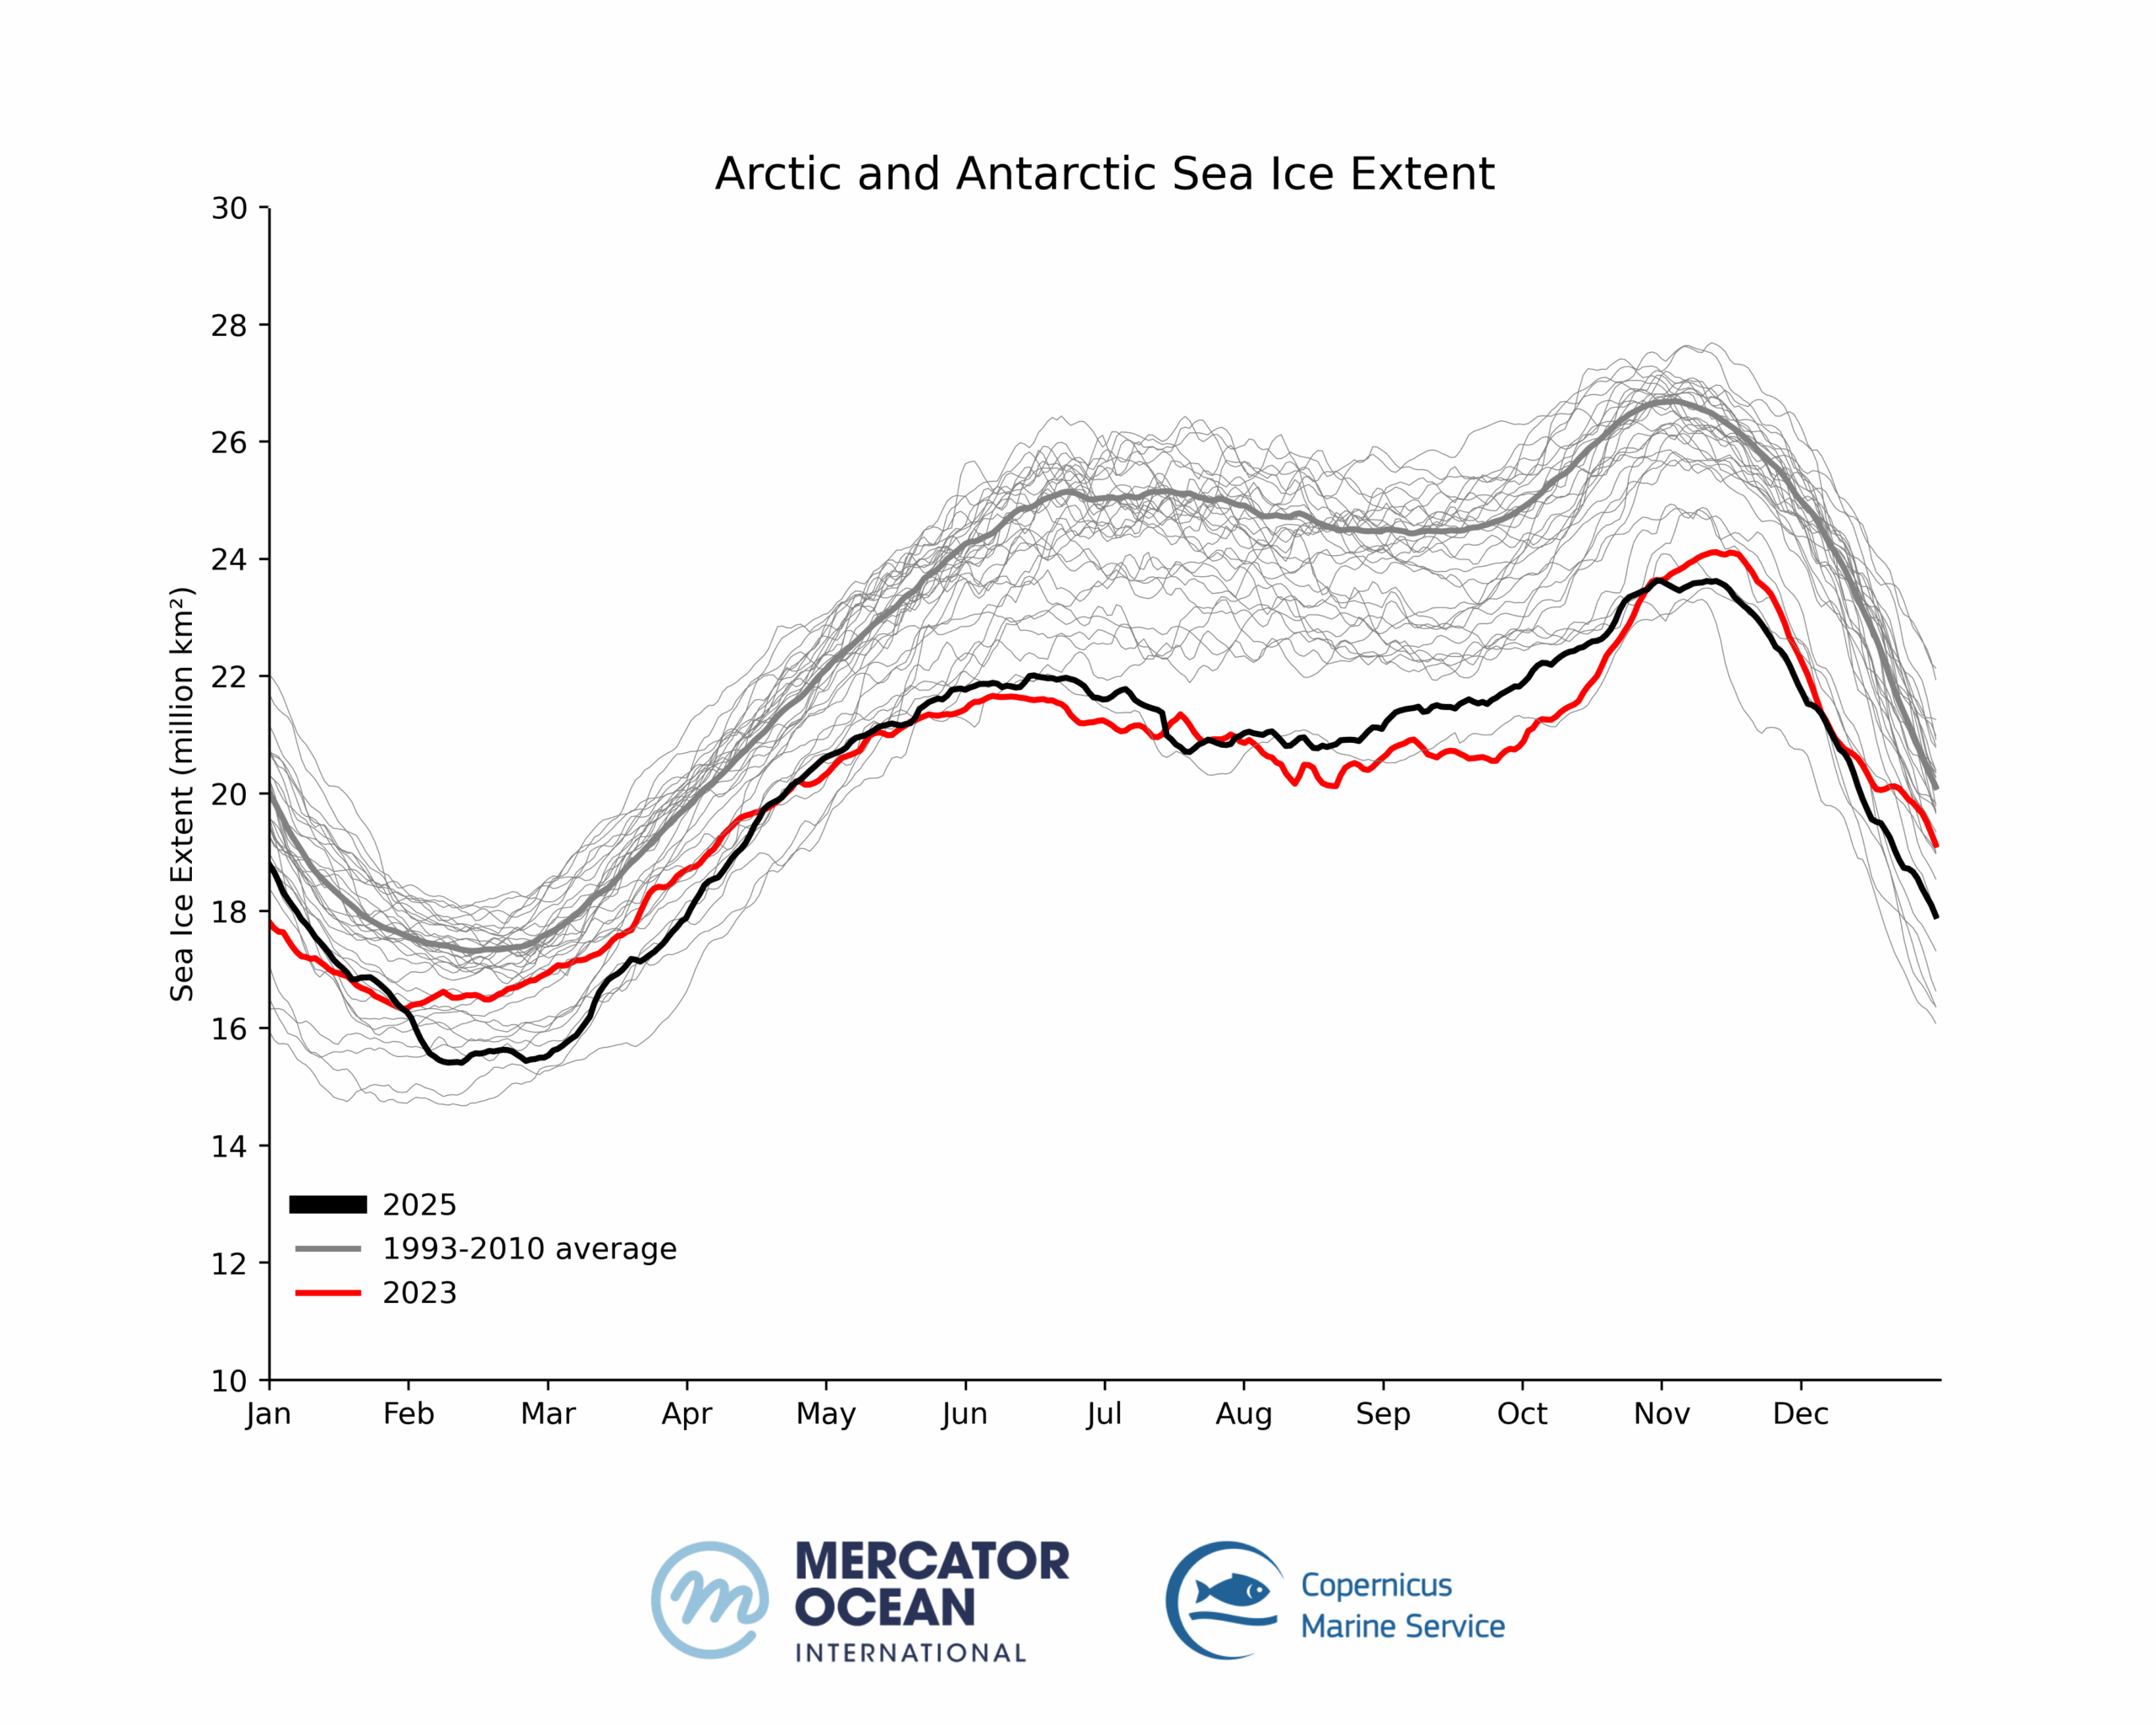
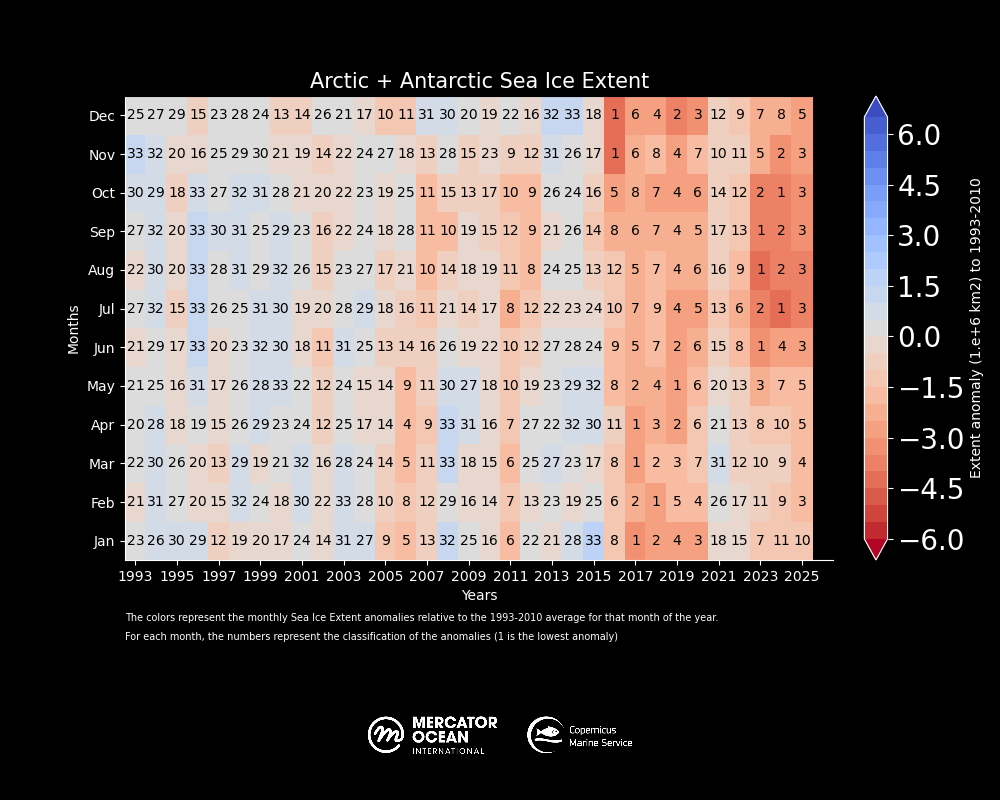
Global sea ice cover in 2025  continued well below the long-term average for most of the year. 11 out of 12 months of the year within the five lowest extents. 


Daily sea ice extent Arctic +Antarctic (1993-2025). Data: Mercator Ocean’s GLO12/GLORYS12. Credit: Copernicus Marine Service/ Mercator Ocean International
Global polar sea ice extent ranking by month since 1993 with sea ice extent monthly anomalies (red and blue shades) using the 1993-2010 climatology. Data: Mercator Ocean’s GLO12/GLORYS12. Credit: Copernicus Marine Service/ Mercator Ocean International
Daily Arctic + Antarctic sea ice volume (1993-2025). 


Notes

Definitions:
  • Sea ice concentration – percentage of sea ice cover within the data grid cell. 
  • Sea ice extent – area covered by a significant amount of sea ice, at least 15% sea ice concentration (km²).  
  • Sea ice volume – derived from sea ice concentration and sea ice thickness integrated over a respective area (km ³). 
Notes:

Products and data used: 

Credits:

*Image citation: European Union, Copernicus Marine Service Data 2025 I © Mercator Ocean 
All images in this article can be used freely and should be cited with the information above.

More on the topic: