
Today, leading scientists that contributed to the recent IPCC report of working group 1 on climate change have launched a project to update key climate indicators every year so people can be kept informed about critical aspects of global warming. As a partner of this project, Mercator Ocean International (MOi) contributes expertise to finding the Earth Energy Imbalance (EEI), the primary indicator used to understand the extent of human-induced global warming, which has more than doubled in the last two decades. The EEI is directly related to ocean heat because the ocean absorbs some 90% of the human-driven heat trapped in the Earth system.
Why do we need updated climate indicators?
We live in a rapidly changing climate, and we rely on key indicators of the state of the Earth system that help us assess the impact of human activities to make informed decisions. As Mercator Ocean transitions into an intergovernmental organisation, it responds the pressing call from European countries, the European Commission, United Nations frameworks, and the international community for reliable, timely, and accessible ocean data, indicators, and predictions to support the needs of countries worldwide. Mercator produces a suite of Ocean Monitoring Indicators across its programmes and initiatives and sees this as a top priority to meet the needs of policymakers to make evidence-based decisions for Ocean sustainability and governance.
The reports and assessments of the Intergovernmental Panel on Climate Change (IPCC) are relied upon as the authoritative scientific evidence for climate negotiations held under the United Nations Framework Convention on Climate Change (UNFCCC). This includes the initial global stocktake carried out under the Paris Agreement, which is scheduled to conclude at COP28 in December 2023. However, these IPCC reports are only published every 5-10 years, giving way to possibility in gaps in information and sometimes not keeping pace with rapid changes we are experiencing in the Earth system.
In this initiative led by the University of Leeds, scientists have developed an open data, open science platform – the Indicators of Global Climate Change. It has been launched with an associated website and paper. They have committed to annually updating information on key climate indicators. Dr. Karina von Schuckmann, oceanographer specialized in Ocean climate monitoring at MOi, has contributed to this project with the Earth heat inventory and ocean warming indicators, co-lead with Dr. Matt Palmer of the University of Bristol.
Key Findings of Project Paper
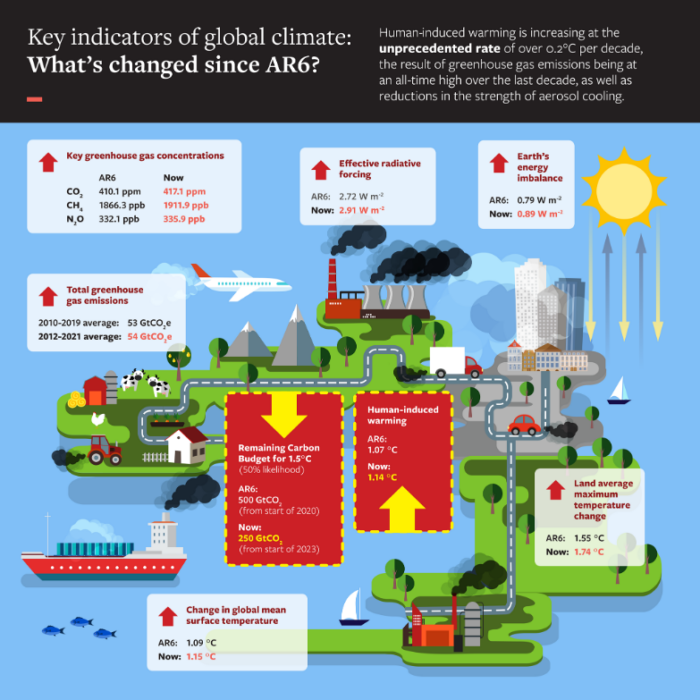
Greenhouse gas emissions at ‘an all-time high’- causing an unprecedented rate of global warming, say scientists
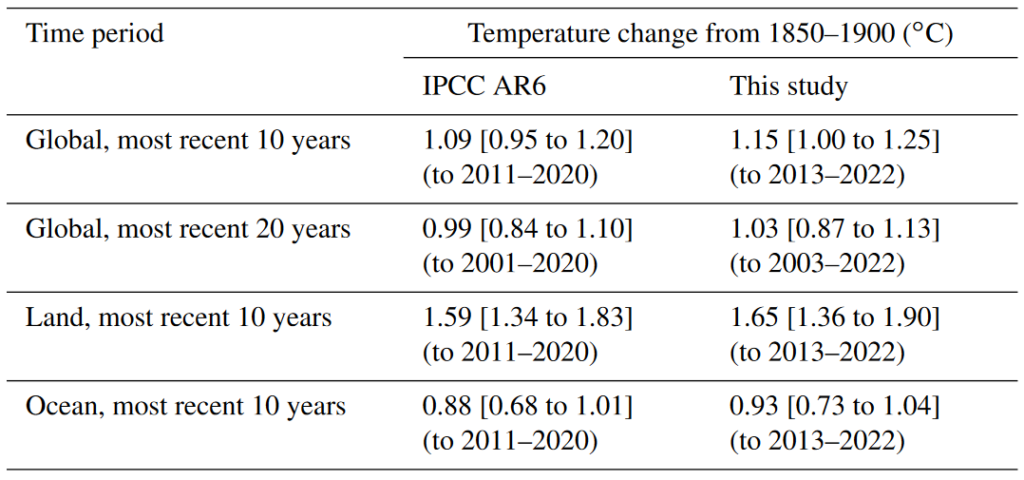
- Human-induced warming averaged 1.14°C over the last decade
- A record level of greenhouse gases is being emitted each year, equivalent to 54 billion tonnes of carbon dioxide
- The remaining carbon budget – how much carbon dioxide can be emitted to have a better than 50% chance of holding global warming to 1.5°C – has halved over three years
- Successive increases in EEI for each 20-year period since 1973, with an estimated value of 0.44 Watts per square metre during 1973-1992 that almost doubled to 0.82 Watts per square metre during 2003-2022.
- The EEI has increased to around 0.9 Watts per square metre, averaged over the last 12 years.
As the information and indicators produced as a part of this project are traceable to IPCC report methods, they can be trusted by all parties involved in UNFCCC negotiations and help convey wider understanding of the latest knowledge of the climate system.
Ocean Warming Findings
Below are paraphrased excerpts from the paper with tables and graphs outlining the findings surrounding the ocean.
The EEI is a way to measure the extra human-driven heat that has accumulated in the climate system and acts as a fundamental measure of climate change. The EEI indicator reveals to what extent energy is leaving the top of the atmosphere compared to the amount that is entering the Earth climate system from solar radiation. With the greenhouse effect, heat energy is trapped, and this imbalance means that the Earth is accumulating heat in the climate system. This global warming leads to various changes in the Earth’s system, such as rising sea levels, warming oceans, melting ice, higher temperatures, increased water vapor in the atmosphere, and thawing permafrost all of which have with profound and adverse impacts on ecosystems and human systems.
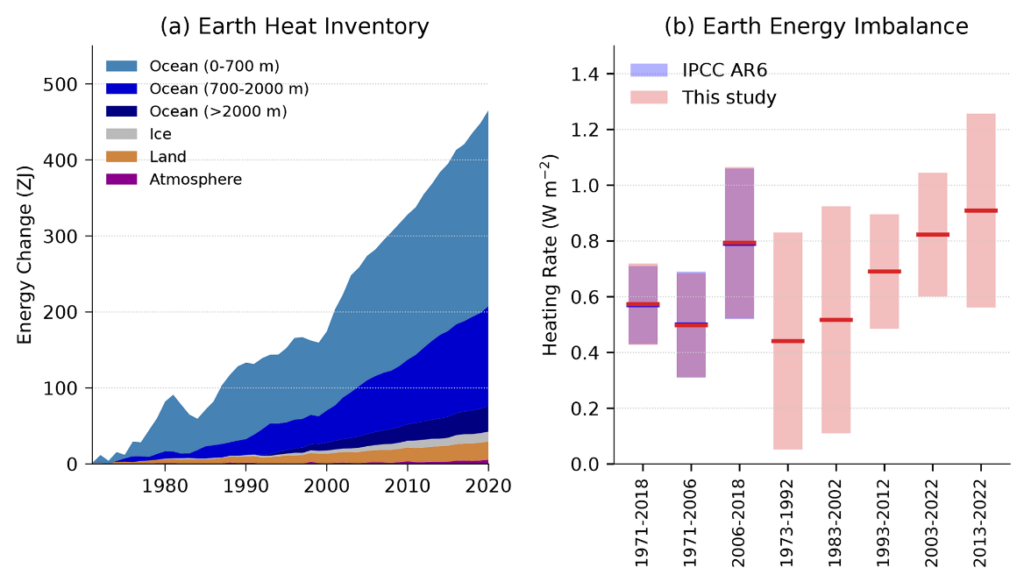
The paper found that the EEI has been steadily increasing. From 1973 to 1992, the estimated value of EEI was nearly 0.44 Watts per metre squared (W m−2), and it nearly doubled to 0.82 W m−2 from 2003 to 2022 (figure 1a). This indicates a significant rise in accumulated energy in the climate system. Additionally, there is evidence that the warming effect is reaching deeper into the ocean, as there has been a notable increase in warming in the deep ocean layers (700–2000 meters) since the 1990s.
Furthermore, it is estimated that more than half of the increase in ocean heat content since the late 1800s has occurred after the 1990s. In the period of 1973–1992, the contribution of the different vertical layers of the ocean to the heat content increase was 66% for the top 0–700 meters, 28% for the range of 700–2000 meters, and 1% for depths greater than 2000 meters. However, from 2013 to 2022, the respective contributions were 50%, 33%, and 8%.
Important Links
- Indicators of Global Climate Change 2022: annual update of large-scale indicators of the state of the climate system and human influence, published in the Earth System Science Data. Earth Syst. Sci. Data, 15, 1–33, 2023 https://doi.org/10.5194/essd-15-1-2023
- Climate Change 2021: The Physical Science Basis, IPCC 6th assessment report, Working Group 1
- Press event: Presented by the University of Leeds: Indicators of Global Climate Change, 08. June 2023 at 12:00 CEST
- Global Warming and the Ocean: a new study led by Mercator Ocean International expert sheds light on the Earth’s Energy Imbalance
- WMO State of the Global Climate 2022: Mercator Ocean expertise contributes
- Global sea surface temperatures reach record high