
For the past several months, the temperature of the ocean’s surface, which has already risen by 0.88 degrees Celsius since the beginning of the pre-industrial era due to global warming, has risen to unprecedented levels. Marine heatwaves have already been spotted across the globe, including strong to severe instances in the North Atlantic. Possibly linked with these marine heatwaves, there is a significant decrease in phytoplankton is observed in the Eastern North Atlantic. The Antarctic sea ice extent for May and June have also reached record lows since the beginning of satellite records. This comes at the same time as our oceanographers see the return of El Niño, as well as signals of Coastal El Niño conditions.
Record-high sea surface temperatures
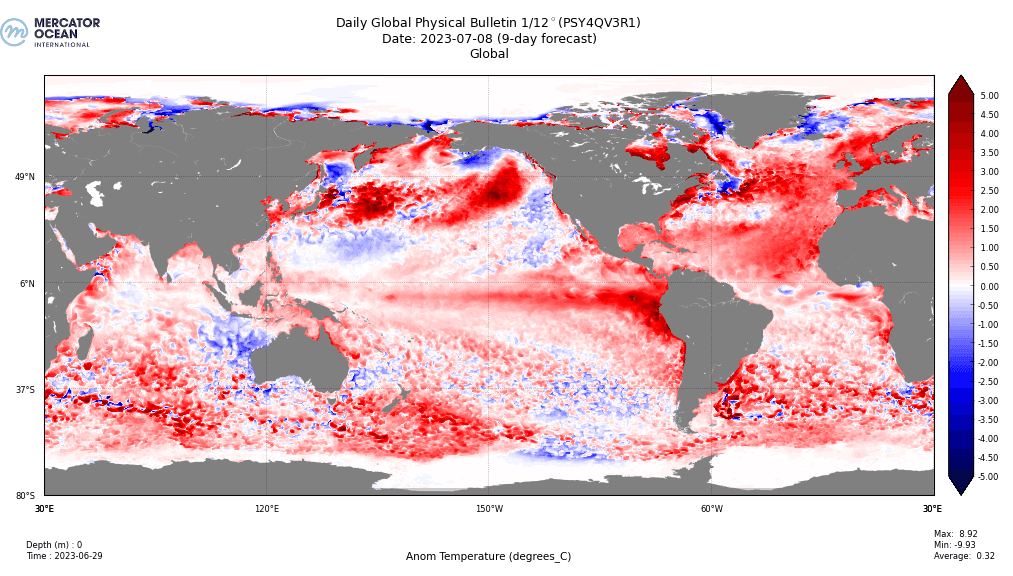
- During the month of June, average global sea surface temperatures excluding the poles (between 60°S and 60°N) were at unprecedented highs compared to the average long-term temperatures for the month of June. Since April 2023, when the highest record was measured at above 21.0 degrees, sea surface temperatures have slightly dropped but have remained at record-high levels globally for typical temperatures observed during May and June. The Mercator Ocean 10-day forecast shows that this high-temperature trend continues into July (Figure 1).
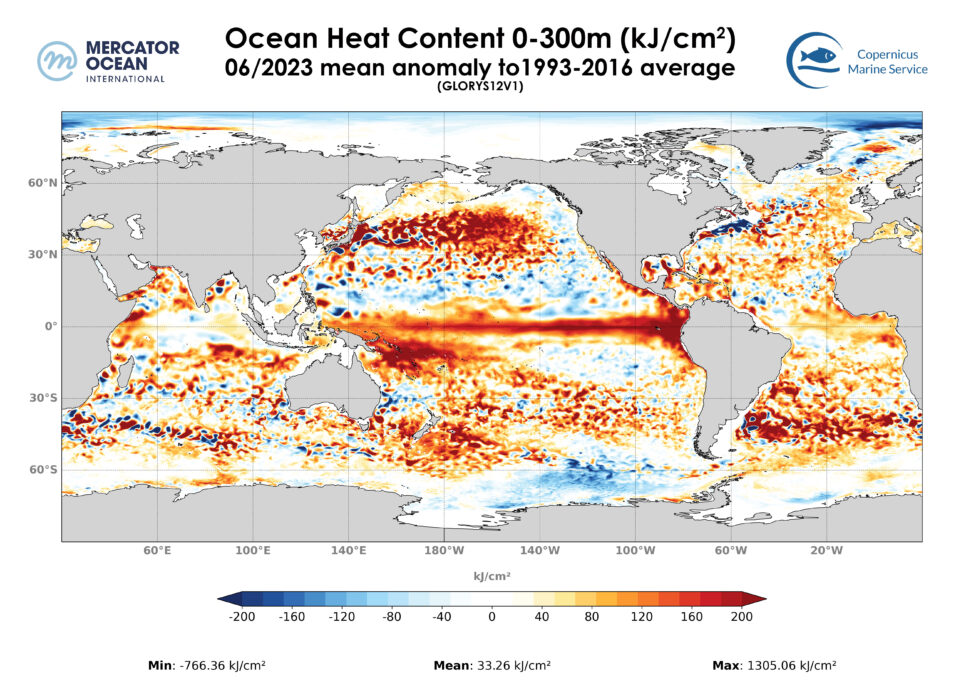
- These heightened temperatures are also seen at depth this June compared to the same period over the long-term average across much of the global Ocean. There are continued heightened temperatures in the North Atlantic, the site of current marine heatwaves, as well as in the central and western Pacific, a typical signature of El Niño. Figure 2 illustrates the ocean heat content from 0 to 300 metres, the red zones show abnormally high subsurface temperatures, with hot clusters found across the globe.
Marine heatwaves
These heightened ocean temperatures make the risk of severe marine heat waves in the summer very high. Below we focus on the marine heatwaves in the North Atlantic because of their potential impact. These marine heatwaves cause a significant decrease in chlorophyll-a concentration, a finding supported by our model and existing literature (see next section).
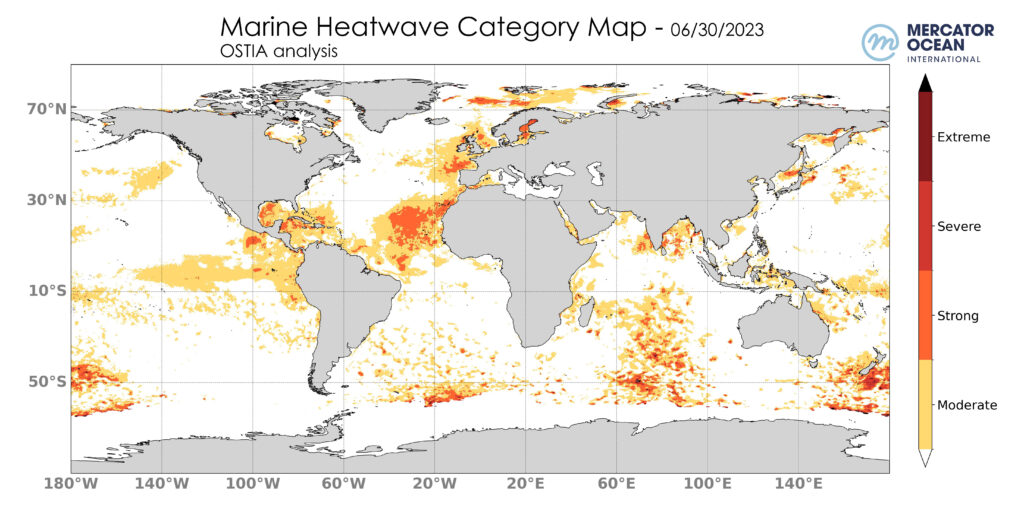
- There are strong to severe marine heatwaves detected in the North Atlantic (figure 3) as of late June 2023.
- The Mercator Ocean sea surface temperature anomaly 10-day forecast for the North Atlantic reveal continued elevated temperatures (not shown).
- In the Eastern North Atlantic, a significant decrease in chlorophyll-a concentration is observed, with decreases of up to 50-60% (as shown in Figure 4).
- This decrease in chlorophyll-a is closely related to the spatial distribution of the current marine heat wave in the region (Figure 3). This suggests that the ongoing warm spell could be affecting the tiny plants in the ocean, known as phytoplankton (chlorophyll-a is the green pigment in phytoplankton).
A recent study of combined marine heatwave and low chlorophyll events supports this observation. The study indicates that during this time of year, in this region, marine heatwaves are three times more likely to cause a decrease in chlorophyll levels than if the marine heatwaves and the decrease in chlorophyll were independent.
In June, the North Atlantic reaches the peak of its spring phytoplankton bloom. The North Atlantic spring bloom is the most remarkable seasonal increase in phytoplankton biomass in the world’s oceans. This organic carbon that is synthesized during the spring bloom is thought to play a vital role, providing the majority of the energy needed to sustain the entire marine food chain in the region and making a substantial contribution to global ocean CO2 uptake. Though further studies are required in order to assess the situation, the significant reduction in chlorophyll-a concentration associated with the ongoing marine heatwave could potentialy have impacts on the marine ecosystem or even mechanisms like the carbon cycle in the region.
Arrival of El Niño conditions
The El Niño Southern Oscillation (ENSO) is one of the most important sources of climatic variability resulting from a strong coupling between ocean and atmosphere in the tropical Pacific. Globally, it impacts ecosystems, precipitations, and freshwater resources. The ENSO is characterized by two phases that last from several months to more than a year and recur irregularly on a typical time scale of 2-7 years. The warm phase El Niño is broadly characterized by a weakening of the easterly trade winds at interannual timescales associated with a surface ocean warming in the central to eastern Pacific. Opposite changes are observed during the cold phase La Niña.
Tracking El Niño is crucial because it can have impacts on agriculture, ecosystems, and economies worldwide. El Nino monitoring provides valuable information for predicting and managing climate-related impacts, including droughts, floods, and shifts in global weather patterns, allowing for better preparedness and mitigation strategies.
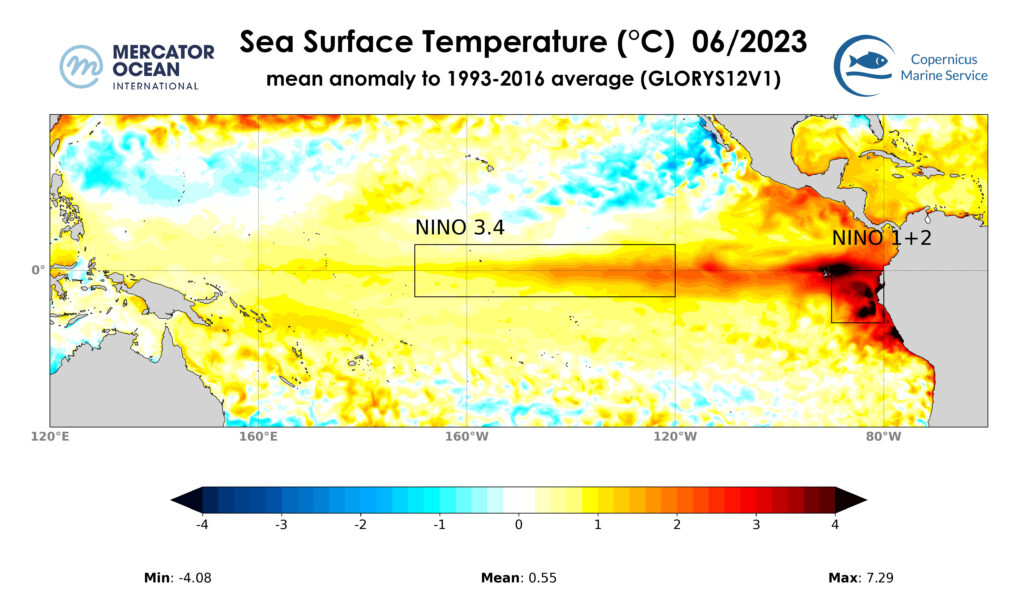
- El Niño conditions have developed (and deemed likely by the WMO). In figure 7, the warming near the equator in the central to eastern Pacific shows the signature of the El Niño conditions. The boxes Niño 3.4 and Niño 1+2 indicate conventional regions where sea surface temperatures are monitored and forecasted.
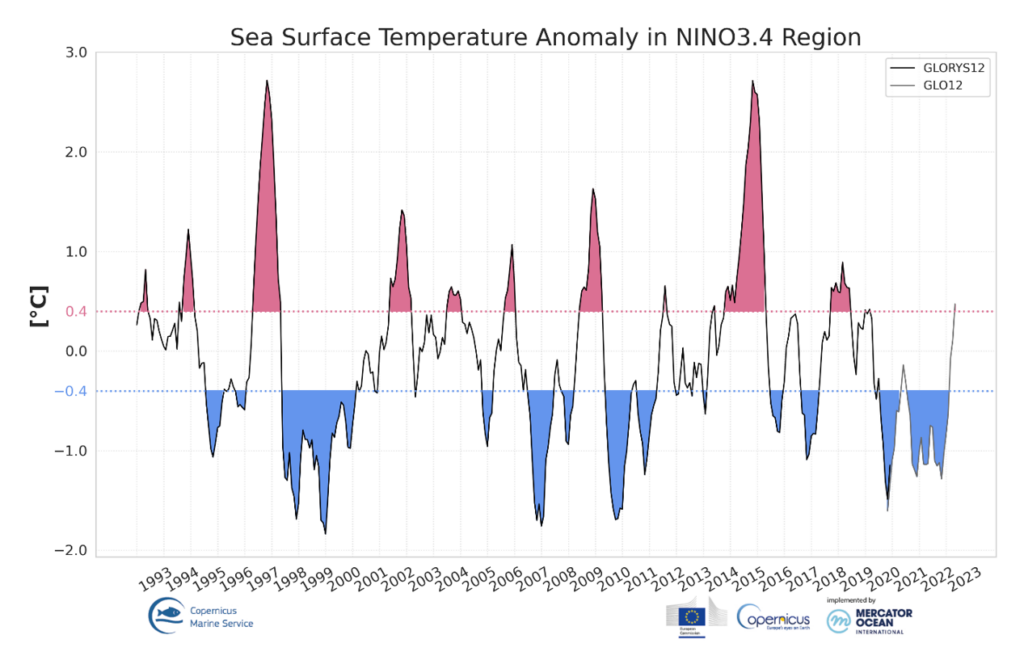
- Sea surface temperature anomalies in the tropical Pacific have already surpassed key thresholds and El Niño conditions are currently observed (figure 8).
The index Nino 3.4 sea surface temperature (figure 8) is a conventional indicator of the state of the ENSO. Scientists typically declare an El Niño to be present when sea surface temperatures averaged in the region Niño 3.4 (figure 7) rise at least 0.4 degrees above norm for more than six consecutive months, along with additional analysis. Such a threshold has recently been surpassed (Figure 8).
Coastal El Niño
Mercator Ocean International scientists have detected the conditions typical of a Coastal El Niño, and their findings are in alignment with the global scientific authorities on this topic. While El Niño refers to a warming of the broad tropical Pacific, a Coastal El Niño refers to a more localized ocean warming near South America. A Coastal El Niño is declared when sea surface temperatures averaged in the region Niño 1.2 (figure 7) rise to a certain threshold. The coming of El Niño also coincides with the development of strong Coastal El Niño conditions. These together increase the potential impacts that are particularly felt in Peru and Ecuador.
Heavy rains have hit northern Peru since January resulting in floods and landslides that have affected thousands of people, leaving many homeless. The official entity in charge of monitoring the phenomenon in Peru, Estudio Nacional del Fenómeno del Niño (EFEN) declared an alert for Coastal El Niño, warning of increased rainfall in the northern part of the country in 2024. In an interview with the BBC Rina Gabriel of EFEN said that El Niño and Coastal El Niño generates much higher rainfall than normal and that there could be a high human cost and economic losses if preventive measures are not taken in advance.
WMO declares El Niño conditions
The World Meteorological Organization (WMO) announced in May that “lobal temperatures are likely to surge to record levels in the next five years, fuelled by heat-trapping greenhouse gases and a naturally occurring El Niño event.”
“A warming El Niño is expected to develop in the coming months and this will combine with human-induced climate change to push global temperatures into uncharted territory. This will have far-reaching repercussions for health, food security, water management and the environment. We need to be prepared,” WMO Secretary-General Prof. Petteri Taalas
Below are some key findings from this WMO Global Annual to Decadal Climate Update (Target years: 2023-2027):
- The average global temperature in 2022 was about 1.15°C above the 1850-1900 average. The cooling influence of La Niña conditions over much of the past three years temporarily reined in the longer-term warming trend. But La Niña ended in March 2023 and an El Niño is forecast to develop in the coming months. Typically, El Niño increases global temperatures in the year after it develops – in this case this would be 2024.
- There is a 98% chance of at least one in the next five years beating the temperature record set in 2016 when there was an exceptionally strong El Niño.
Important links
- Mercator Ocean News: Lowest recorded Antarctic sea ice extent for June
- World Meteorological Organization, 17 May 2023: Global Temperatures set to reach new records in next five years
- BBC June 29 Qué es el Niño costero, el fenómeno que multiplica los efectos de El Niño en Perú y Ecuador
The AR5 assessment is confirmed, and it is now very likely that global mean SST changed by 0.88 °C from 1850–1900 to 2011–2020, and 0.60 °C from 1980 to 2020 (Figure 9.3 and Table 2.4). (IPCC SROCC 9.2.1.1, 2019)
https://data.marine.copernicus.eu/product/GLOBAL_ANALYSIS_FORECAST_BIO_001_028/description
Legrix et al. 2021, https://bg.copernicus.org/articles/18/2119/2021/
https://www.nature.com/articles/s41467-017-02143-6
https://marine.copernicus.eu/news/ocean-monitoring-indicators-more-40-updates
https://news.un.org/es/story/2023/05/1520492
https://public.wmo.int/en/media/press-release/global-temperatures-set-reach-new-records-next-five-years
https://public.wmo.int/en/media/press-release/global-temperatures-set-reach-new-records-next-five-years
The bullet points are taken from the World Meteorological Organization (WMO) press release (https://public.wmo.int/en/media/press-release/global-temperatures-set-reach-new-records-next-five-years) covering the findings of the WMO Global Annual to Decadal Climate Update (Target years: 2023-2027) (https://library.wmo.int/index.php?lvl=notice_display&id=22272)