
Overview
Mercator Ocean International oceanographers analyse the record-breaking temperature of the Earth’s ocean surface, which has reached the highest level recorded since satellite records began, only narrowly exceeding the 2016 record. Our data reveals that currently, multiple regions, such as the North Pacific, eastern South Pacific, the north Atlantic, and areas near New Zealand and Australia are experiencing moderate to severe marine heatwaves. As our climate continues to rapidly warm, new temperature records are being regularly set, and there are predictions of a possible upcoming El Niño event which could give way to further warming.
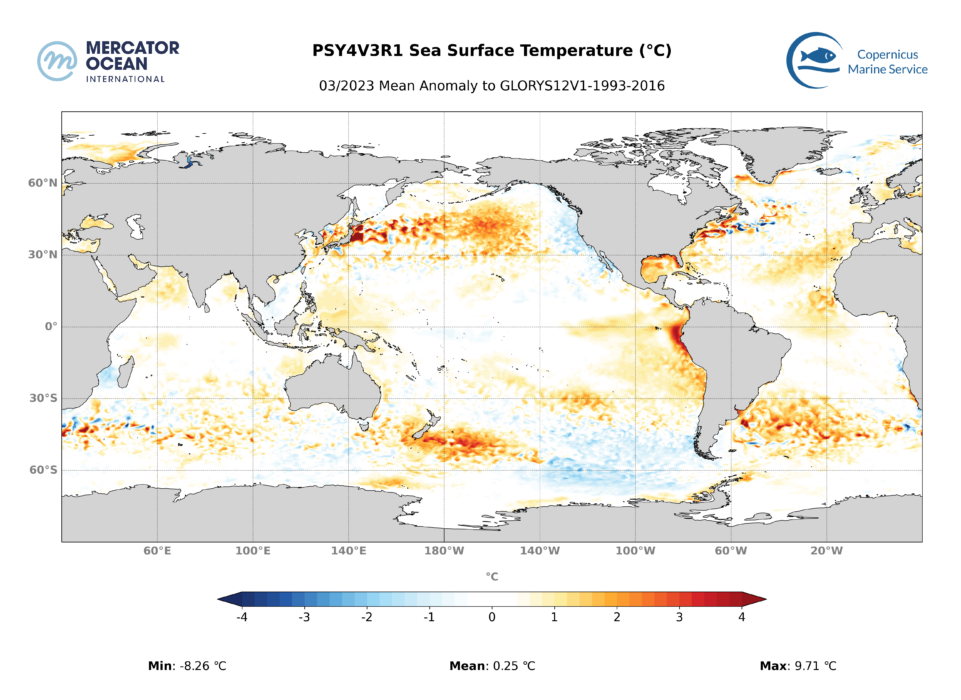
Record sea surface warming in April 2023
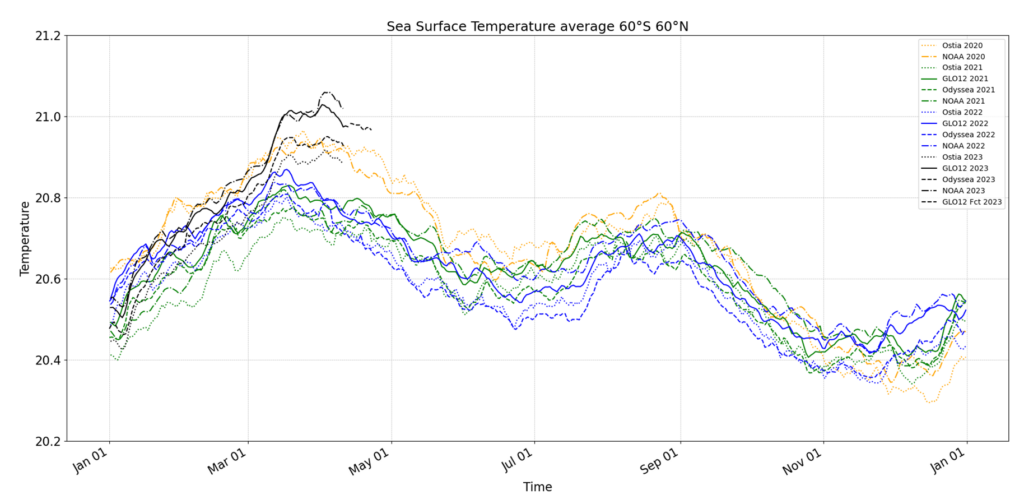
Since the beginning of April 2023, the mean temperature of the ocean’s surface has surpassed the previous record of 21°C (degrees Celsius) established in 2016, reaching 21.1°C (where sea surface temperature is averaged between 60°S/60°N). This peak has passed and there is an indication that temperatures are again descending, following the seasonal cycles. Excluding polar regions, the annual maximum of global sea surface temperature is generally reached in March.
The figure below illustrates the global sea surface temperatures in 2023 from Mercator Ocean model analysis (black line) surpassing temperatures in 2021 (blue), 2022 (green) for February to April, as well as the estimated average from 1982 to 2022 (grey, data from NOAA). The Mercator Ocean model forecast (red line), that goes 10 days into the future, shows continued elevated temperatures well above those recorded in 2021, 2022, and the 1982-2022 average in the same period.
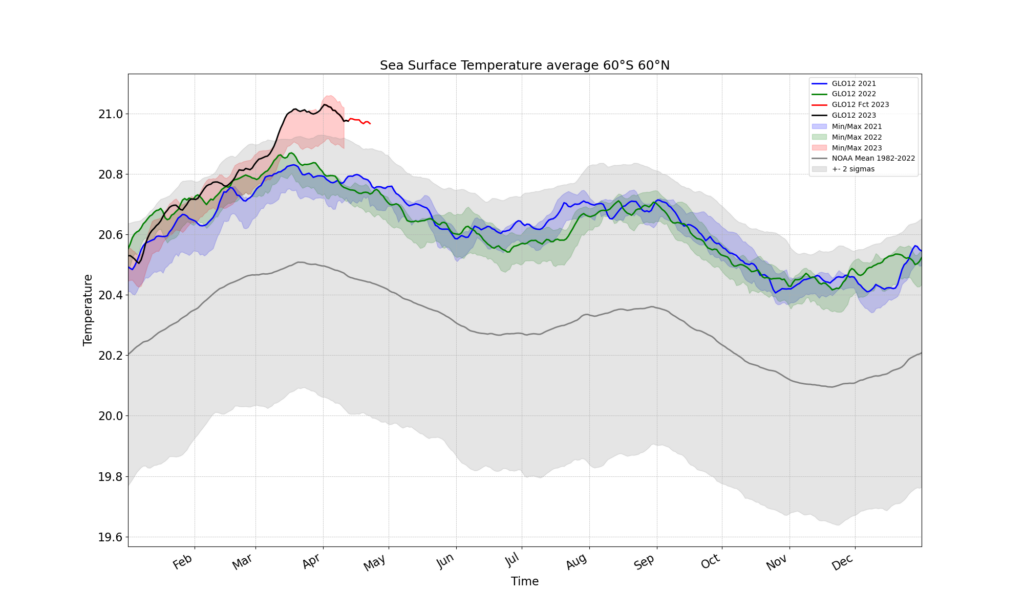
The annual maximum of global sea surface temperature is generally reached in March. This corresponds to the end of summer in the Southern Hemisphere, which has a much larger ocean than the Northern Hemisphere.
For the last three years, the tropical Pacific has experienced a particularly long episode of La Niña conditions, providing a temporary cooling effect, felt even at the global scale, and thus partially mitigating the recent impact of warming of the ocean surface brought on by greenhouse gas emissions. However, it did not entirely offset the long-term warming of the ocean surface. The La Nina conditions abated in March and there are currently neutral conditions that will potentially last until May before a possible El Nino surge this summer. If an El Nino occurs, we could have particularly warm years in 2023 and 2024, probably warmer than 2022 on a global scale.
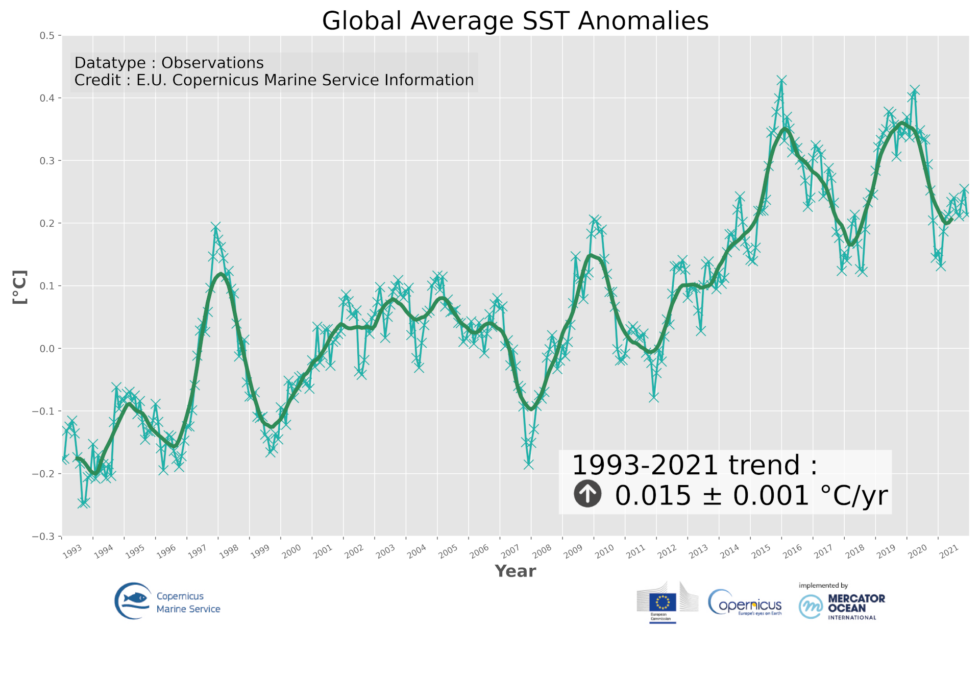
Before the latest record set in early April, the warmest year on record was 2016 and occurred during a particularly intense El Nino event. Overall the ocean is warming, though there are variations in intensity from year to year, with years in which the warming is more intense than others, as is the case on land. This variation is particularly related to the largest natural climate fluctuation on Earth: the El Nino Southern Oscillation (ENSO). The El Niño phase leads to a temporary additional warming of the atmosphere. These interannual fluctuations sit on top of global warming, which is human induced.
From the second half of the 19th century to the 2010s, the surface of the ocean has warmed by 0.9°C. This is slightly less than the global surface warming of the Earth, set at 1.1°C, because the surface warming is stronger over land (+1.6°C) than over the ocean (+0.9°C). Areas of the upper layers of the ocean with particularly intense heat content are in the North Atlantic and Southern Ocean. The tropical oceans’ sea surface temperature has warmed faster than any other region since 1950.
Ocean warming
The ocean is a climate regulator, and it acts as a buffer against the effects of global warming, slowing down the warming of the planet’s surface. The ocean has absorbed about 90% of the Earth system, heat excess from anthropogenic emissions of greenhouse gases. When the Earth system warms up, the ocean absorbs much of the excess heat and exports it at depth, where it can be trapped for centuries. The ocean’s currents help to distribute heat around the world, carrying warm water from the tropics to the poles and cooler water from the poles to the tropics. This helps to regulate the temperature of the ocean and the surrounding atmosphere. The ocean thus absorbs and distributes heat, two mechanisms that make life on Earth as we know it possible.
The energy stored as heat by the ocean over the last 50 years (between 1971 and 2020) is 381 ZJ (Zeta Joules) (von Schuckmann et al. 2023). To put this in perspective, the UN IPCC Sixth Assessment Report calculated that the 2006 to 2018 average Earth system heating is equivalent to approximately 20 times the annual rate of global energy consumption in 2018. Over the last 18 years, the rate of ocean warming, and thus the energy imbalance of the earth has nearly doubled (von Schuckmann et al. 2023). The Earth energy imbalance (EEI) is the main metric used to quantify global warming.
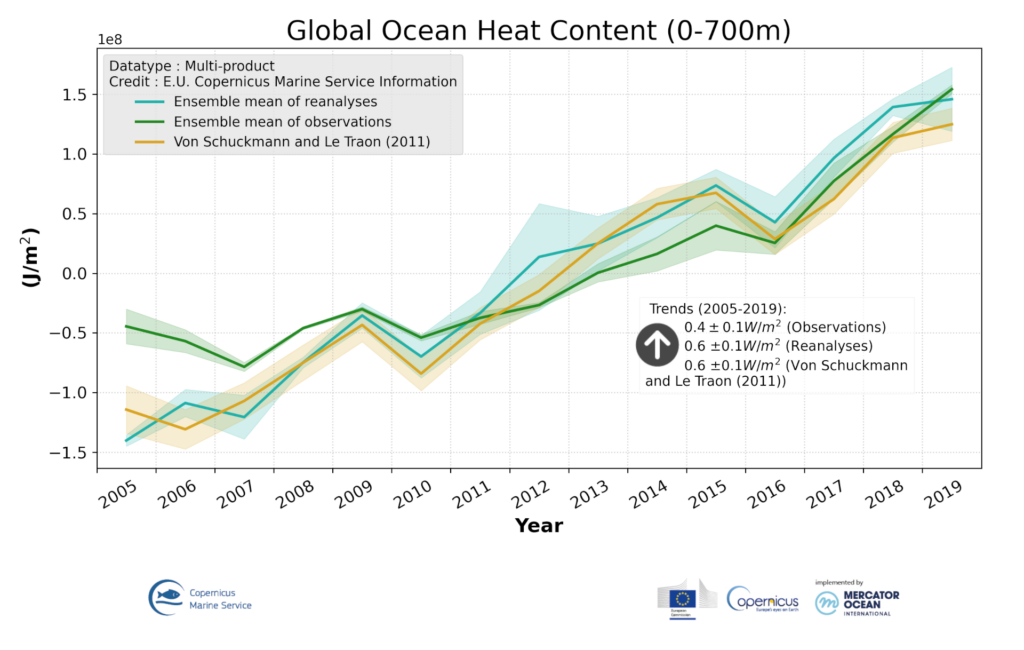
In a recent paper, Heat stored in the Earth System 1960-2020: where does the energy go?, was published in Earth System Science Data, led by Karina von Schuckmann of Mercator Ocean International with an international team of 70 researchers hailing from 15 countries. It revealed that the Earth’s oceans have absorbed 89% of the excess anthropogenic heat accumulated in the Earth system over the past six decades. Additionally, the study highlights that over the last 15 years, the accumulated heat has risen by nearly 50% in comparison to the amount accumulated over the last 50 years, with the majority of the heat being absorbed by the ocean. This phenomenon has led to sea level rise, alterations in circulation patterns and weather phenomena, as well as adverse effects on marine ecosystems. The remaining heat is apportioned to land (6%), ice (4%), and the atmosphere (1%).
The ocean is largest heat reservoir on the planet with a heat capacity 4 times greater than that of the atmosphere. For example, each kilogram (kg) of seawater must absorb 4x more heat than a kg of air to achieve a warming of 1°C. Since the mass of the ocean is also 300 times that of the atmosphere, the ocean can store about 1000 times more heat than the atmosphere.
Marine Heatwaves
In addition to the long-term warming of the ocean, we are also seeing an increase in the number of extremes such as surface marine heatwaves : events for which abnormally warm temperatures in the ocean are observed for at least 5 consecutive days. If we draw a parallel with the heatwaves on land, marine heat waves can be much longer (several weeks or even months), and they can cover huge areas of several million square kilometres. They do not only occur at the ocean surface, marine heatwaves can also occur at depth.
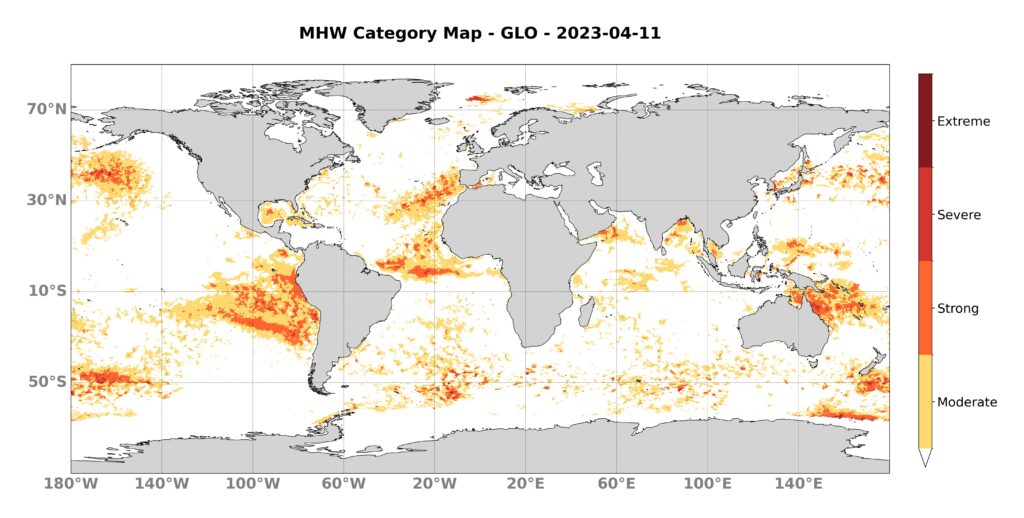
Using the Mercator Ocean global analysis system (GLO12) we see that many areas across the ocean are experiencing moderate to severe marine heatwaves such as the North Pacific and eastern South Pacific, the north Atlantic, and areas near New Zealand and Australia.
Decrease in air-sea CO2 fluxes caused by persistent marine heatwaves, is the name of a recent paper published in Nature and led by Mercator Ocean oceanographers, Alexandre Mignot and Karina von Schuckmann. It revealed that persistent marine heatwaves occur in key CO2 uptake and release areas and that intense and long-lasting MHWs have a strong impact on air-sea CO2 uptake and outgassing (read more here). While the tropics experience CO2 release, mid-latitude ocean CO2 uptake serves as a counterbalance; however, this process has been found to be influenced by marine heatwaves. Our understanding of persistent marine heatwaves and their impact on CO2-sensitive areas is limited, though the study sheds light on the interplay of extreme heat events and air-sea CO2 exchanges. Monitoring CO2 fluxes is essential as it is one of the underlying mechanisms that allows the ocean to act as a sink for excess atmospheric CO2, thereby mitigating global warming.
Why measure ocean temperature, especially at the surface?
In recent years, the world has witnessed unprecedented changes in climate patterns, and one of the most visible signs of these changes is the increasing ocean temperatures. The ocean has been consistently warming since the late 19th century, though in recent years this has accelerated in pace. This warming trend is alarming as it has significant consequences for marine ecosystems, weather patterns, and the global economy.
Sea surface temperatures are an essential indicator of the Earth’s changing climate, and they play a crucial role in shaping weather patterns, ocean currents, and the global water cycle. When the surface of the ocean warms, it affects the entire oceanic system, from the tiny plankton to the largest marine mammals. Rising temperatures cause marine organisms to migrate, disrupt the food chain, and promote the growth of harmful algae blooms. This in turn affects human systems and economies that rely on the healthy functioning of marine ecosystems. For example, human food security can be put a risk with grave implications for current conditions and for sustainable development in the coming years.
Tropical Cyclones
One potential consequences of rising ocean temperatures is that they can exacerbate extreme weather events. Warmer oceans provide more energy to tropical storms and tropical cyclones (also named hurricanes or typhoons depending on regions), making them more destructive. In 2020, the Atlantic hurricane season was one of the most active on record, with a total of 30 named storms, 14 of which were tropical cyclones. The combination of high sea surface temperatures and other factors like low wind shear contributed to the record-breaking season. Tropical cyclone season takes place in the summer and early fall with the most activity around mid-August to mid-October, driven by the heightened sea surface temperatures accumulated over the hot spring and summer months.
Sea surface temperature measurements are used for weather and ocean forecasting as they drive exchanges of heat and water between the ocean and the atmosphere. These heat and moisture exchanges are key for the climate and strongly affect weather patterns. With rising temperatures, there is more evaporation and thus more water vapour in the atmosphere and therefore there is more potential for intense rainfall. A warming atmosphere can also contain more water vapor (about 7% per 1°C of warming).
Precision and Forecasts
Today’s satellite sensors and in situ observation networks allow us to monitor the daily surface temperature with good precision, with an uncertainty on daily local values of less than 0.5°C in most areas of the ocean. There are fluctuations in the number of valid observations received day to day (which can differ in quality based on cloud interactions, location of satellites tracks etc.) and gaps appear in the spatial coverage for which the location varies from day to day. To produce gap-free global maps various technical choices have been made, which explains why daily maps produced using different methods can bring slightly different global average results (by a tenth of a degree).
Despite these slight differences, which show how little the uncertainty is, all sea surface temperature estimates agree that the ocean is warming rapidly and more intensely with multiple records being set in the last decade. In 2023, all products confirm that the current global temperature is above past records.
In situ and satellite observations are combined in order to produce gap-free sea surface observation datasets. They are also ingested in numerical ocean models which are digital twins of the real ocean, from the surface to the abyss. This better constrains the models and makes them as reliable and realistic as possible and allows them to provide forecasts of about ten days into the future. In situ data and numerical models show that it is not only the surface ocean that is warming, but also the depths, including down to 2000 metres and more. Mercator Ocean International produces a variety of such models, including on a global and regional scale covering physical and biogeochemical variables as well as sea ice.
Important links
- Ocean Warming: Explainer
- Marine Heatwaves: Explainer
- Ocean State Reports, an annual state-of-the-art scientific publication and summary for policy makers. Led by Mercator Ocean for the Copernicus Marine Service
- Heat stored in the Earth system 1960–2020: where does the energy go? von Schuckmann, K. et al. Earth Syst. Sci. Data, 15, 1675–1709
- Another Year of Record Heat for the Oceans Cheng, L., Abraham, J., Trenberth, K.E. von Schuckmann, K. et al.. Adv. Atmos. Sci. (2023).
- Decrease in air-sea CO2 fluxes caused by persistent marine heatwaves Mignot, A., von Schuckmann, K., Landschützer, P. et al. Nat Commun 13, 4300 (2022).
Under regular circumstances in the Pacific Ocean, the equatorial trade winds move towards the west, carrying warm water from South America to Asia. This results in cold water ascending from the ocean depths, known as upwelling, to replenish the displaced warm water. The El Niño-Southern Oscillation (ENSO) cycle, comprising of El Niño and La Niña, are opposing weather patterns that disrupt this norm. Across the globe, El Niño and La Niña have impacts on ecosystems, weather, economies, and even wildfires. Though the cycles can last for several years, it usually ranges from nine to 12 months in duration. These events occur irregularly, with an average frequency of every two to seven years, although El Niño occurs more frequently than La Niña.
IPCC Sixth Assessment Report (AR6 WG1), chapter 7, pg 938
The Earth Energy Imbalance (EEI) is the difference between the amount of energy from the sun arriving in the Earth system and the amount returning to space. The current positive values for EEI indicate a warming planet. As the vast majority of surplus heat energy caused by human activities trapped in the Earth system is absorbed by the ocean, understanding ocean warming is key to assessing and tackling global warming on the whole.
https://www.noaa.gov/media-release/record-breaking-atlantic-hurricane-season-draws-to-end
Skliris, N., Zika, J., Nurser, G. et al. Global water cycle amplifying at less than the Clausius-Clapeyron rate. Sci Rep 6, 38752 (2016). https://doi.org/10.1038/srep38752