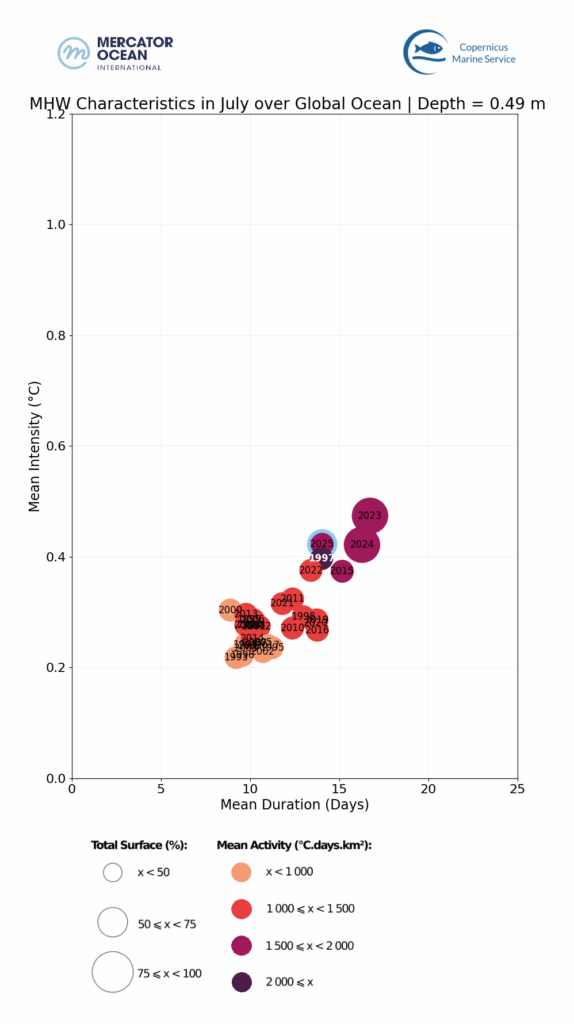
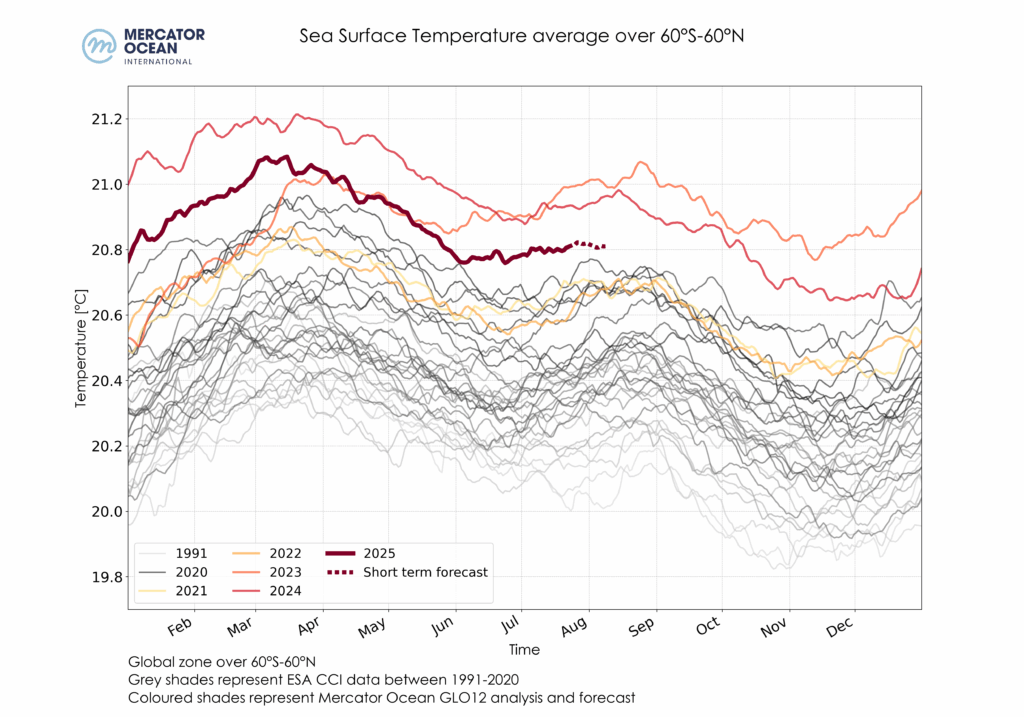
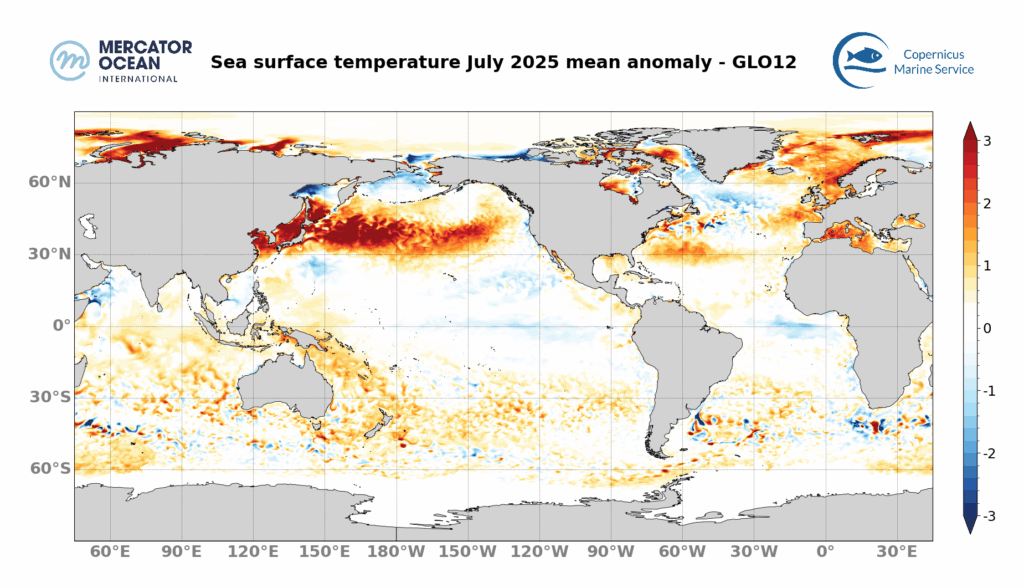
In the global Ocean, July 2025 was the 3rd warmest July on record, with a mean Sea Surface Temperature (SST) of 20.80 ± 0.07 °C — behind only 2024 (20.91 ± 0.06 °C) and 2023 (20.93 ± 0.06 °C).
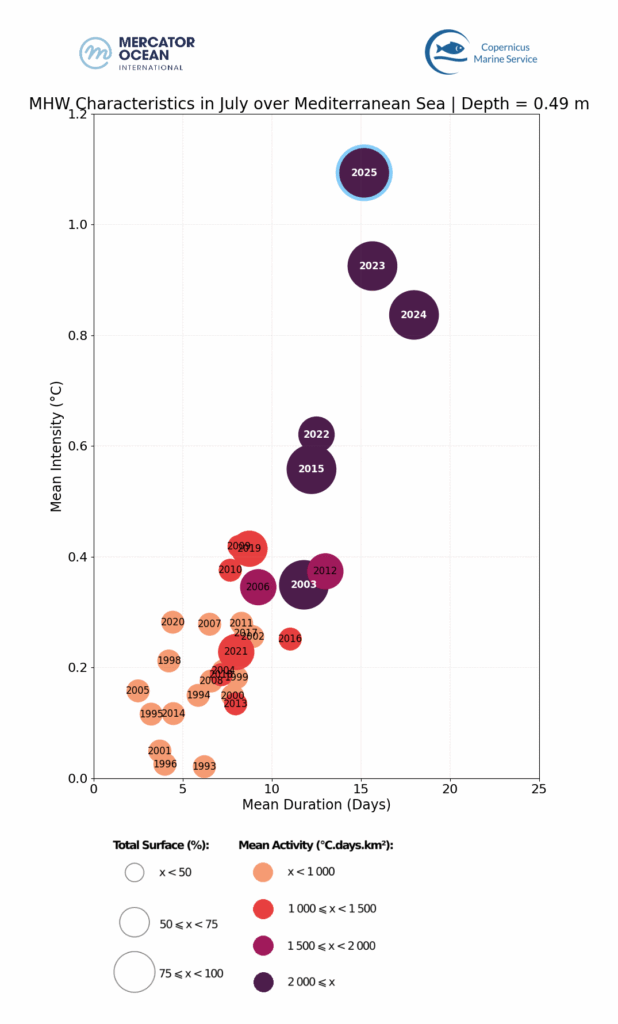
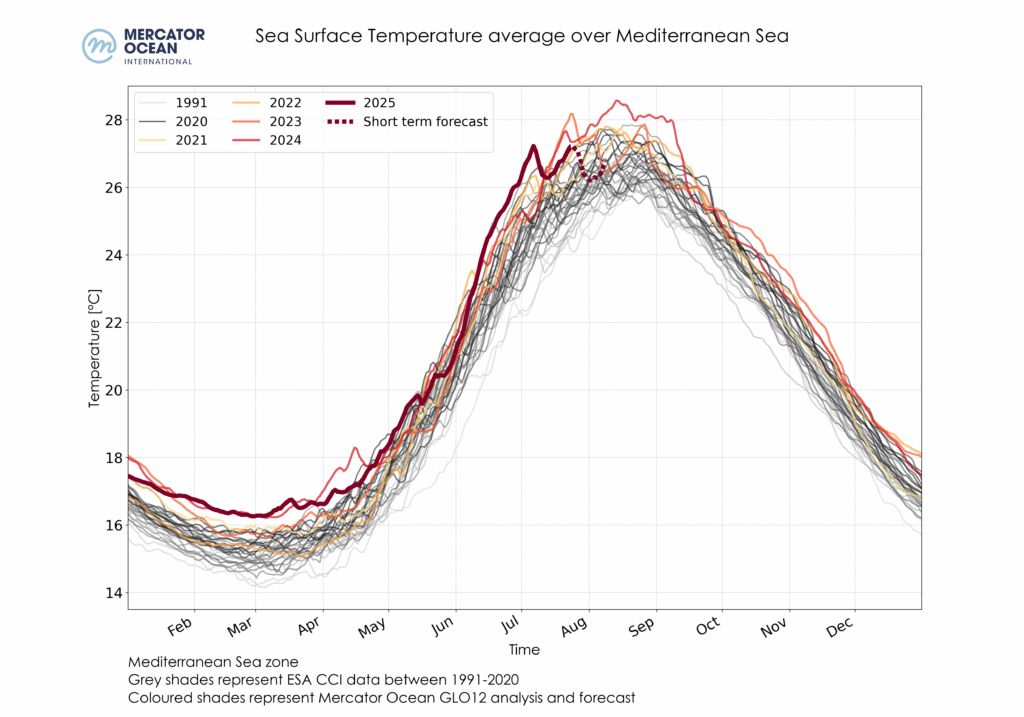
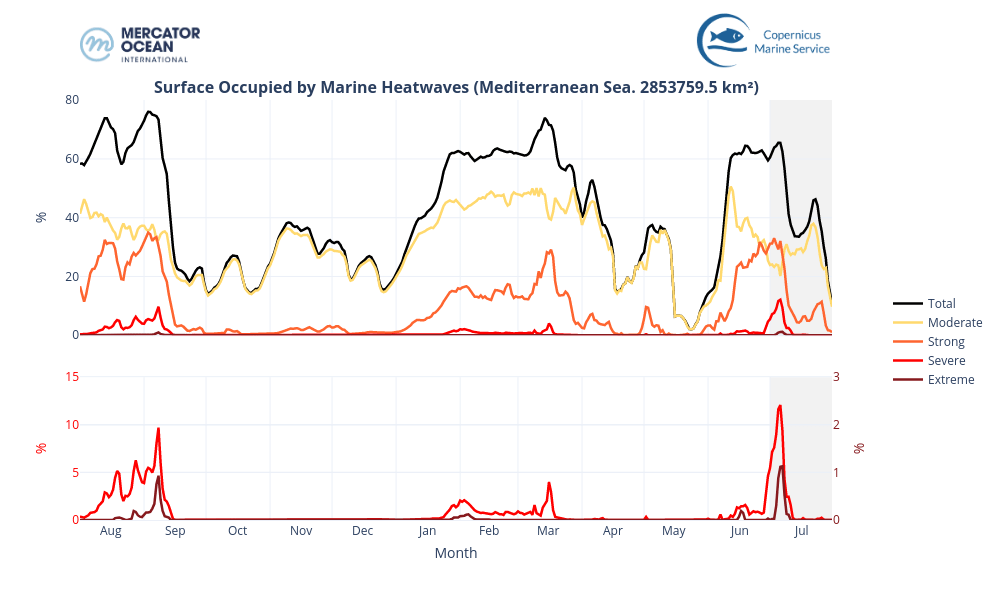
For the Mediterranean Sea, July 2025 was the warmest July on records with a mean SST of 26.68 ± 0.15°C, surpassing the 2023 record of 26.65 ± 0.21°C.
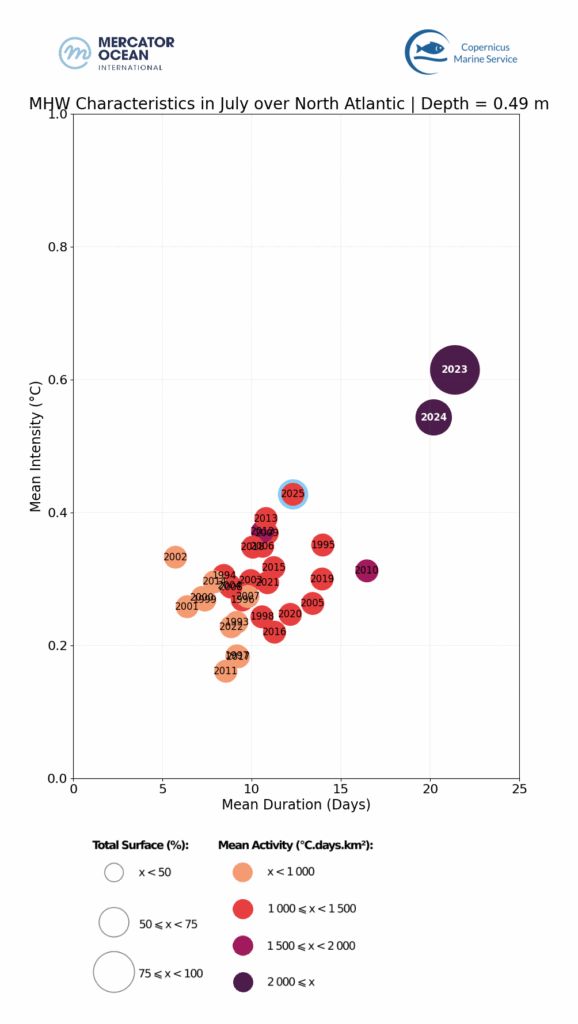
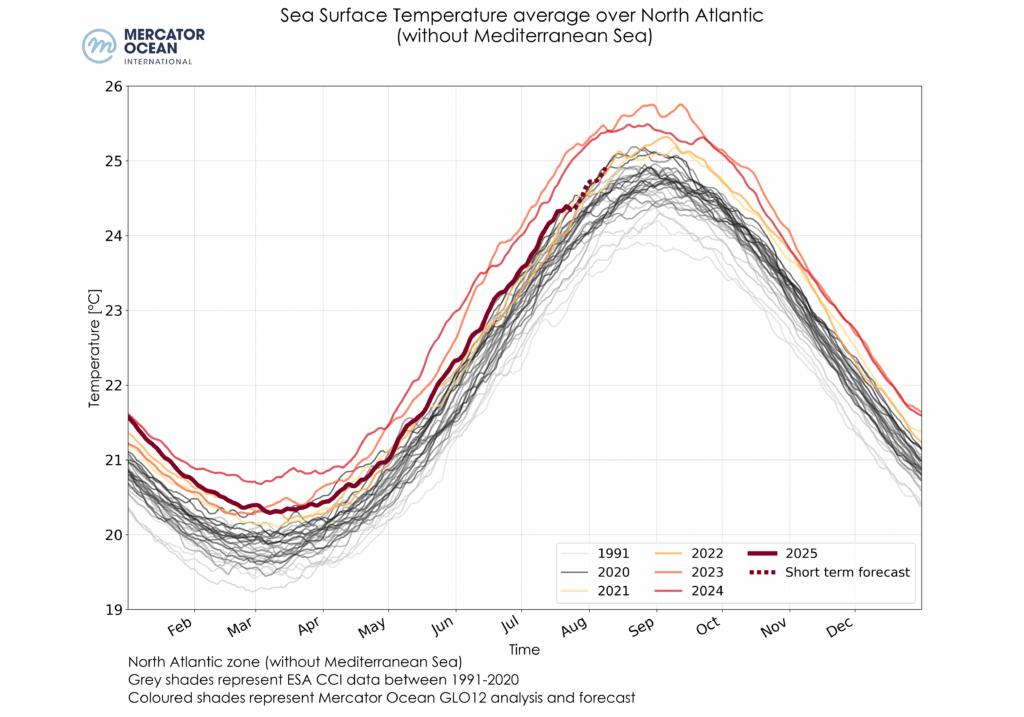
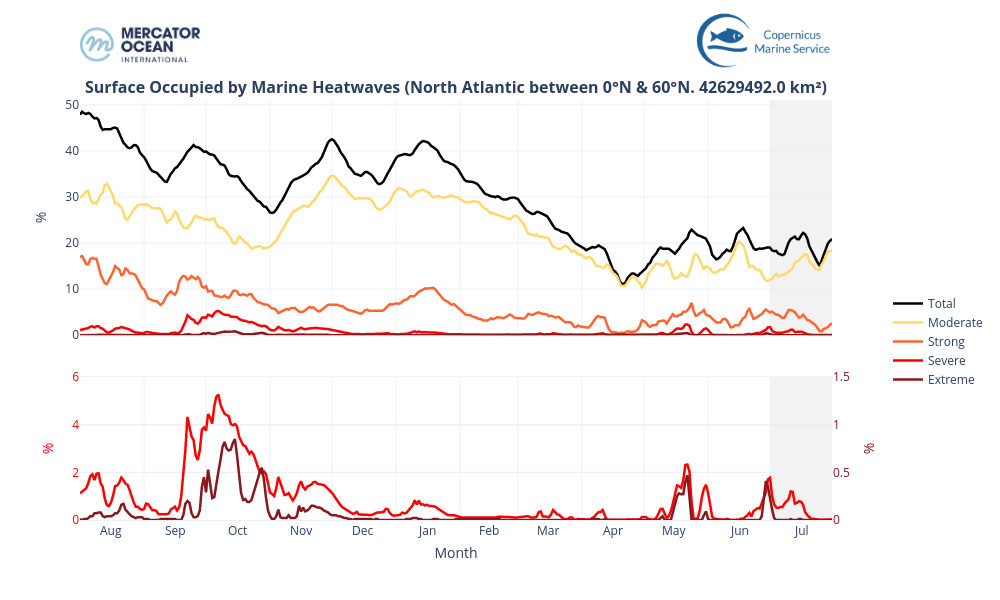
For North Atlantic, July 2025 was the 4th warmest July month with a mean SST of 24.11 ± 0.12 °C (ranking after 2020, 2024 and 2023).
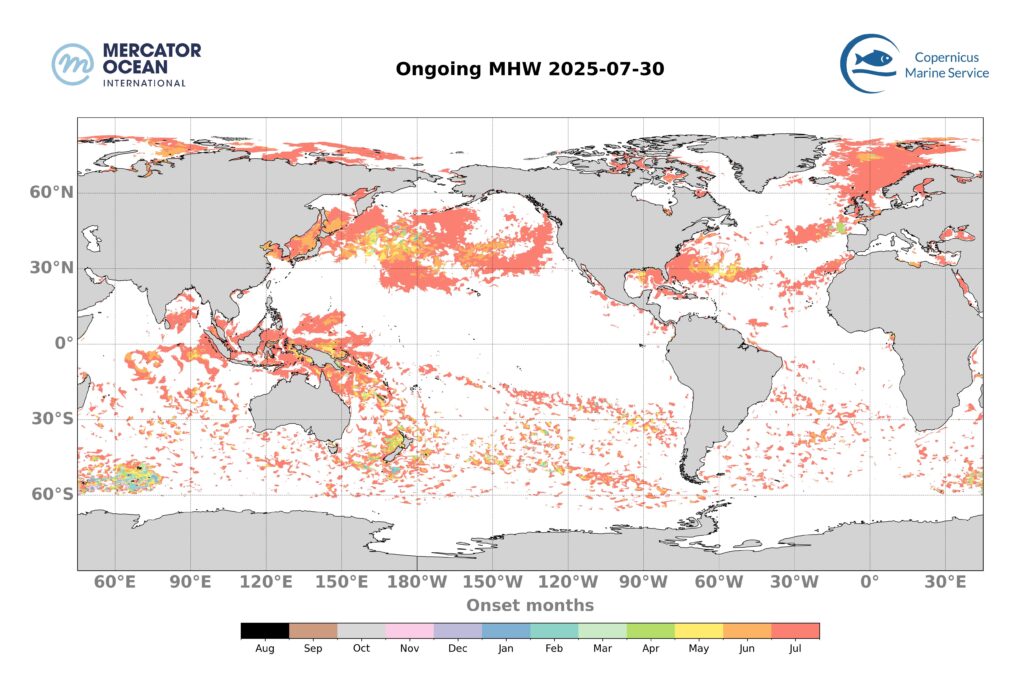
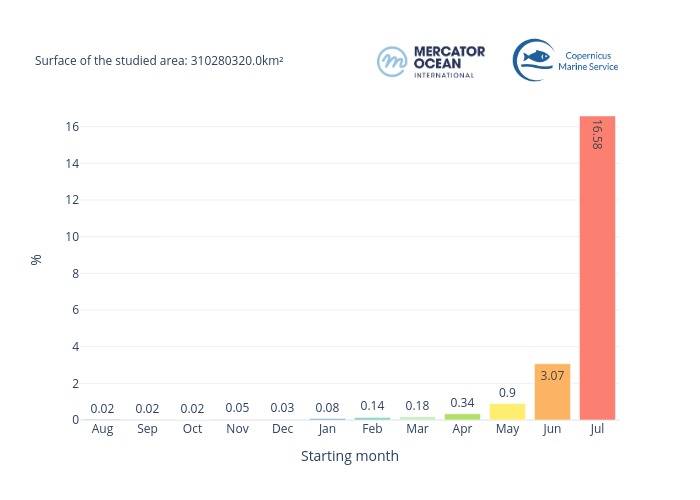
The duration of ongoing MHWs is monitored because prolonged events may induce important stress on marine ecosystems.
Ongoing Marine Heatwaves on July 31, 2025 :
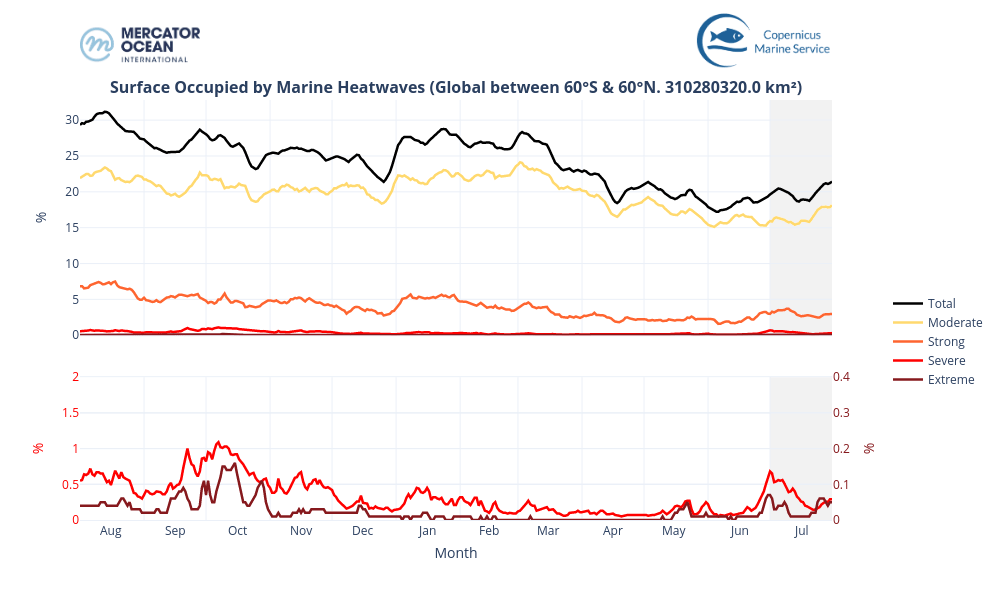
MHWs are classified into four categories: Moderate, Strong, Severe, and Extreme. We monitor daily the surface occupied by MHWs and show for the past year (since August 2024) the proportion of the global Ocean (between 60°S and 60°N) exposed to MHWs. We focus on the evolution over the past July 2025 (grey bar).
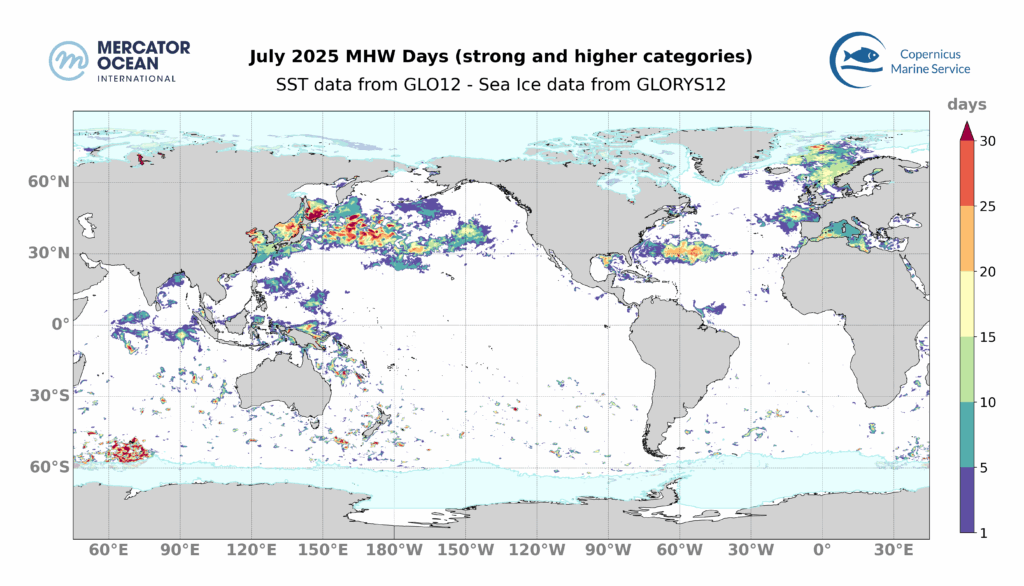
We monitor the number of MHW days to highlight the region often impacted or impacted by long MHW. Longer and more regular MHWs increase heat stress on marine ecosystems, especially intense MHW (i.e. MHW of strong or higher category). Here we look at the total number of days where a MHW of strong or higher category occurred during July 2025. For instance, ocean regions in light green correspond to areas where a total of 10 to 15 days of strong or higher MHW were observed during the month of July of 2025.
The MHW statistics (MHW duration, intensity, surface occupied and activity) for July 2025 are compared to those for July months from previous years (since 1993).