Ocean Temperature Bulletin
February 2026

Mercator Ocean International (MOi) oceanographers examine marine heatwaves across the global ocean. They analyse a variety of datasets from observation analyses
(satellite sea surface temperature maps) to model analyses
(assimilating satellite and in situ observations) and model forecasts.¹

All images in this article can be used freely and should be credited with the following information :
Image source: European Union, Copernicus Marine Service Data 2025 © Mercator Ocean .

Key takeaway

  • February 2026 was the 3rd warmest February for the global ocean and for the Mediterranean Sea
  • It was the 8th warmest February for the North Atlantic.
  • 97% of the Mediterranean Sea experienced above average sea surface temperature (SST).
  • Marine heatwaves events in February 2026 were the 5th most extreme (duration, intensity, surface and activity) globally, the 4th most extreme in the Mediterranean Sea and the 3th most extreme in terms of the duration of the events in the North Atlantic.

sea Surface Temperature


Daily sea surface temperatures averaged for the global ocean (top), the Mediterranean Sea (middle) and the North Atlantic Ocean (right) between 1991-2020 using ESA’s Climate Change Initiative (grey shades), and between 2021-2026 (colored shades) using Mercator Ocean International’s GLO12 analysis and forecast.


  • February 2026, for the global ocean (between 60°S and 60°N), was the 3rd warmest February on record, with a mean Sea Surface Temperature (SST) of 20.93 ± 0.06°C — behind 2025 (20.95 ± 0.08 °C) and 2024 (21.11 ± 0.07 °C).
  • In the Mediterranean Sea, February 2025 was the 3rd warmest February month, with a mean SST of 16.17 ± 0.05°C, ranking behind 2024 (16.32 ± 0.21°C) and 2025 (16.41 ± 0.12°C).
  • In the North Atlantic (between 0°N and 60°N), February 2025 was the 8th warmest February of the past 34 years, with a mean SST of 20.25 ± 0.15°C. The record of 2024 reached 20.78 ± 0.10°C.

Sea surface temperature anomalies

February 2026 Mean SST Anomaly relative to a 30-year climatology (1993-2022), calculated using daily data from Mercator Ocean International’s GLO12 analysis and forecasting system for 2026 and from the GLORYS12 reanalysis for the climatological mean.

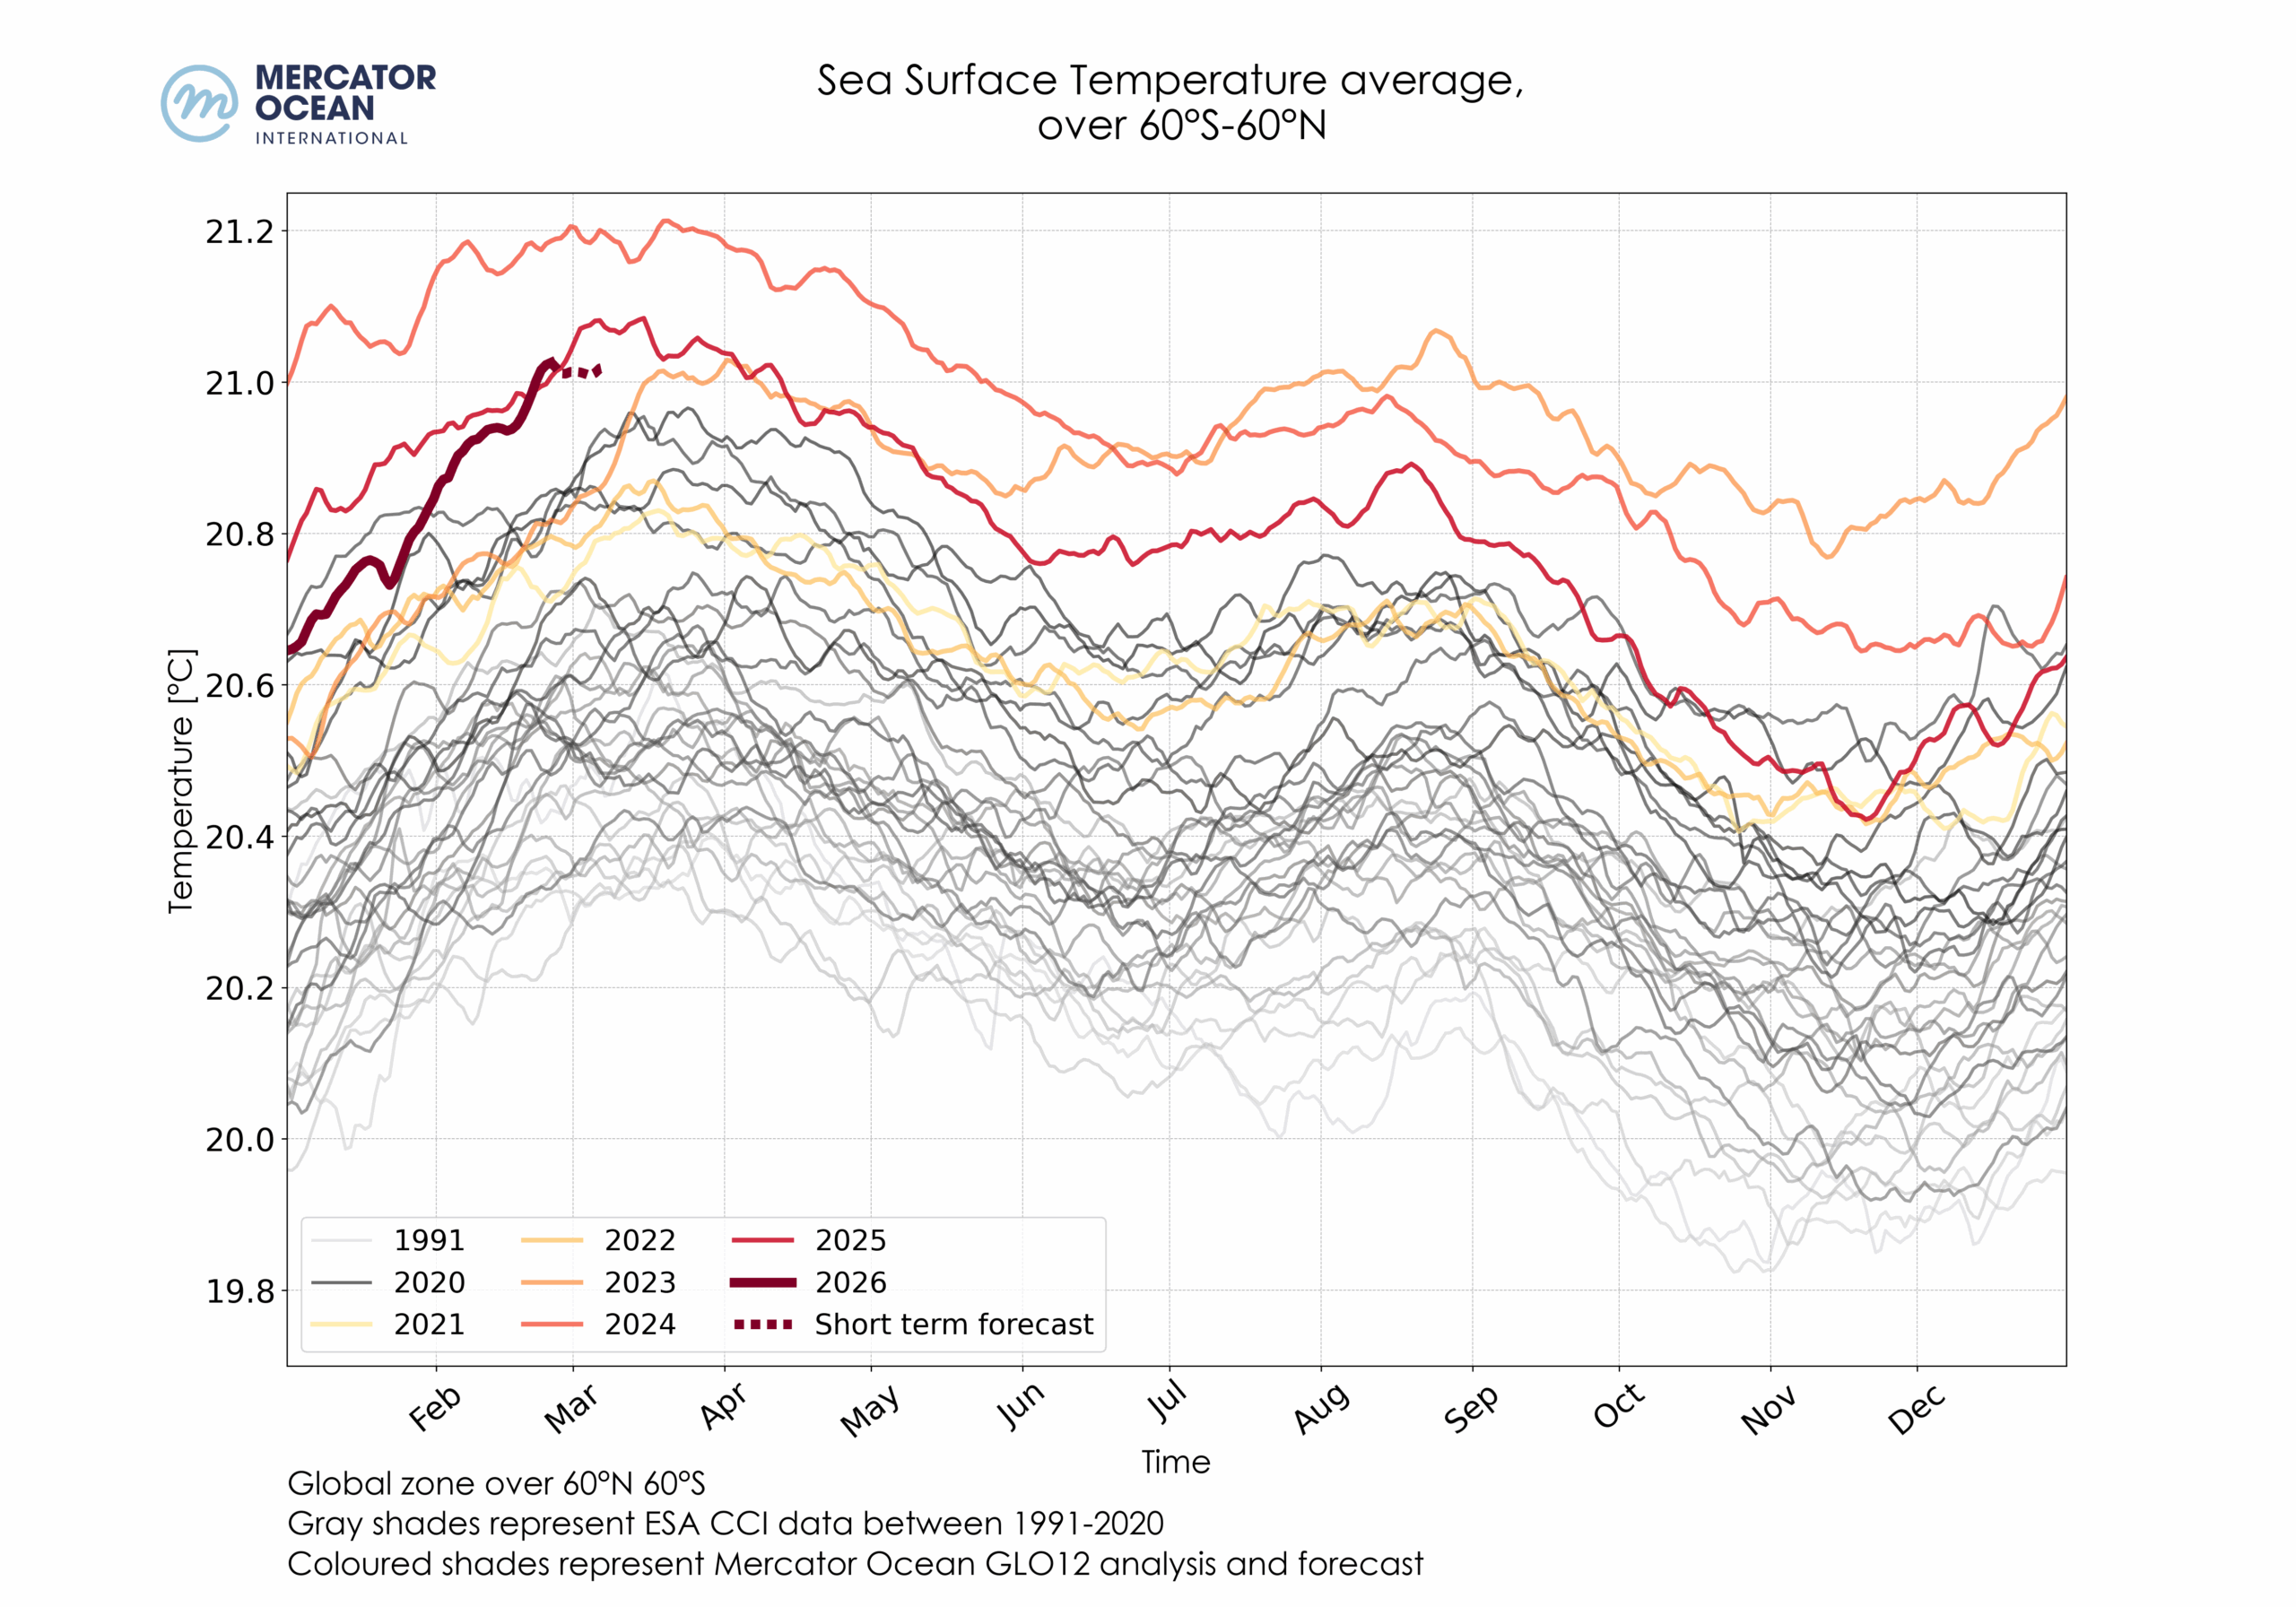
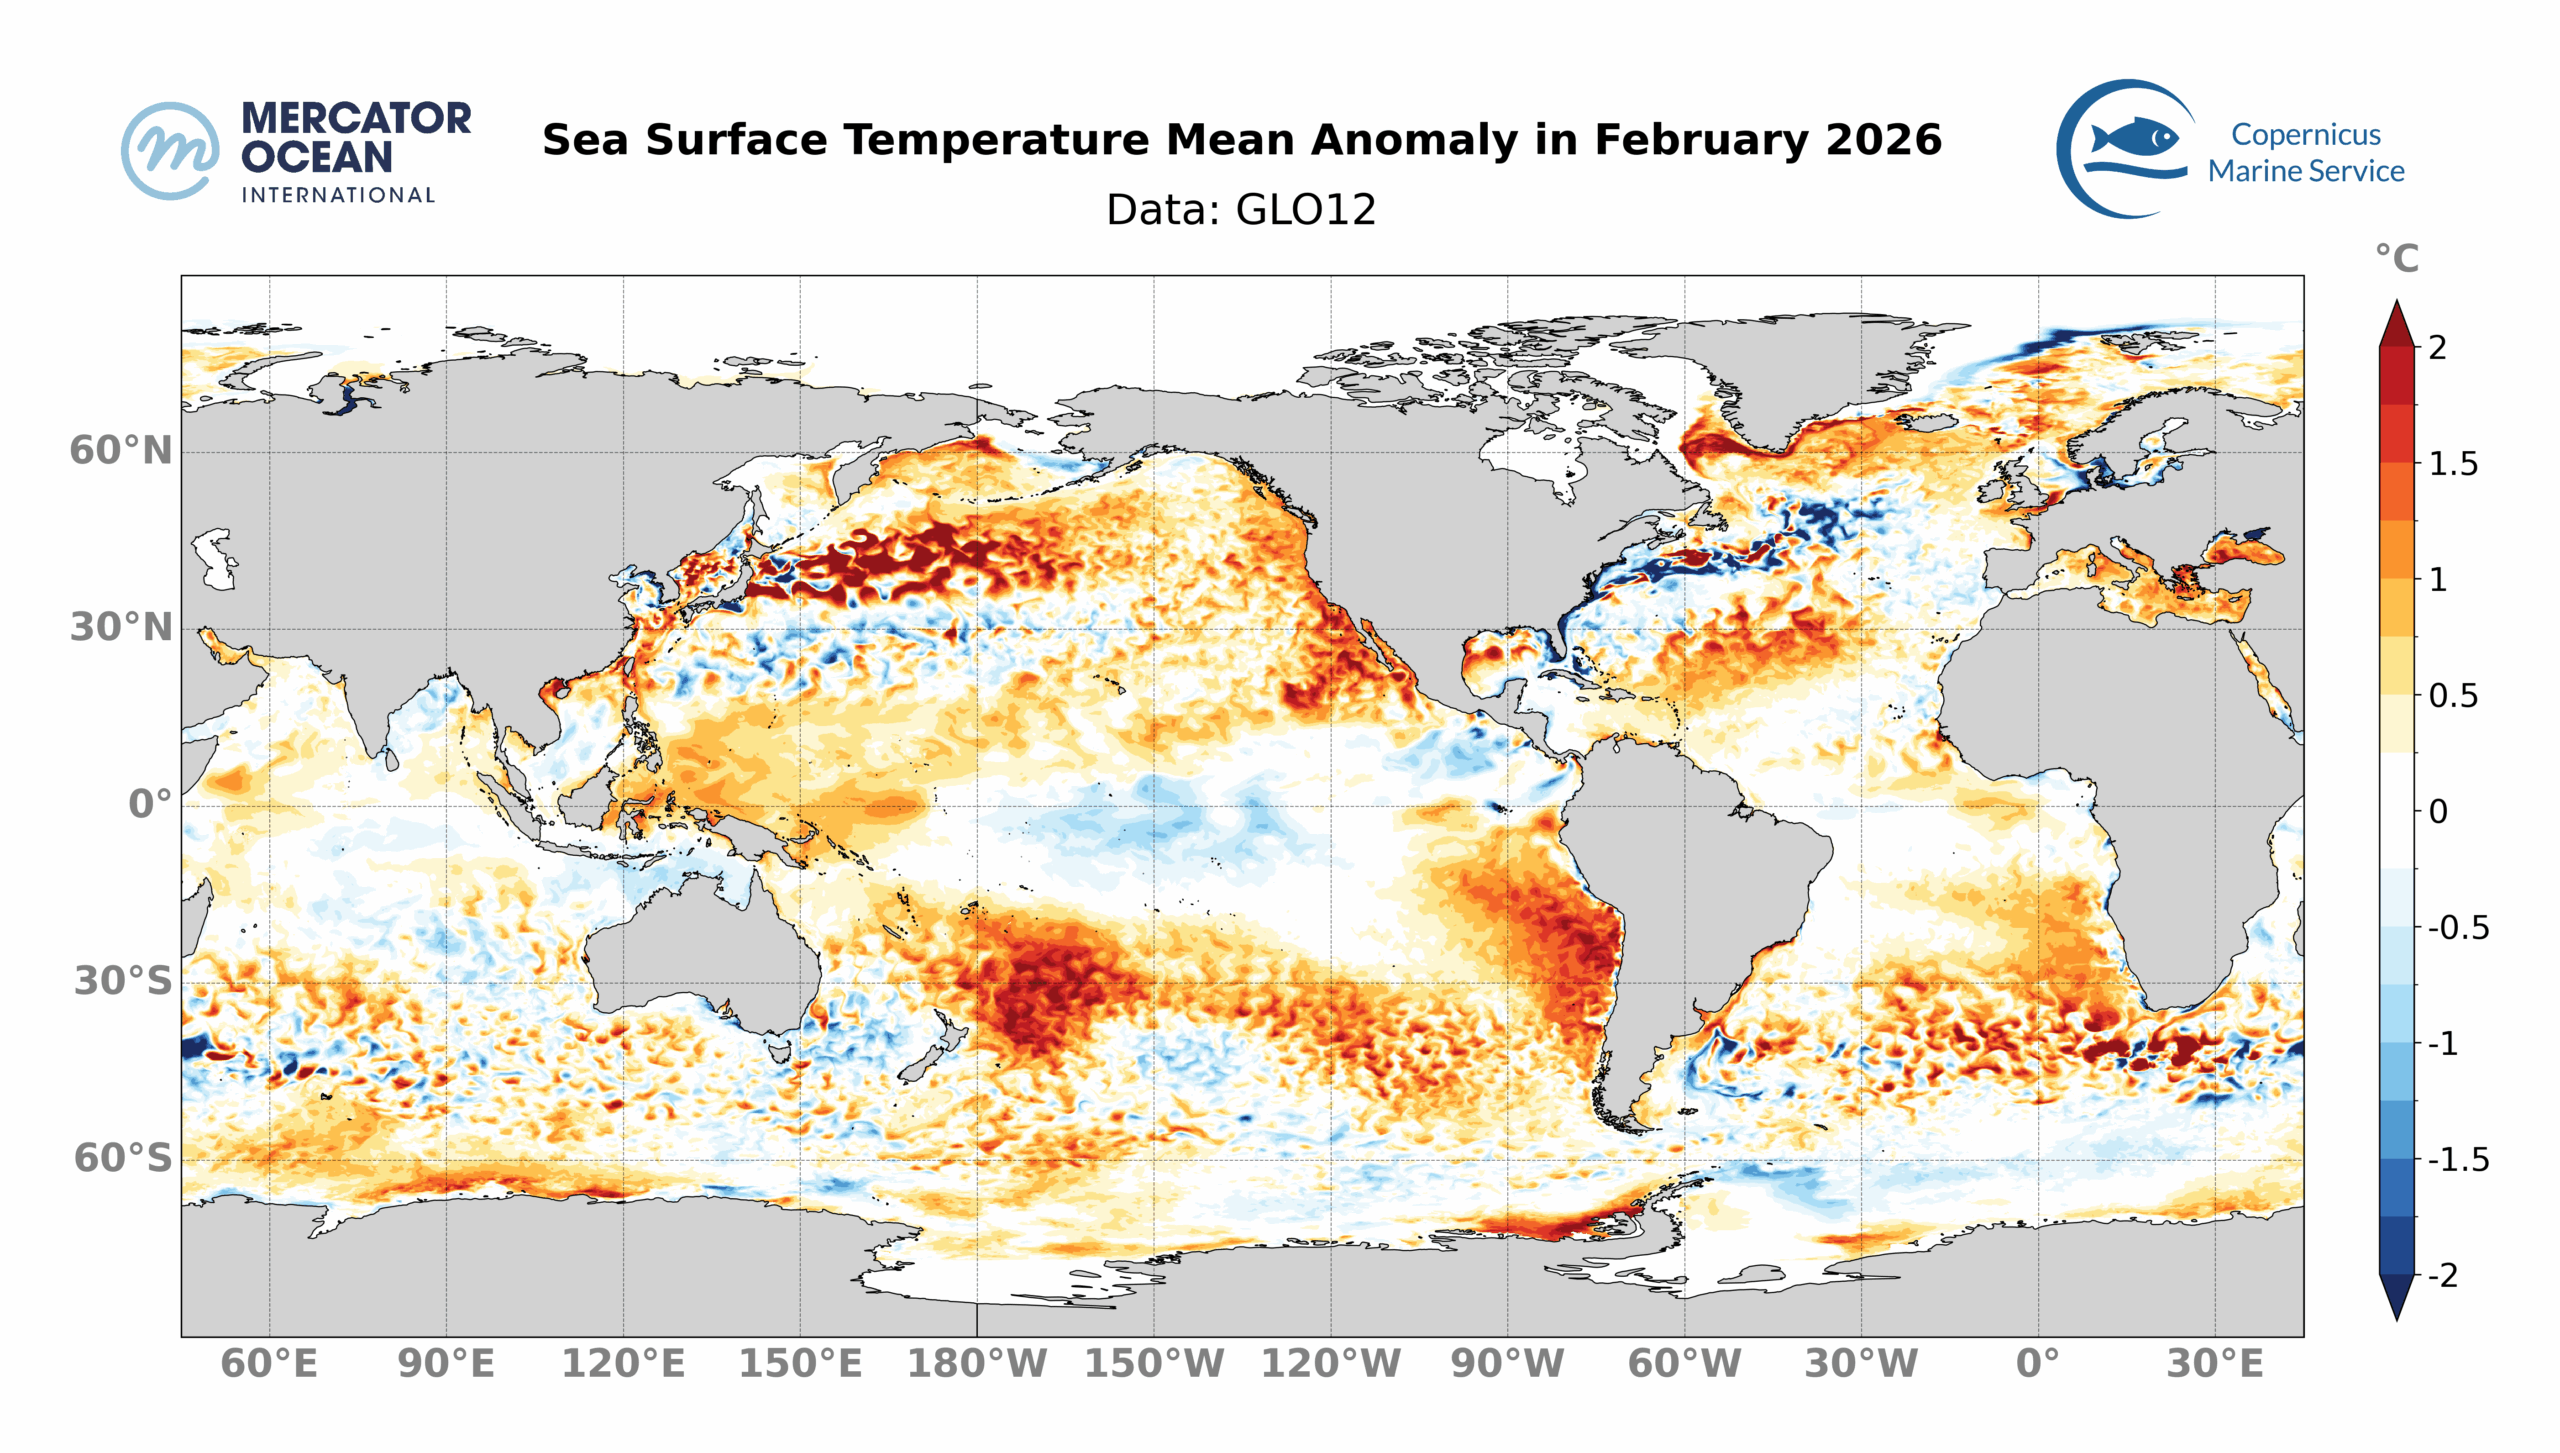
February 2026 mean SSTs are above average for 71% of the global ocean (between 60°S and 60°N), with 12% exceeding the average by at least 1°C (Figure 2).

  • Almost the entire Mediterranean Sea (97%) showed above-average SSTs, with 26% of the basin reaching at least 1°C above average, mainly in the eastern part.
  • The North Pacific Ocean showed widespread high SSTs at midlatitude spanning the entire width of the basin and reaching 3°C above average in the western part. Above-average SSTs were also observed in the South Pacific, particularly northeast of New Zealand. and off the west coast of South America, reaching more than 2°C above average. These two hot spots are separated by a band of positive anomalies, between 150°W and 90°W, which exceeds 1.5°C locally. The equatorial region is characterized by below average SSTs, around -1°C. These anomalies are lower than for the previous month, showing a weakening of the La Niña event potentially a transition to a neutral state.
  • The North Atlantic recorded above-average SSTs over 68% of its area (between 0°N and 60°N), mainly in the subtropical part of the basin, with anomalies reaching more than 1.5°C. Northeastern Europe is also experiencing anomalies exceeding 1°C locally. In the South Atlantic, between 15°S and 50°S, SSTs exceeded 2°C above average, mainly off the coast of South Africa.
  • Widespread above average SSTs are observed in the Southern Ocean, between 30°E and 120°E, reaching up to 1.5°C locally.

Ranking February 2026 

Ranking of average monthly SSTs reached in February 2026, calculated using daily data from Mercator Ocean International’s GLO12 analysis and forecasting system for 2026 and from the GLORYS12 reanalysis for the climatological mean. The colours indicate the rank of February 2026 among all months of February since 1993.  

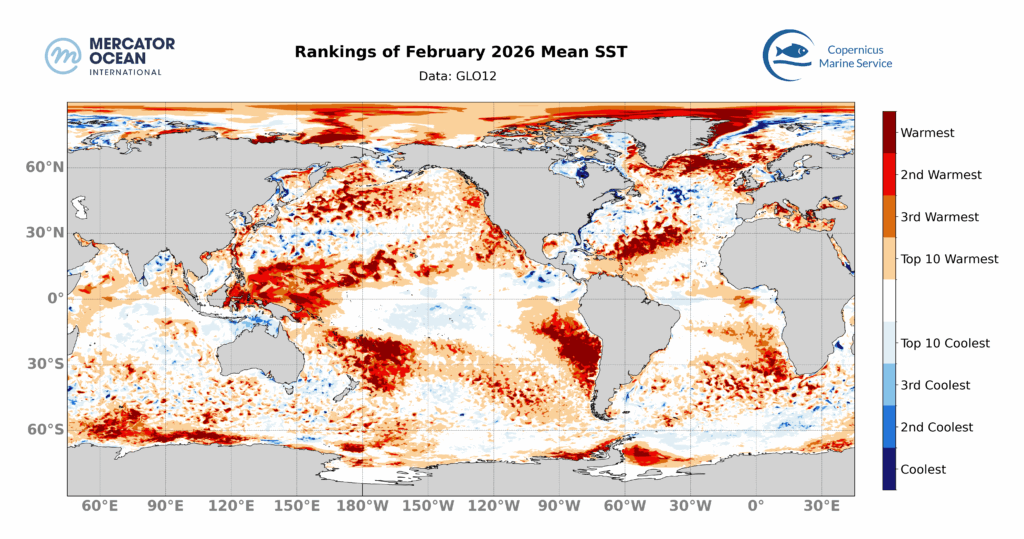
The ranking of average monthly SSTs is monitored so to contextualise the current situation relative to previous Februarys. This ranking is based on February monthly averages from 1993 to 2026. Here, we look at the ranking of February 2026 among all months of February since 1993.

  • Around 5% of the global ocean (between 60°S and 60°N) ranked as the warmest February month on record, 20% of the ocean is within the 4 warmest (not shown).
  • n the Mediterranean Sea, many regions were exposed to surface mean temperatures within the 10 warmest months of February, reaching warmest or second warmest locally.
  • In the North Atlantic, SSTs reached record levels in northern Europe and in the subtropical region, from the Caribbean to the middle of the basin.
  • In the North Pacific, most of the basin is experiencing one of the ten warmest months of February on record. At a smaller scale, February 2026 SSTs are approaching or reaching record levels, particularly between 30°N and 60°N, and off the coast of the Philippines.
  • In the South Pacific, large regions off the coast of Chili and Peru and northeast of New Zealand  saw record February SSTs mean temperatures.
  • The Southern Ocean also reached SST records for the month of February, particularly between 60°E and 120°E.


Ongoing Marine Heatwaves

Month of onset for the ongoing MHWs on the 28th February 2026. The colours indicate the month during which the MHW started. For instance, ocean pixels in red correspond to an MHW that developed during February 2026 and are less than one month old, in orange MHW between 1 and 2 months old, etc.
  • On the 28th of February, 21% of the global ocean (between 60°S and 60°N) was affected by MHWs.
  • The majority of these MHWs developed recently, with 15% of the global Ocean (between 60°S and 60°N) affected by MHWs less than 1 month old and 6% by events between 1- and 2-month-old.
  • Widespread and persistent MHWs are found in the North Atlantic south of Iceland and in the subtropical region, off Chile coast and in the Southern Ocean around 60°E.


Total Surface Marine Heatwaves

Global Ocean


Surface occupied by MHWs in the global ocean (between 60°S and 60°N) between March 2025 and February 2026 based on daily monitoring. The black solid line represents the total surface of MHW, while the colored lines represent the surface of each MHW category. The gray background highlights the month of February 2026.


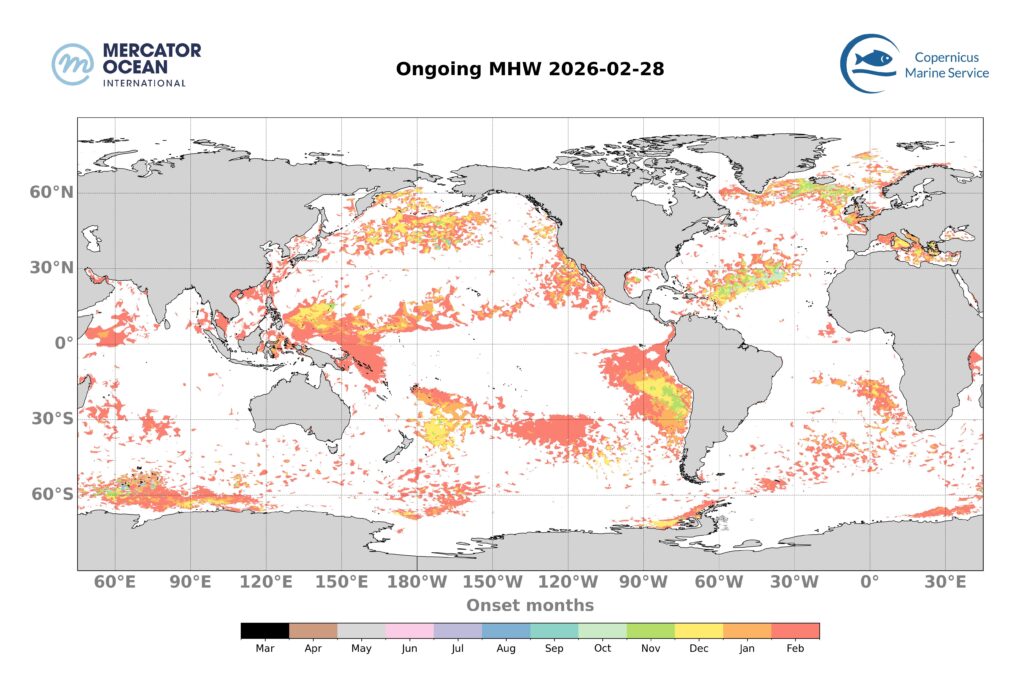
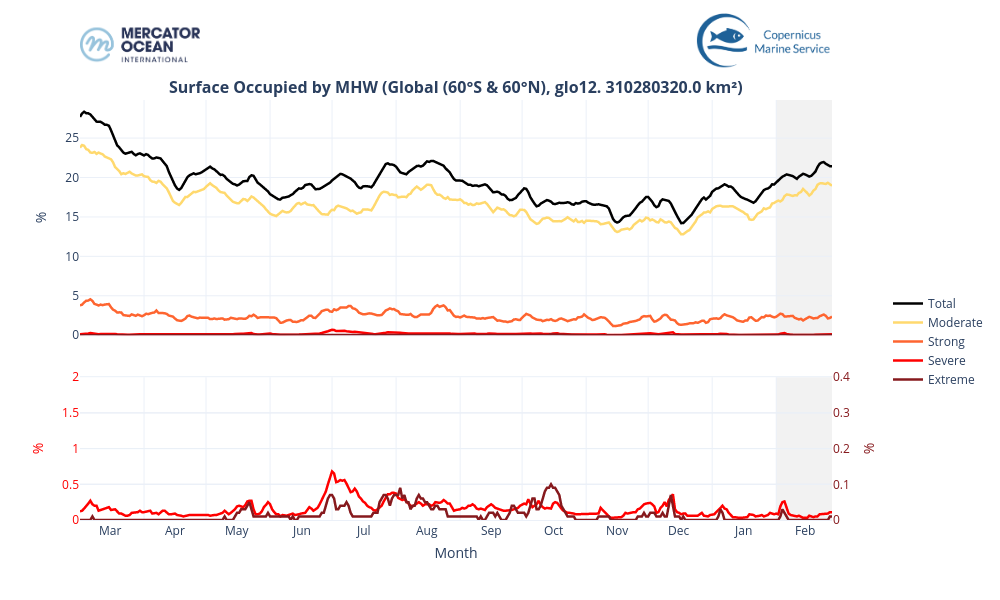
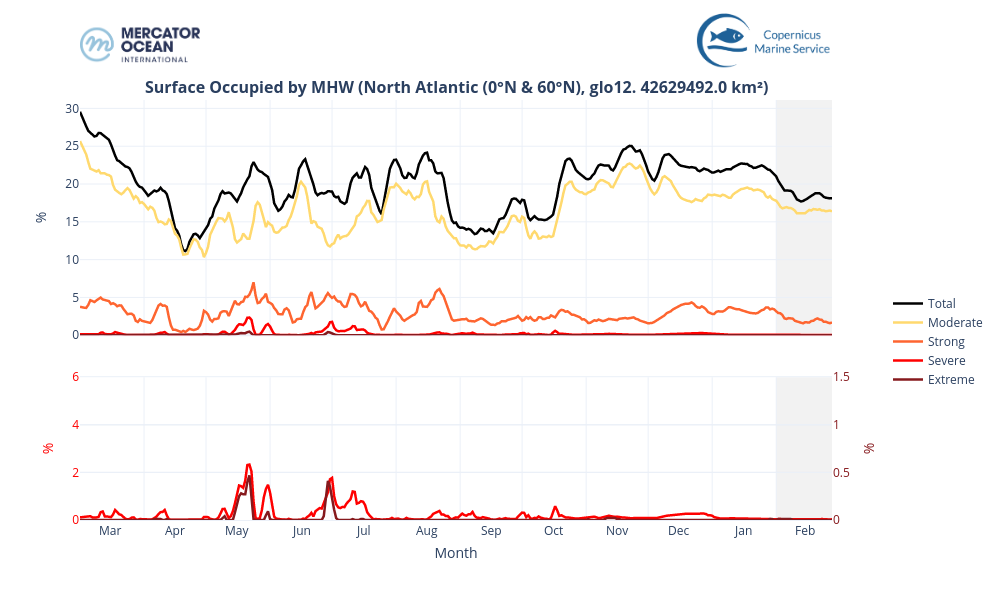
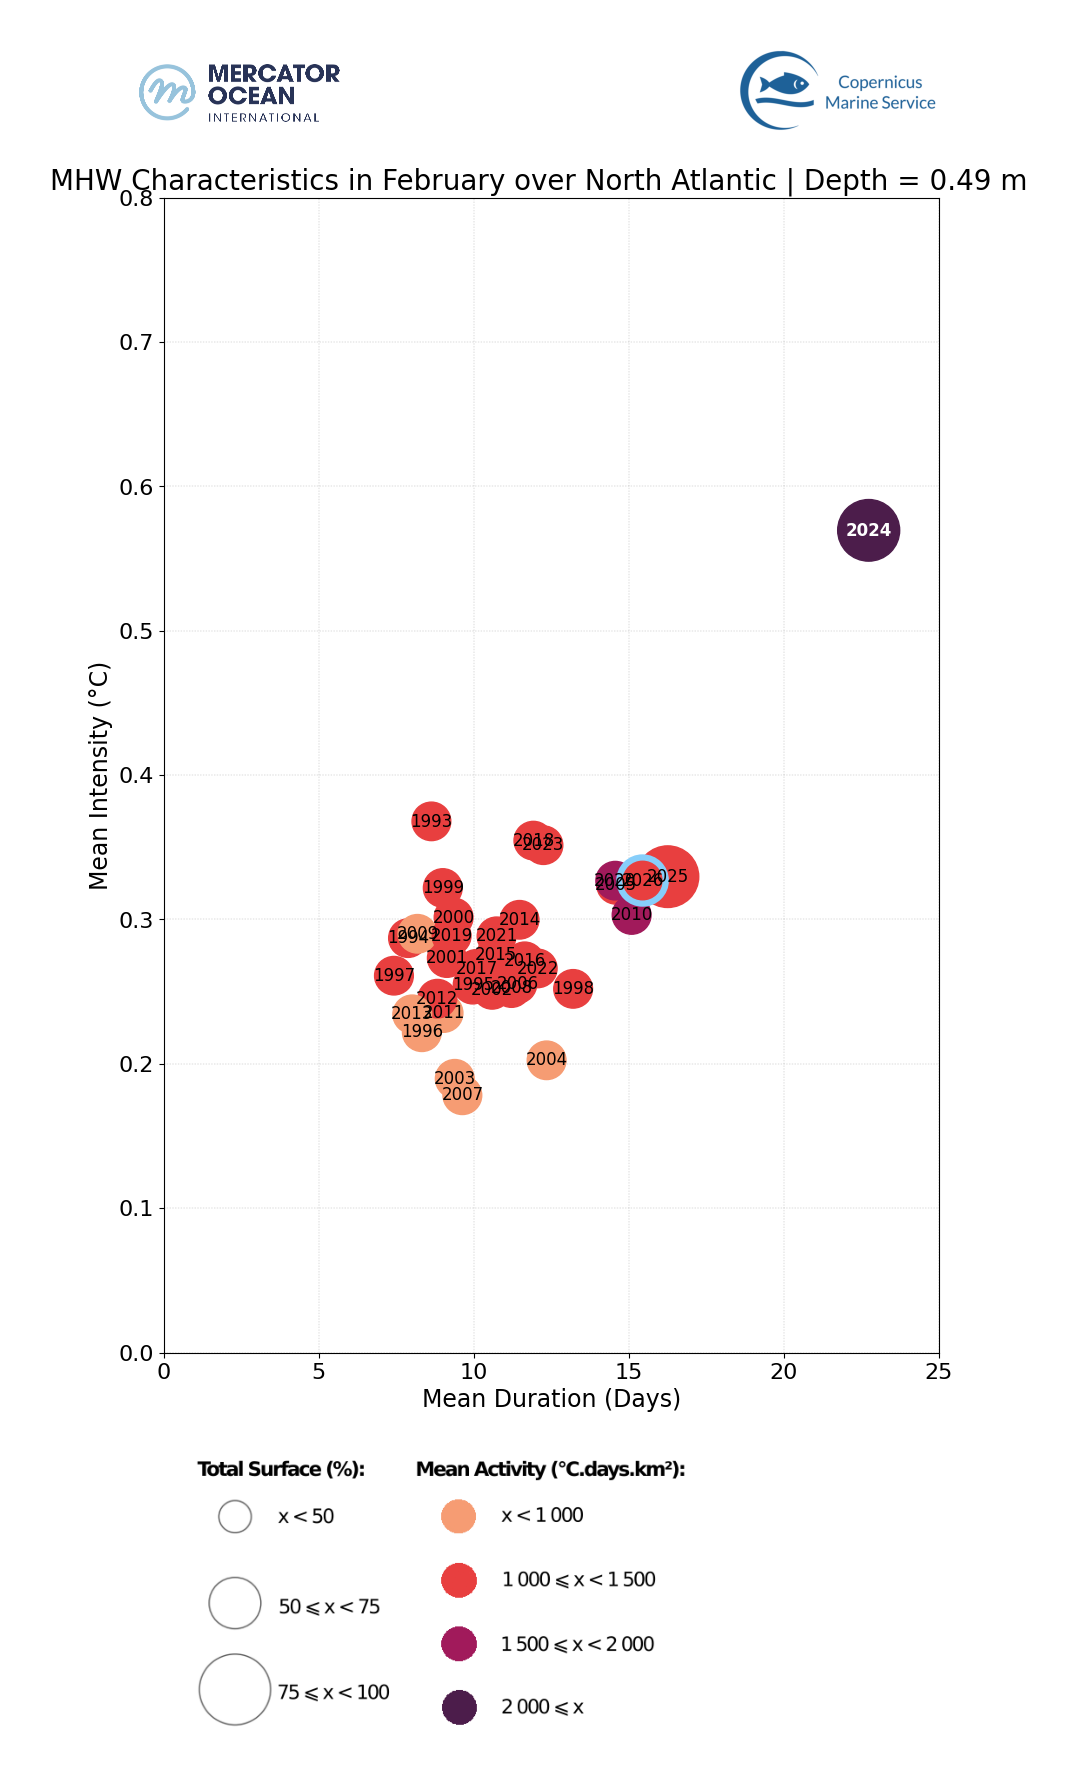
In February 2026, the total surface area of MHW (black line) increased from 18% to 21% of the global ocean (between 60°S and 60°N). The majority of MHWs events were moderate categories (from 16% to 19% of the global ocean) and, to a lesser extent, strong categories (~2% of the global ocean).


Mediterranean Sea


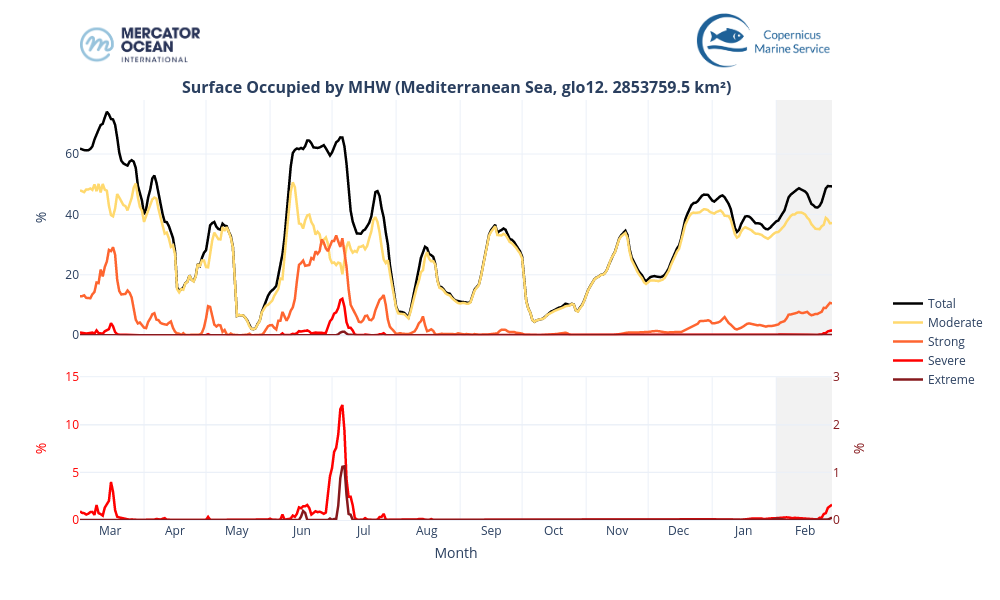
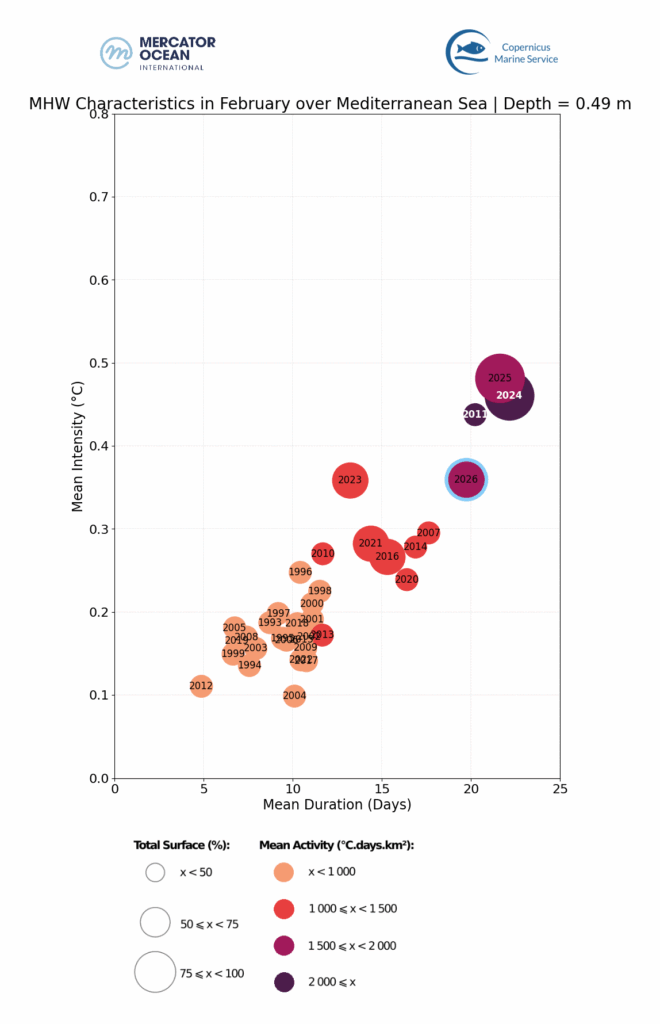
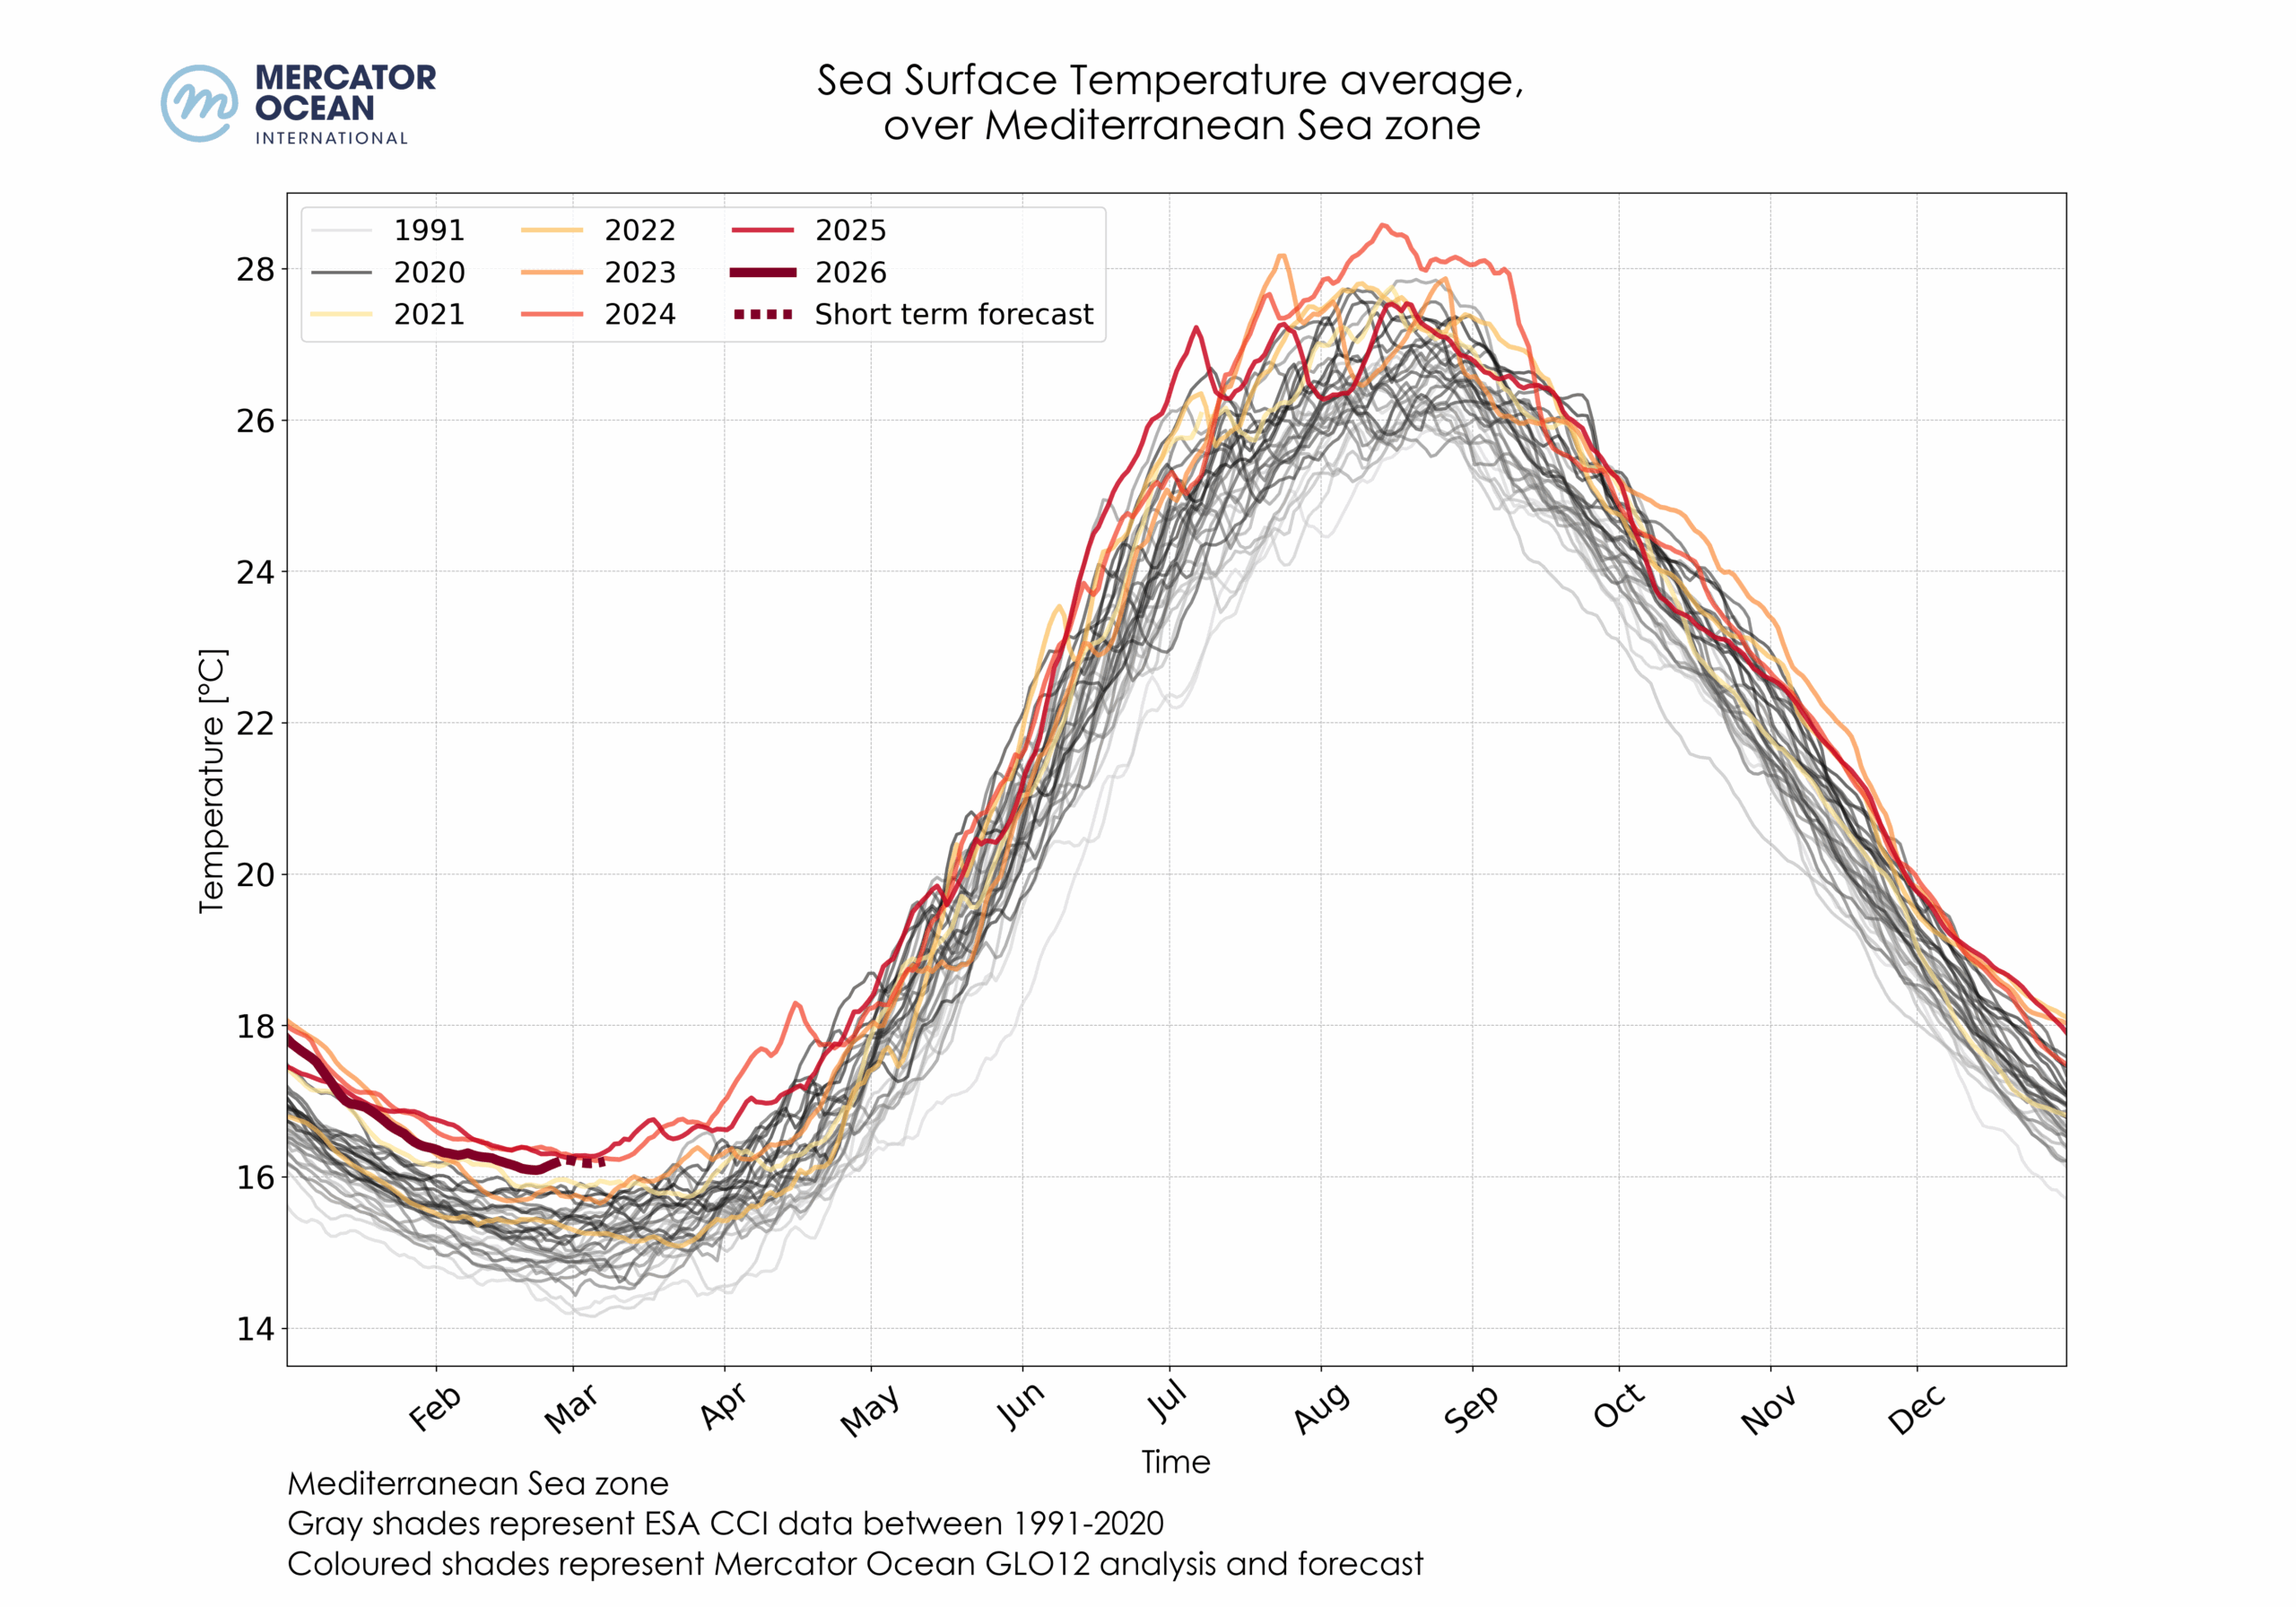
For the Mediterranean Sea, the total MHW extent fluctuated during  February 2026 but increased an overall from 38% to 50% of the basin. These MHW were mainly moderate in category, with a noteworthy increase of strong events from 4% to 10%. For comparison, in 2025, the total surface area of MHW remained around 62% during the month of February (not shown).

North Atlantic


Total Number Marine Heatwaves

  • 10% of the surface of the ocean was impacted by strong-or-higher MHW conditions for at least 1 day during February 2026. This is the 5th widest extent of the last 34 years, after 1998, 2016, 2025 and 2024 (28%). The South Pacific off the coast of Chile, northeast New Zealand and the northwest Pacific (around 45°N) are strongly affected (Figure 7), with intense MHWs lasting more than half of the month.
  • Regionally, 8% of the North Atlantic (between 0°N and 60°N) was impacted by strong, or higher, MHW conditions for at least 1 day. This corresponds to the 6th largest extent for a February month – behind 1998, 2020, 2010, 2025 and 2024 (42%). Noteworthy, 4% of the region was affected by intense MHW conditions (strong or higher) for more than 10 days, mainly in the subtropical part of the basin and north of Great Britain.
  • For the Mediterranean Sea, 20% of the basin was affected by strong-or-higher MHW conditions for at least 1 day, which is the 3rd largest extent for a February month, after 2025 (41%) and 2024 (44%).
Year by year evolution of the surface impacted by strong and higher MHW during months of February. The size of the bar represents the proportion of the global ocean (between 60°S and 60°N) exposed to a strong or higher MHW during the month. As indicated by the colours, the proportion exposed to such MHWs is categorized according to the number of days impacted during the month.

Statistics

Marine heatwave average duration, intensity, occupied surface and activity in February 2026

  • On a global scale, February 2026 was the 5th most extreme February month in terms of MHW intensity after 2023, 2025, 1998, 2024. It was also the 4th February month with longest MHW events on average after 2025, 1998, and 2024
  • In the Mediterranean Sea, February 2026 was the 4th most extreme February on average but not as intense and long as February 2011, 2024 or 2025
  • In the North Atlantic, February 2026 was the 3rd most extreme February in terms of MHW duration, behind 2025 and far from the event of February 2024. It was the 6th most intense event, still far from the record of 2024


MHW characteristics for February months from 1993 to 2026. Duration, intensity, extent and activity averaged for each February month between 1993 and 2026 for the global ocean (left), for the Mediterranean Sea (center) and the North Atlantic Ocean (right). February 2026 is highlighted with a blue edge.


About the Bulletin

Mercator Ocean International publishes a monthly sea surface temperature bulletin reporting on mean temperature and marine heatwave conditions for the month just passed. It includes:

  • Regions where MHWs are present and the time these events started,
  • Timeseries showing the total surface occupied by MHWs globally and for the European region,
  • The total number of days of exposure to MHW during the month (including only strong and higher intensity categories).

Data sets and products

Sea Surface Temperature

The results are obtained using the Copernicus Marine Service global analysis and forecasting system together with observation-based products.

  • GLOBAL_ANALYSISFORECAST_PHY_001_024 Global Ocean Physics Analysis and Forecast sea surface temperature. U. Copernicus Marine Service Information (CMEMS). Marine Data Store (MDS). DOI: https://doi.org/10.48670/moi-00016
  • ESA SST CCI reprocessed sea surface temperature analyses. E.U. Copernicus Marine Service Information (CMEMS). Marine Data Store (MDS). DOI: https://doi.org/10.48670/moi-00169
  • NOAA OI SST V2 High Resolution Dataset data provided by the NOAA PSL, Boulder, Colorado, USA, from their website at https://psl.noaa.gov, Huang, B., C. Liu, V. Banzon, E. Freeman, G. Graham, B. Hankins, T. Smith, and H.-M. Zhang, 2021: Improvements of the Daily Optimum Interpolation Sea Surface Temperature (DOISST) Version 2.1, Journal of Climate, 34, 2923-2939. doi: 10.1175/JCLI-D-20-0166.1
  • Global Ocean OSTIA Sea Surface Temperature and Sea Ice Analysis. E.U. Copernicus Marine Service Information (CMEMS). Marine Data Store (MDS). DOI: https://doi.org/10.48670/moi-00165
  • ODYSSEA Global Sea Surface Temperature Gridded Level 4 Daily Multi-Sensor Observations. E.U. Copernicus Marine Service Information (CMEMS). Marine Data Store (MDS). DOI: https://doi.org/10.48670/moi-00016

Notes: The global analysis system was used to study the ocean surface temperature from 2021 and 2025. To study surface temperature for previous years (1991 to 2020), it was used the ESA CCI data. The other observation-based sea surface temperature products (OSTIA, OI SST and Odyssea) were used for calculating monthly mean and uncertainty values for February 2026

 Marine Heatwaves

The results are obtained using the Copernicus Marine Service global systems including the analysis and forecasting system together with the reanalysis product.

  • GLOBAL_ANALYSISFORECAST_PHY_001_024 Global Ocean Physics Analysis and Forecast sea surface temperature. U. Copernicus Marine Service Information (CMEMS). Marine Data Store (MDS). DOI: https://doi.org/10.48670/moi-00016
  • GLOBAL_MULTIYEAR_PHY_001_030 Global Ocean Physics Reanalysis sea surface temperature. U. Copernicus Marine Service Information (CMEMS). Marine Data Store (MDS). DOI: https://doi.org/10.48670/moi-00021

Notes: The global analysis system was used to study MHWs for 2024 and 2025. To study MHWs for previous March (1993 to 2023), it was used the reanalysis system. The reanalysis product was used for generating a daily climatology using the 30-year period from 1993 to 2022