Ocean Temperature Bulletin North Atlantic highlights 2025
Mercator Ocean International (MOi) oceanographers examine marine heatwaves across the global ocean. They analyse a variety of datasets from observation analyses (satellite sea surface temperature maps) to model analyses (assimilating satellite and in situ observations) and model forecasts.¹
Mercator Ocean International (MOi) publishes an annual surface temperature bulletin reporting on mean temperature and Marine HeatWave (MHW) conditionsfor the year 2025. This bulletin focuses on the global ocean (between 60°S and 60°N) and 2 regions: the Mediterranean Sea and the North Atlantic (between 0°N and 60°N).
2025 was the 6th warmest year of the past 33 years for the North Atlantic (between 0°N and 60°N).
Mean sea surface temperature (SST) of 22.42 ± 0.18°C.
89% of the North Atlantic experienced above average sea surface temperatures with the highest values seen on the European coast and in the Gulf of Mexico.
97% of the North Atlantic was affected by MHW in 2025 -the third largest extent impacted by MHW after 2024 (99%) and 2023 (99.6%).
sea Surface Temperature
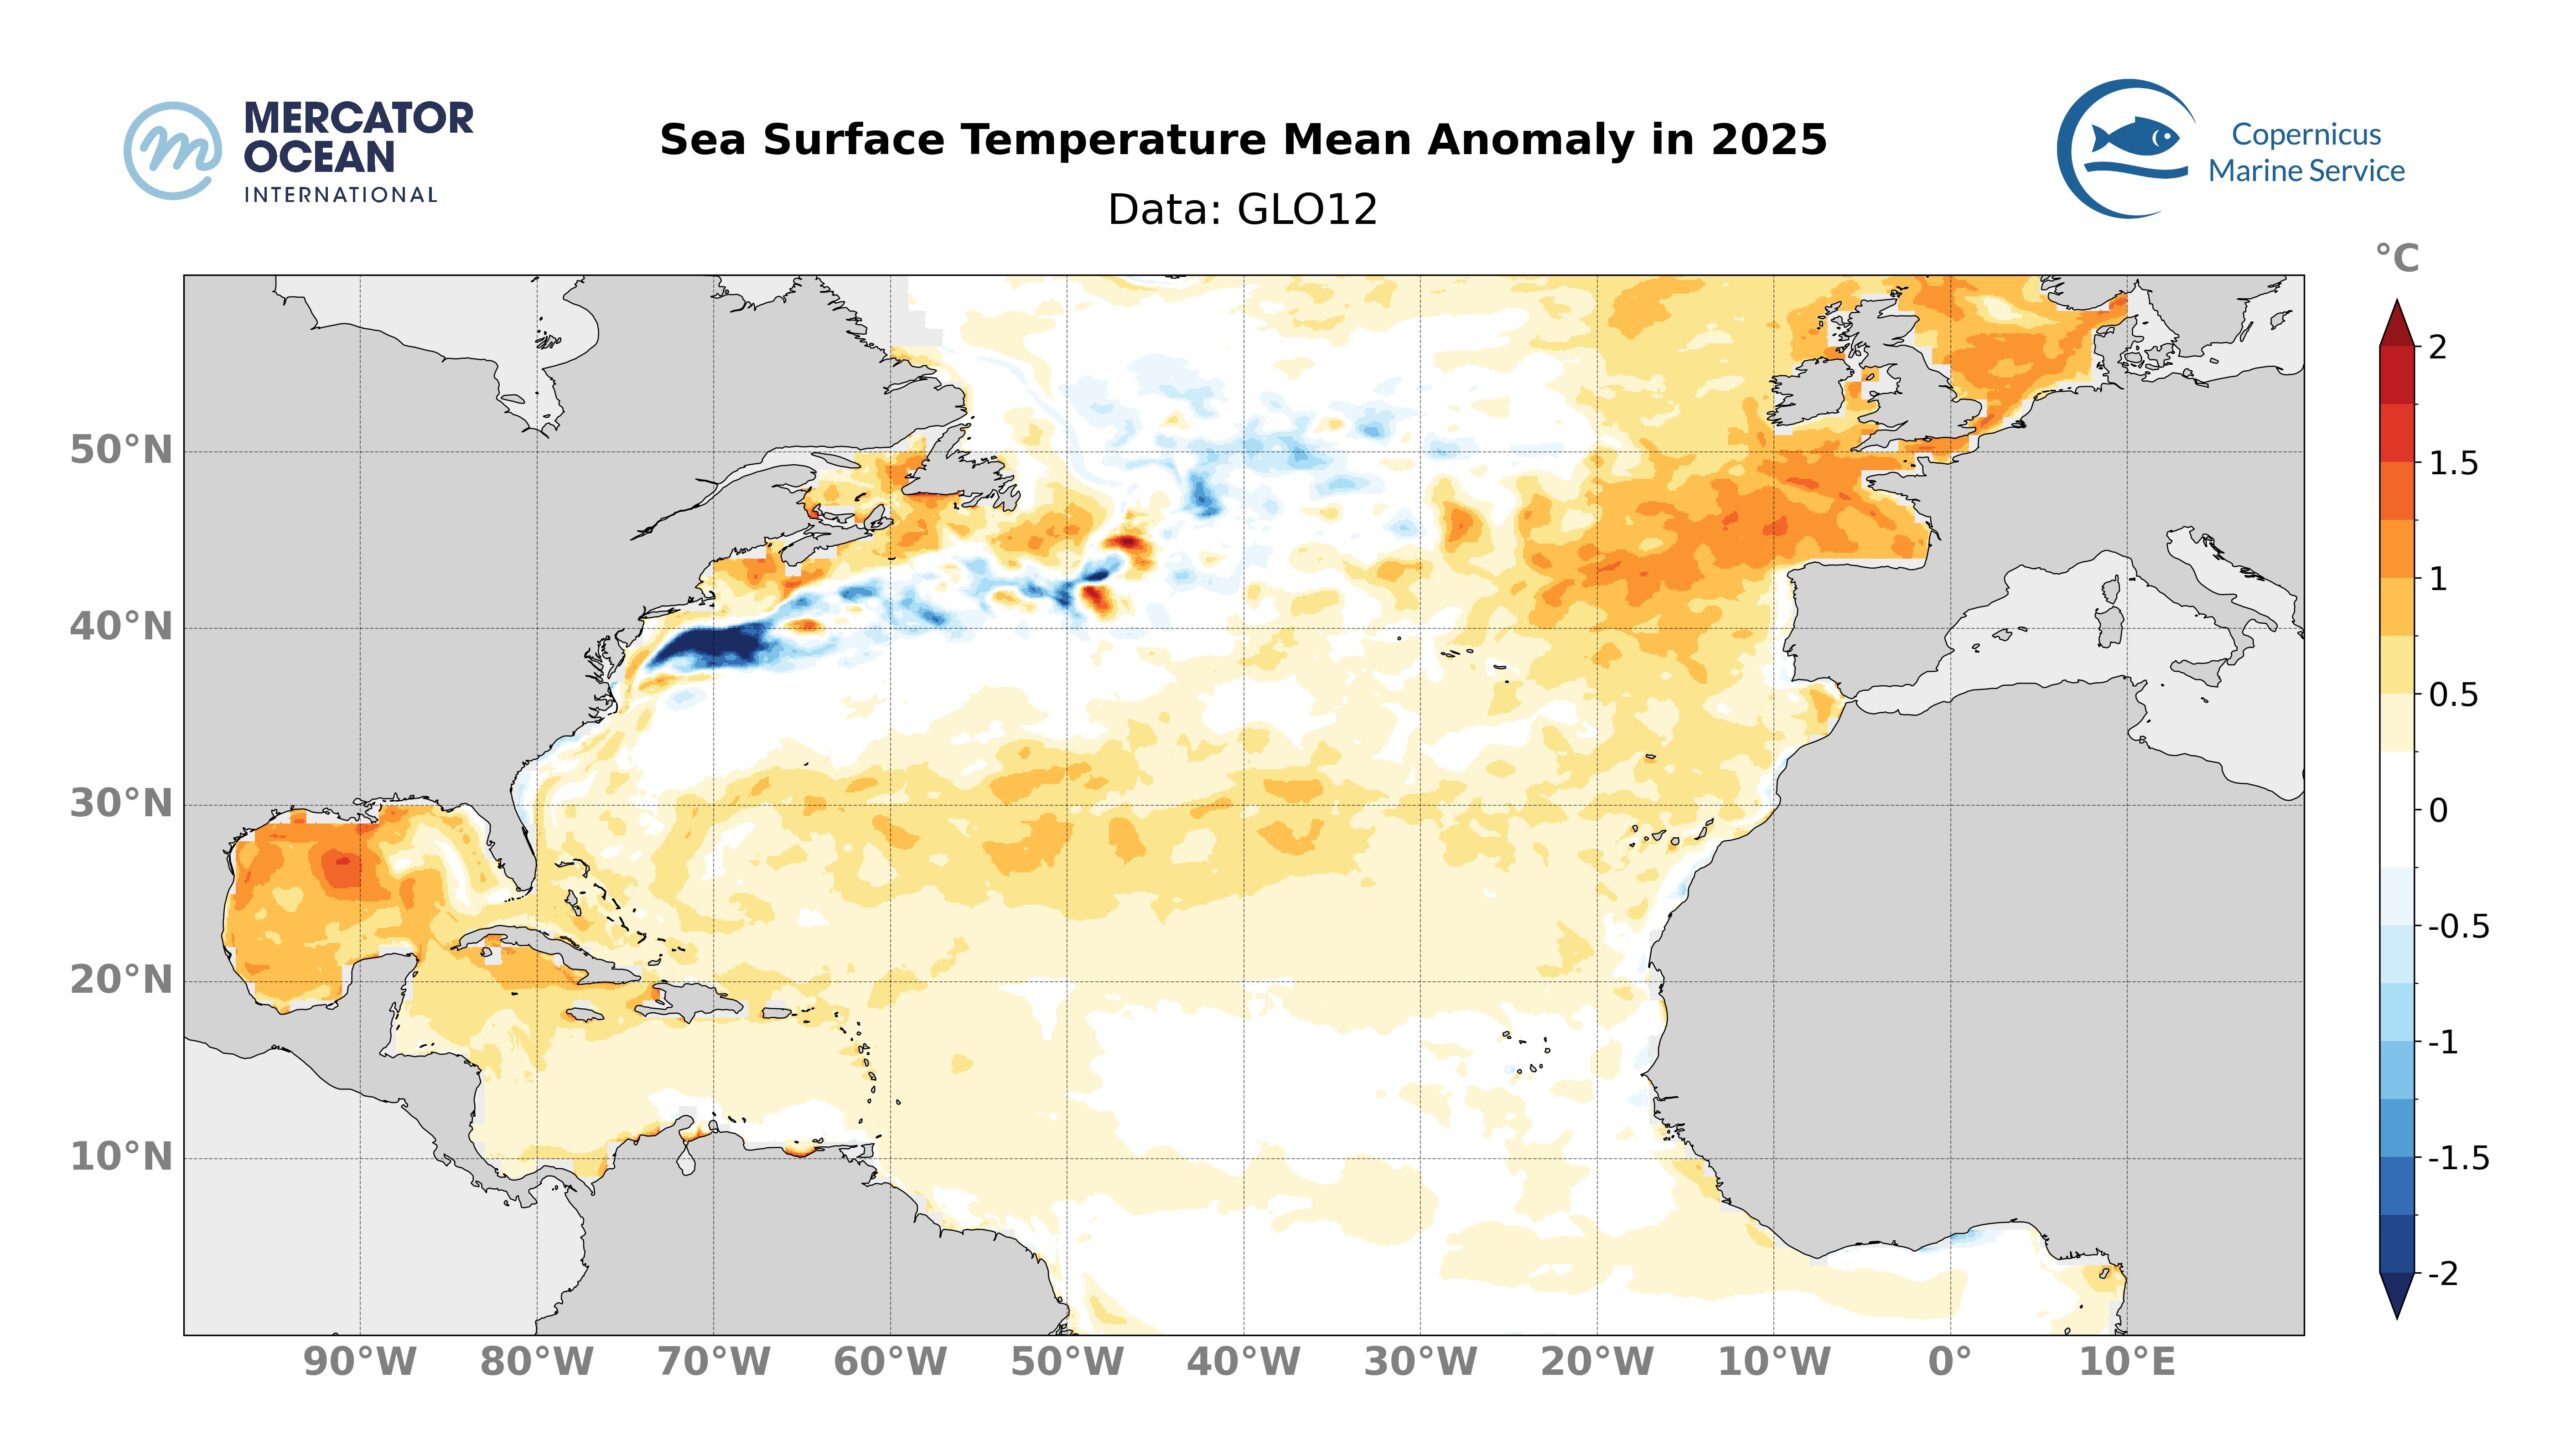
2025 Mean SST Anomaly relative to a 30-year climatology (1993-2022), calculated using daily data from Mercator Ocean International’s GLO12 analysis for 2025 and from GLORYS12 reanalysis for the climatological mean.
2025 was the 6th warmest year of the past 33 years for the North Atlantic (between 0°N and 60°N) with a mean Sea Surface Temperature (SST) of 22.42 ± 0.18°C.
The mean SSTs are above average for 89% of the North Atlantic (between 0°N and 60°N), with highest values reached toward Europe and in the Gulf of Mexico.
Ranking 2025 mean sea surface temperature
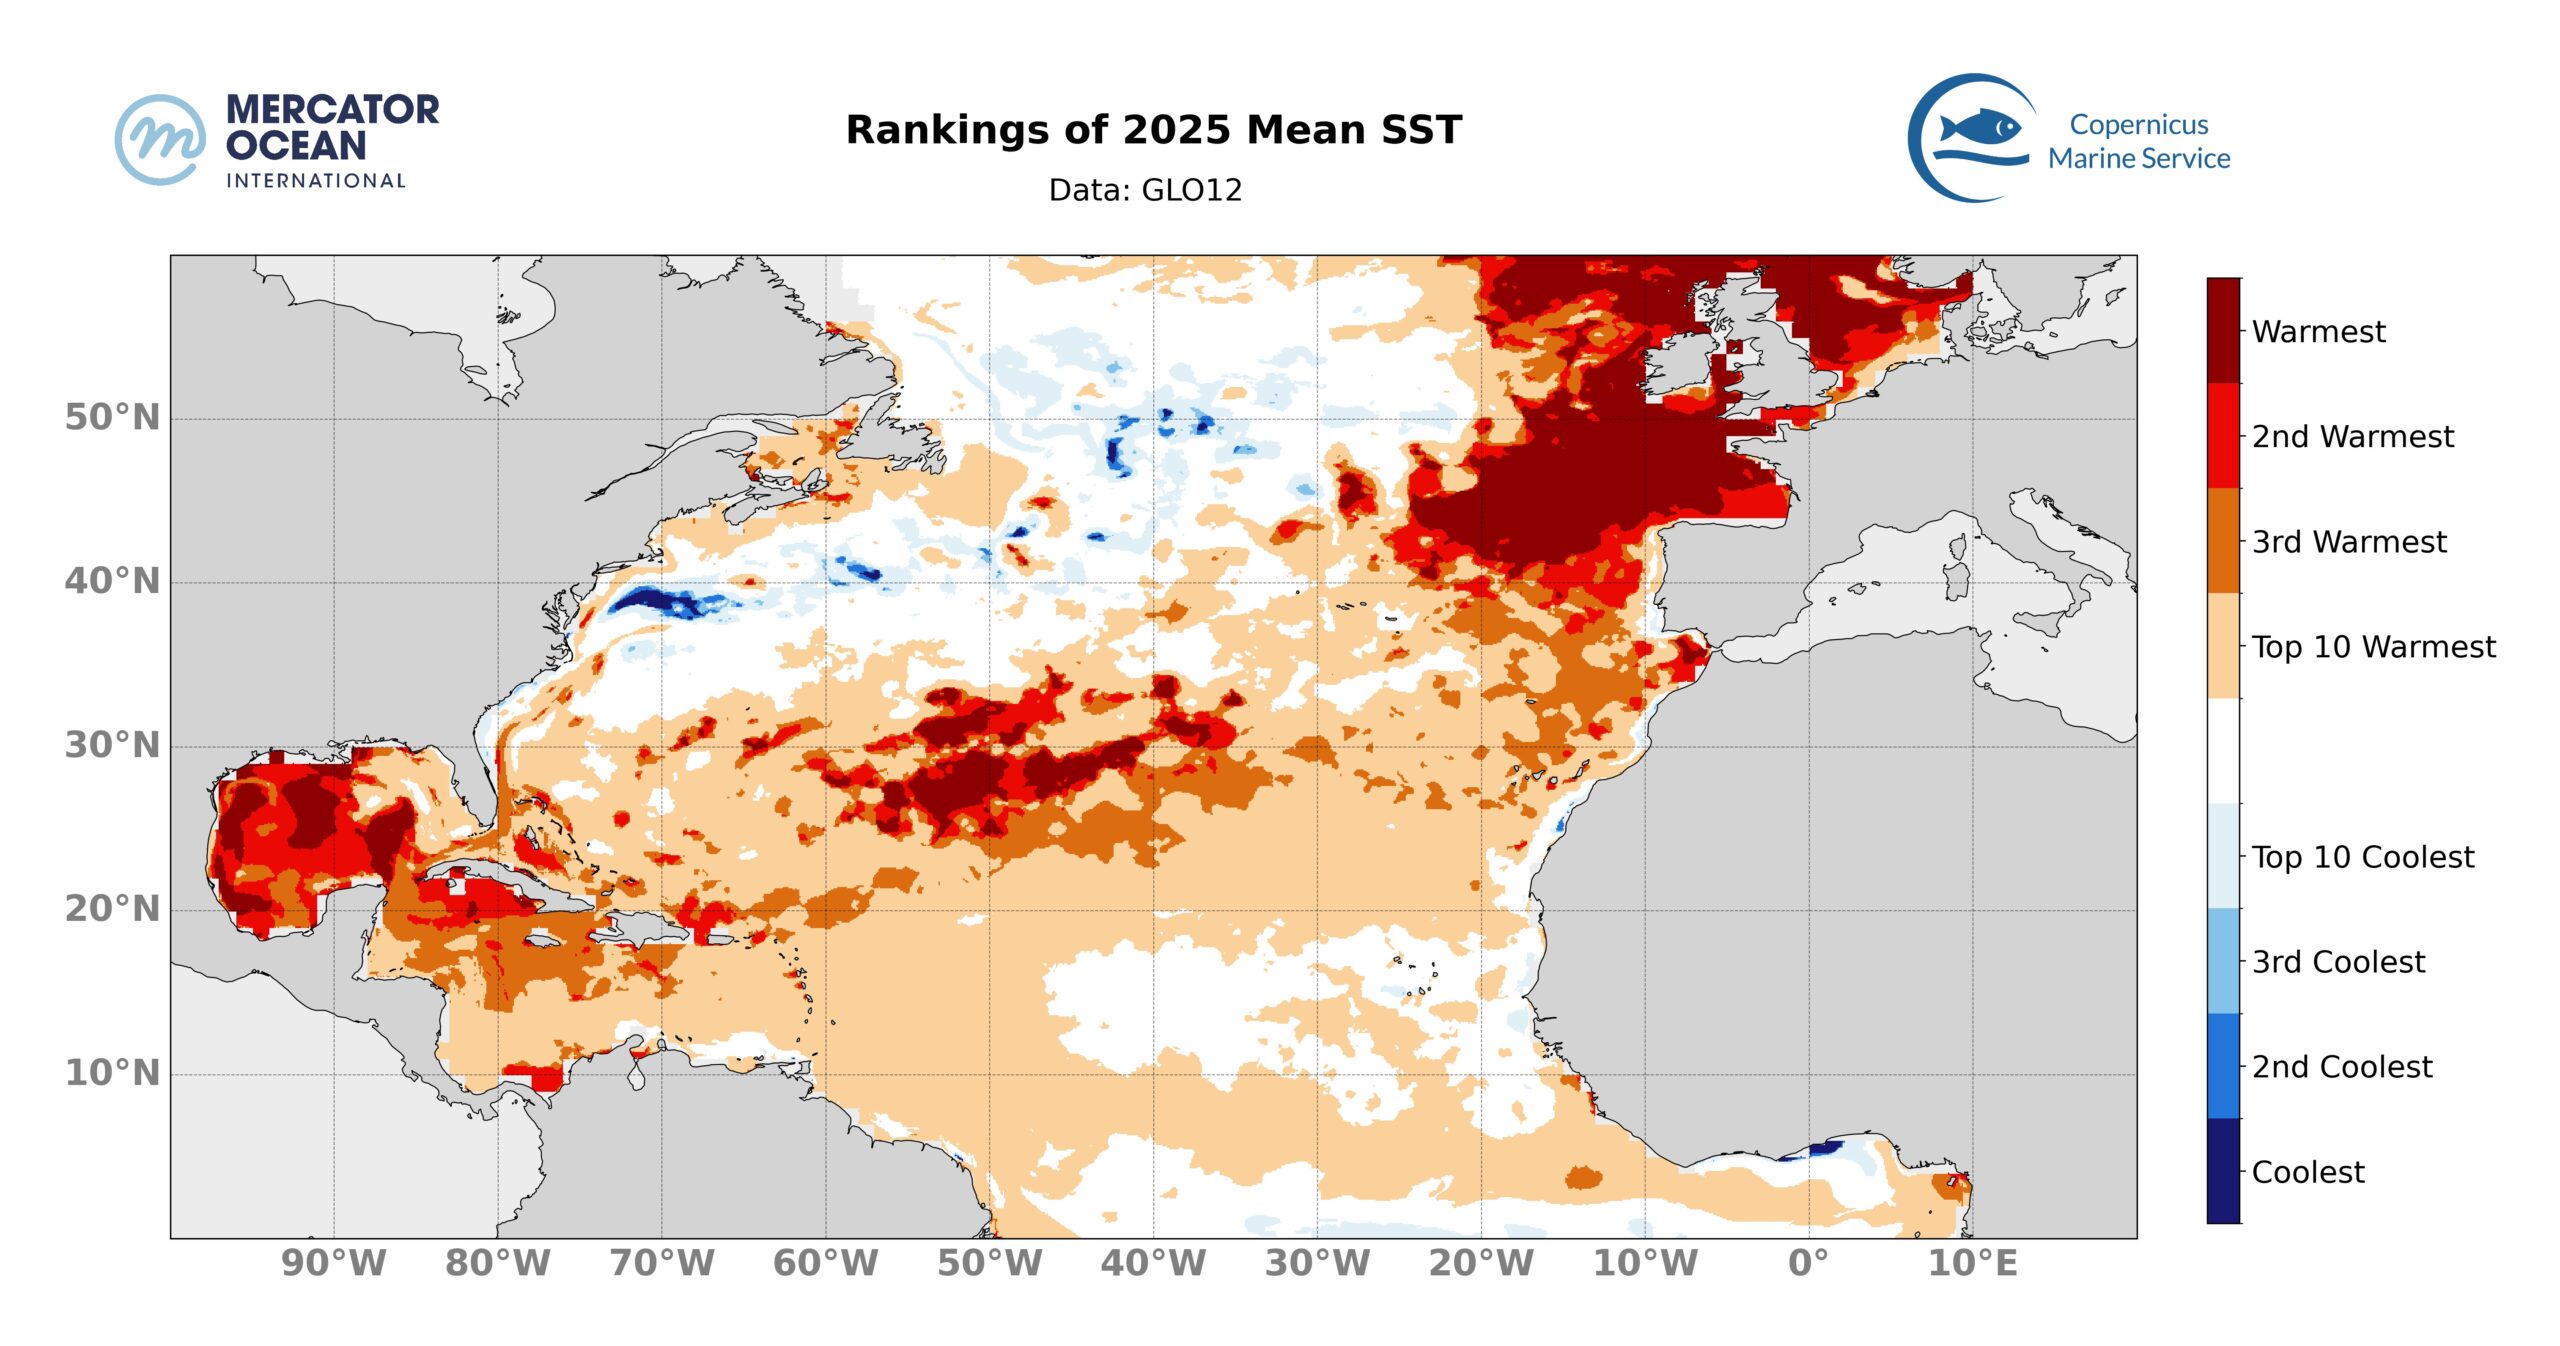
Rankings of 2025 mean SST since 1993 using daily data from Mercator Ocean International’s GLO12 analysis from 2021 to 2025 and from GLORYS12 reanalysis from 1993 to 2020. Blank areas mean that 2025 mean SST doesn’t rank in the 10 warmest or 10 coolest mean SST since 1993.
In 2025, 23% of the North Atlantic experienced SSTs ranking within the 3 warmest since 1993 (Figure 3).
The European coast is the most impacted region, where the annual SSTs have been the warmest since 1993 (dark red on figure 3).
More generally, 69% of the basin experienced SSTs ranking among the warmest 10 years on record. In contrast, only 5% of the basin ranked among the 10 coldest years, mainly in the Gulf Stream region.
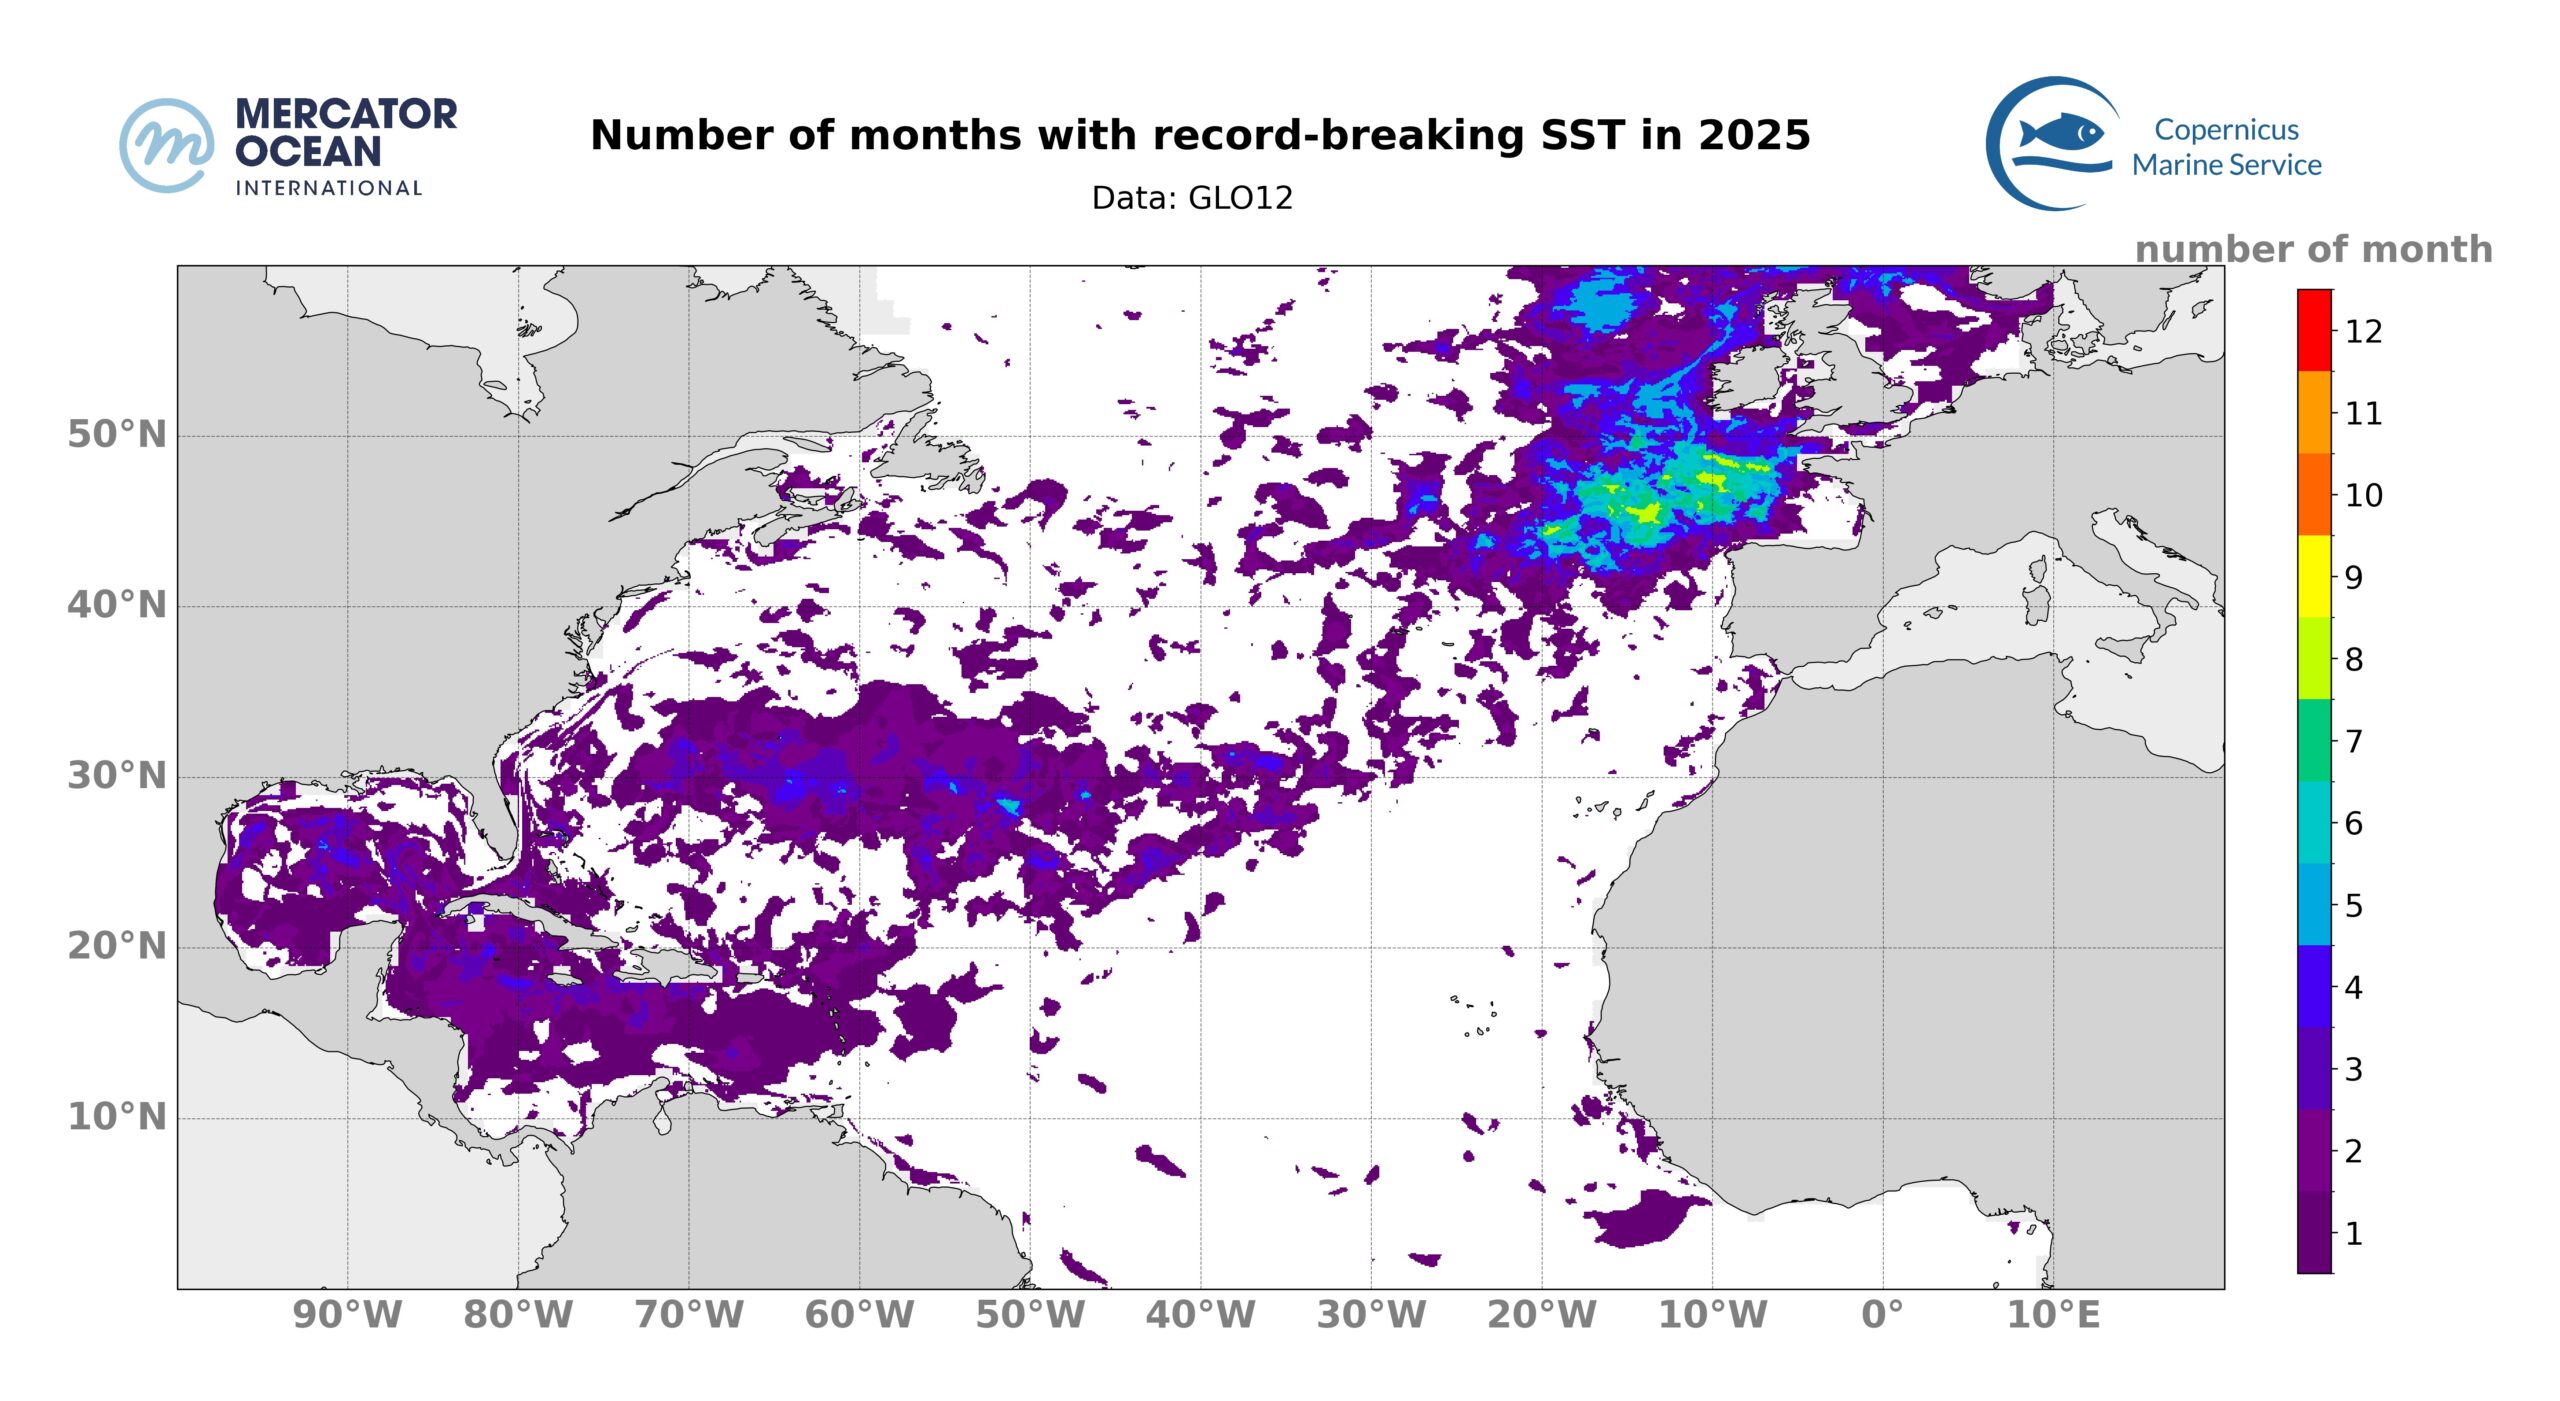
Number of months with record-breaking mean SST during 2025. Blank areas mean that no month ranked as the warmest since 1993.
37% of the North Atlantic (between 0°N and 60°N) experienced at least one month of record-breaking SST during the year 2025. The eastern North Atlantic, towards the European coast, shows a widespread region with 4 to 5 months of record monthly mean SST, reaching locally up to 8 months.
Ongoing Marine Heatwaves
Marine heatwaves (MHWs) are abnormally warm events for which extreme temperatures are observed for at least 5 consecutive days; their occurrence and severity is monitored as MHWs – when prolonged or intense – can have negative impact on the environment and ecosystems.
MHW can be classified based on their intensity into 4 categories (moderate, strong, severe, or extreme). We monitor daily the surface occupied by MHWs and show for the entire year the proportion of the North Atlantic (between 0°N and 60°N) exposed to MHWs. The results from 2025 are represented in solid lines. For comparison with the previous year, results from 2024 are represented in grey shaded area.
Total Surface Marine Heatwaves
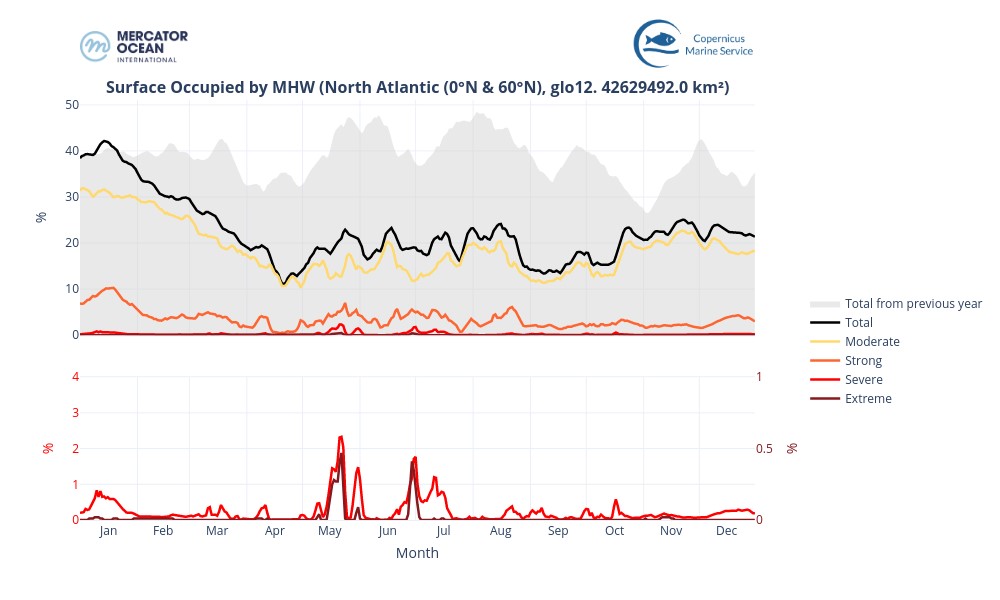
Surface occupied by MHWs in the North Atlantic (between 0°N and 60°N) in 2025 based on daily monitoring. The black solid line represents the total surface of MHW, while the colored lines represent the surface of each MHW category for the year 2025. The gray shaded area refers to the total MHW surface from 2024.
In the North Atlantic (between 0°N and 60°N), the total surface of MHWs for 2025 (solid black line) decreased from January to April (from ~40% to ~12%), then remained somewhat stable (between 13% and 25%).
These MHWs are mostly of moderate and strong categories (yellow and orange lines). Except for the very beginning of the year, the total daily MHW extent was lower in 2025 than the one observed for the same day in 2024.
Highest Marine Heatwave categories reached in 2025
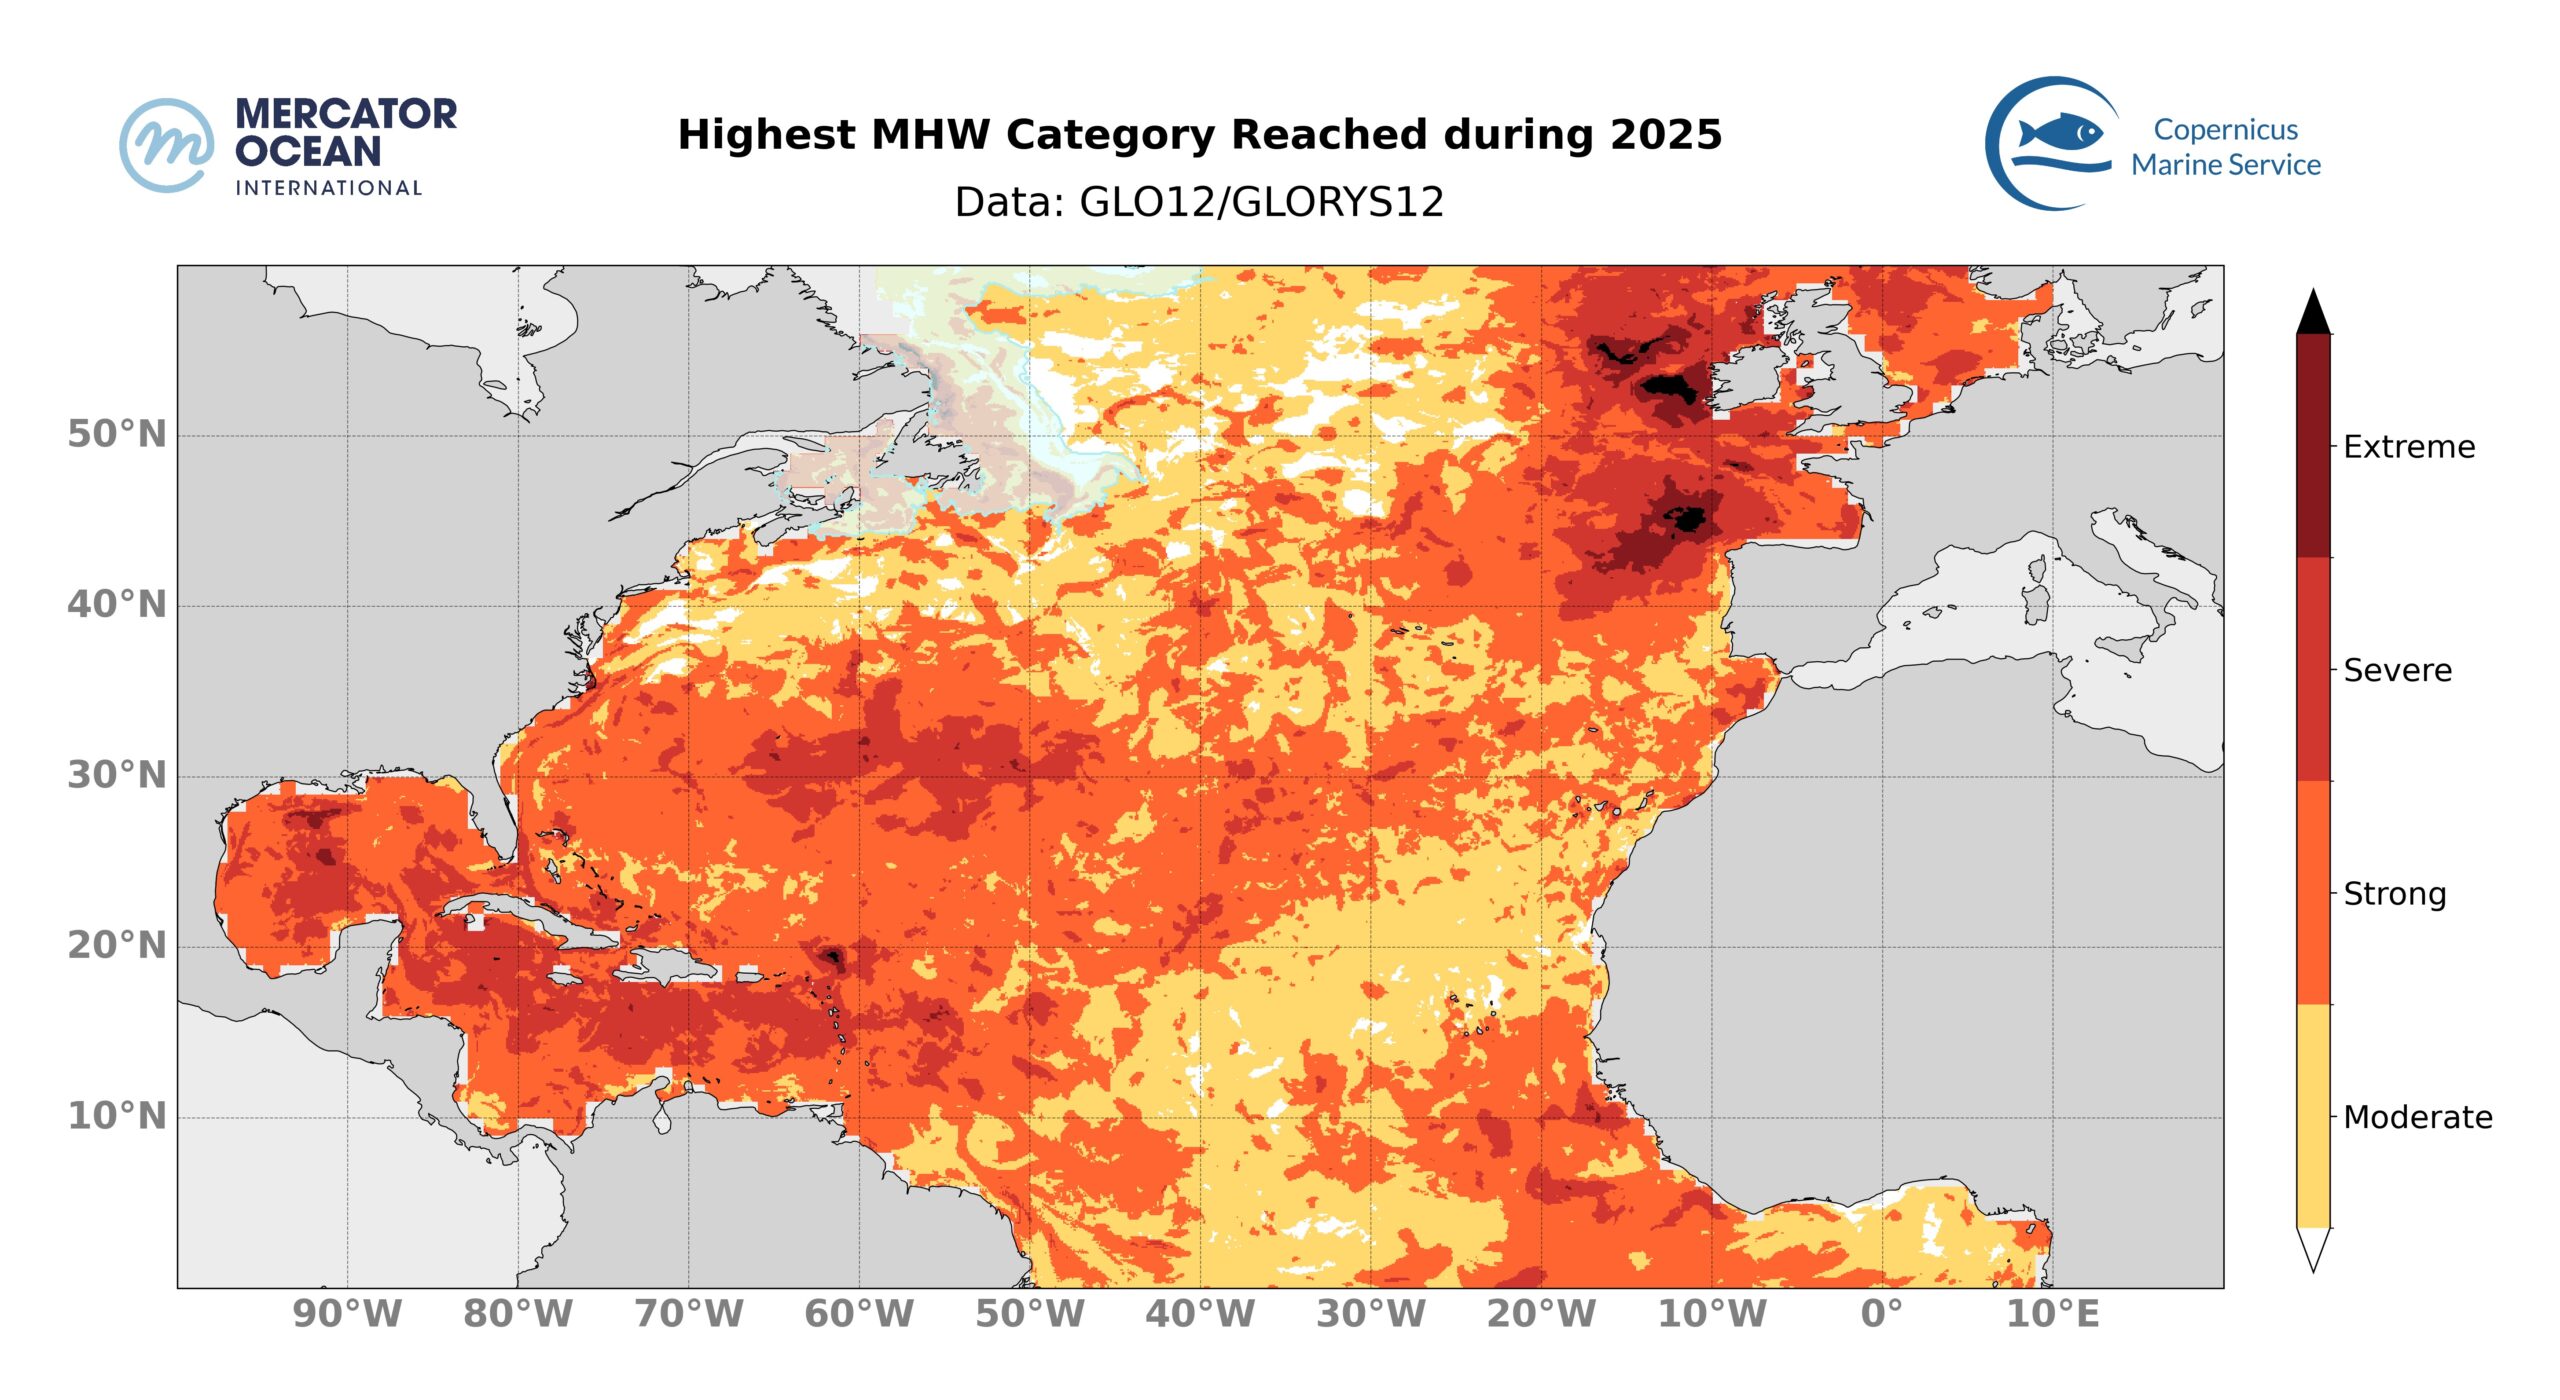
Highest MHW Category reached in 2025. Blank areas mean that no MHW occurred in these regions in 2025.
97% of the North Atlantic (between 0°N and 60°N) was affected by MHW in 2025. It is the third largest extent impacted by MHW after 2024 (99%) and 2023 (99.6%).
Focusing on strong or higher category MHW events, 63% of the North Atlantic (between 0°N and 60°N) was affected by such MHWs, the third widest extent after 2024 (88%) and 2023 (92%).
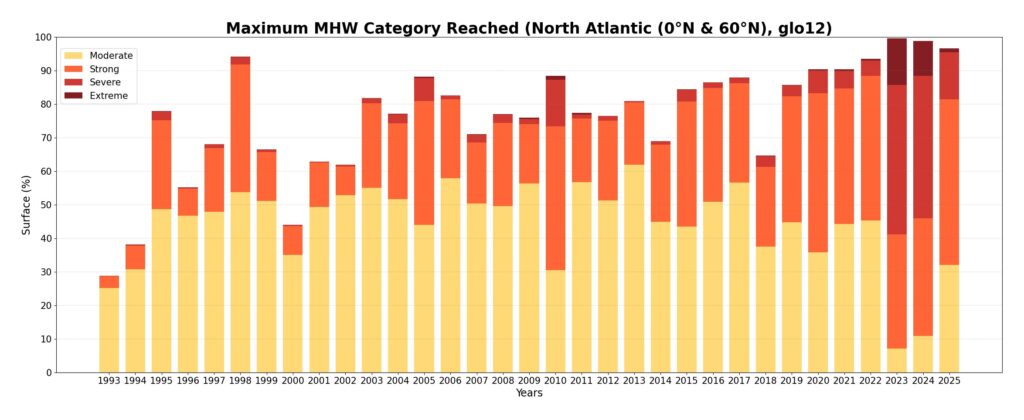
Evolution of the extent of the highest MHW category in the North Atlantic (between 0°N and 60°N). For each year, the length of the bar represents the percentage of the region impacted by MHW, while the colors indicate the proportion of the highest categories reached within that region. The horizontal dotted line represents the average surface of the region impacted by MHW during the semester between 1993 and 2025.
Total Number Marine Heatwaves
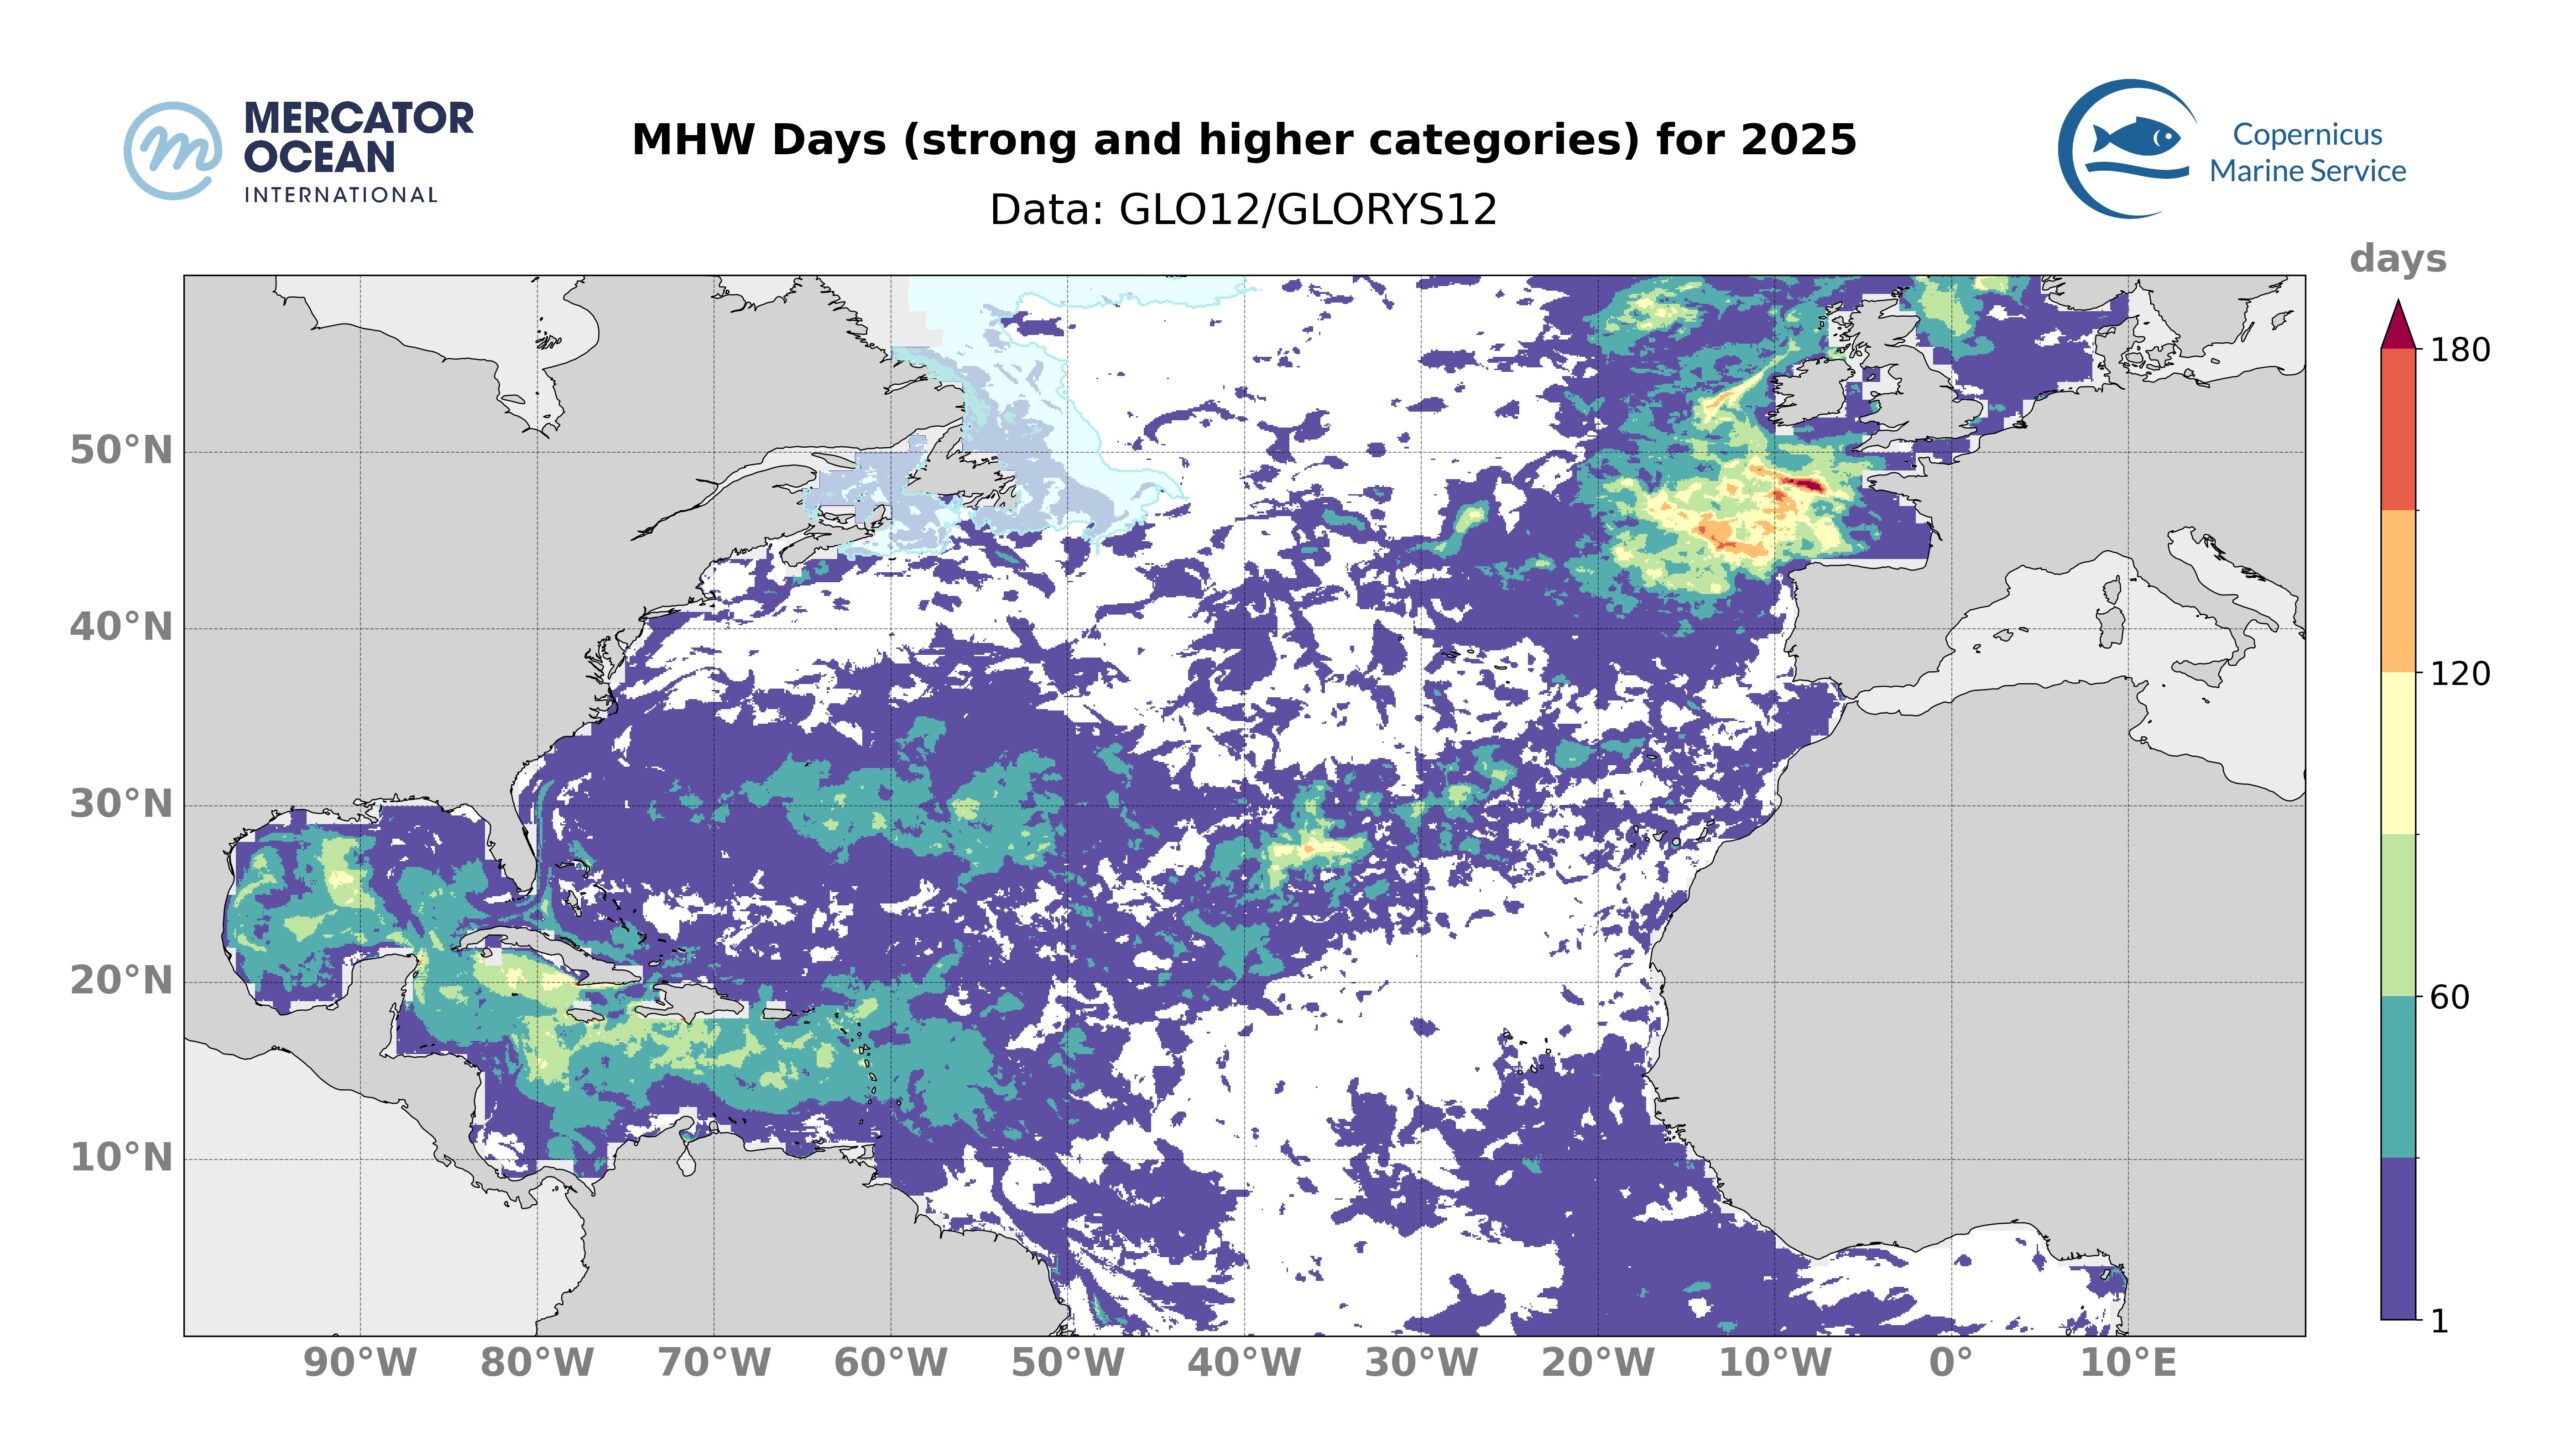
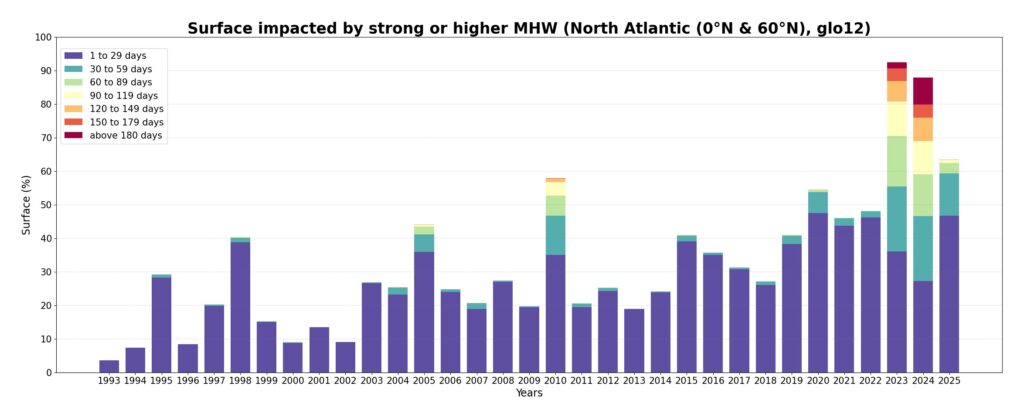
2025 MHW days of strong and higher category. Number of days during which a MHW of category strong, severe or extreme occurred during the first semester of 2025. Blank areas mean that no MHW of strong or higher category happened in 2025.Year by year evolution of the surface impacted by strong and higher MHW for the period January to June. The size of the bar represents the proportion of the North Atlantic (0°N to 60°N) exposed to a strong or higher MHW. The colours indicate the number of days impacted by such MHW.
In 2025, 17% of the North Atlantic (between 0°N and 60°N) was exposed to intenseMHW conditions (i.e. strong or higher category) for more than 30 days (not necessarily consecutive days), which represents the 4th widest extent since 1993, ranking after 2010 (28%), 2023 (56%) and 2024 (61%).
Statistics
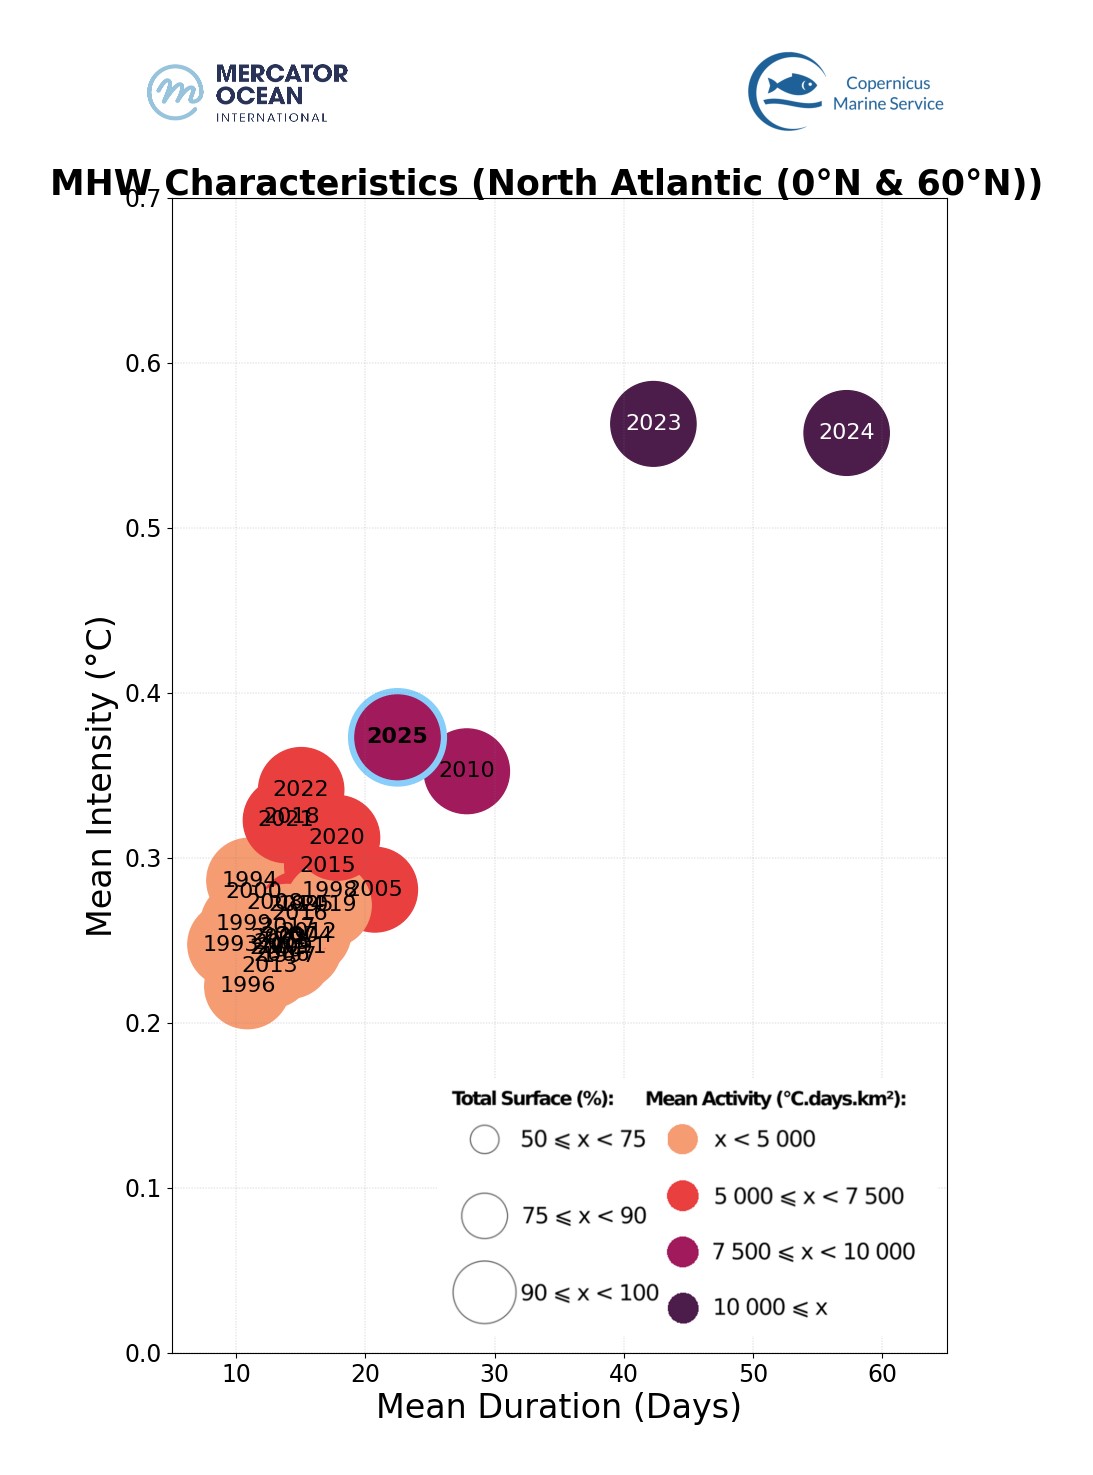
Annual MHW Characteristics from 1993 to 2025. Duration, intensity, extent and activity averaged for each year between 1993 and 2025 for the North Atlantic (between 0°N and 60°N). 2025 is highlighted with a blue edge.
In 2025, the North Atlantic was the third most extreme in terms of MHWs intensity (after 2024 and 2023) and the fourth in terms of MHW duration (after 2010, 2023 and 2024).
About the Bulletin
Datasets
Sea Surface Temperature
The results are obtained using the Copernicus Marine Service global analysis and forecasting system together with observation-based products.
GLOBAL_ANALYSISFORECAST_PHY_001_024 Global Ocean Physics Analysis and Forecast sea surface temperature. U. Copernicus Marine Service Information (CMEMS). Marine Data Store (MDS). DOI: https://doi.org/10.48670/moi-00016
ESA SST CCI reprocessed sea surface temperature analyses. E.U. Copernicus Marine Service Information (CMEMS). Marine Data Store (MDS). DOI: https://doi.org/10.48670/moi-00169
NOAA OI SST V2 High Resolution Dataset data provided by the NOAA PSL, Boulder, Colorado, USA, from their website at https://psl.noaa.gov, Huang, B., C. Liu, V. Banzon, E. Freeman, G. Graham, B. Hankins, T. Smith, and H.-M. Zhang, 2021: Improvements of the Daily Optimum Interpolation Sea Surface Temperature (DOISST) Version 2.1, Journal of Climate, 34, 2923-2939. doi: 10.1175/JCLI-D-20-0166.1
Global Ocean OSTIA Sea Surface Temperature and Sea Ice Analysis. E.U. Copernicus Marine Service Information (CMEMS). Marine Data Store (MDS). DOI: https://doi.org/10.48670/moi-00165
ODYSSEA Global Sea Surface Temperature Gridded Level 4 Daily Multi-Sensor Observations. E.U. Copernicus Marine Service Information (CMEMS). Marine Data Store (MDS). DOI: https://doi.org/10.48670/moi-00016
Notes: The global analysis system was used to study the ocean surface temperature from 2021 and 2025. To study surface temperature for previous years (1991 to 2020), it was used the ESA CCI data. The other observation-based sea surface temperature products (OSTIA, OI SST and Odyssea) were used for calculating monthly mean and uncertainty values for March 2025.
Marine Heatwaves
The results are obtained using the Copernicus Marine Service global systems including the analysis and forecasting system together with the reanalysis product.
GLOBAL_ANALYSISFORECAST_PHY_001_024 Global Ocean Physics Analysis and Forecast sea surface temperature. U. Copernicus Marine Service Information (CMEMS). Marine Data Store (MDS). DOI: https://doi.org/10.48670/moi-00016
GLOBAL_MULTIYEAR_PHY_001_030 Global Ocean Physics Reanalysis sea surface temperature. E.U. Copernicus Marine Service Information (CMEMS). Marine Data Store (MDS). DOI: https://doi.org/10.48670/moi-00021
Notes: The global analysis system was used to study MHWs for 2024 and 2025. To study MHWs for previous March (1993 to 2023), it was used the reanalysis system. The reanalysis product was used for generating a daily climatology using the 30-year period from 1993 to 2022.