Ocean Temperature Bulletin
April 2026

Mercator Ocean International (MOi) oceanographers examine marine heatwaves across the global ocean. They analyse a variety of datasets from observation analyses
(satellite sea surface temperature maps) to model analyses
(assimilating satellite and in situ observations) and model forecasts.¹

All images in this article can be used freely and should be credited with the following information :
Image source: European Union, Copernicus Marine Service Data 2025 © Mercator Ocean .

Key takeaway

  • April 2026 was the second-warmest April on record for the global ocean(between 60°S and 60°N), with a mean sea surface temperature (SST) of 21.08 °C, closely behind 2024 (21.1± 0.07 °C).
  • 76% of the ocean experienced above average SST, with the Pacific Ocean largely impacted.
  • 12% of the Central Pacifc (between 30°S and 30°N) reached record breaking SST, and 60% ranked within the ten-warmest sea surface temperatures since 1993.
  • Widespread and persistent MHWs are found in the Pacific ocean: in the centre, spanning the entire width of the basin, the oldest MHW is present since January in the western and eastern part, a 3-month-old MHWs can be found in the South Pacific around 120°W and in the North Pacific, off northern Japanese coasts, MHW are persisting since December 2025.
  • Ithe Southern Oceanbetween 60°E and 90°E, MHWs reach locally almost 1 year old. 
  • Across European seas, April 2026 ranked among the most extreme Aprils for marine heatwave (MHW) activity, with the Mediterranean experiencing its fourth-most intense event and the North Atlantic placing within the top ten over the past 34 years.

sea Surface Temperature

Daily sea surface temperatures averaged for the global ocean (top), the Mediterranean Sea (middle) and the North Atlantic Ocean (bottom) Data: ESA’s Climate Change Initiative (grey shades) (1991-2020), Global Ocean Physics Analysis and Forecast (GLO12) for the period 2021-2026. Credt: European Union, Copernicus Marine Service/ © Mercator Ocean


  • April 2026, at global level (between 60°S and 60°N), was the 2nd warmest April on record, with a mean sea surface temperature (SST) of 21.08 °C* – behind only 2024 (21.10 ± 0.07 °C). 
  • In the Mediterranean Sea, April 2026 ranks within the 10 warmest April month of the last 34 years, with a mean SST of 17.17 °C*.
  • In the North Atlantic (between 0°N and 60°N), April 2026 was among the third warmest April month ever recorded, with a mean SST of 20.61 °C*.

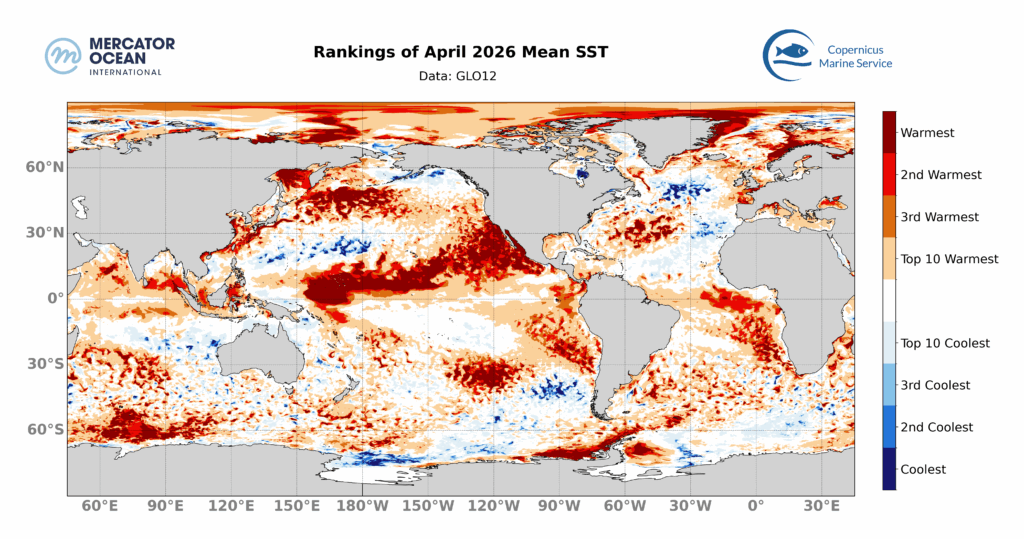
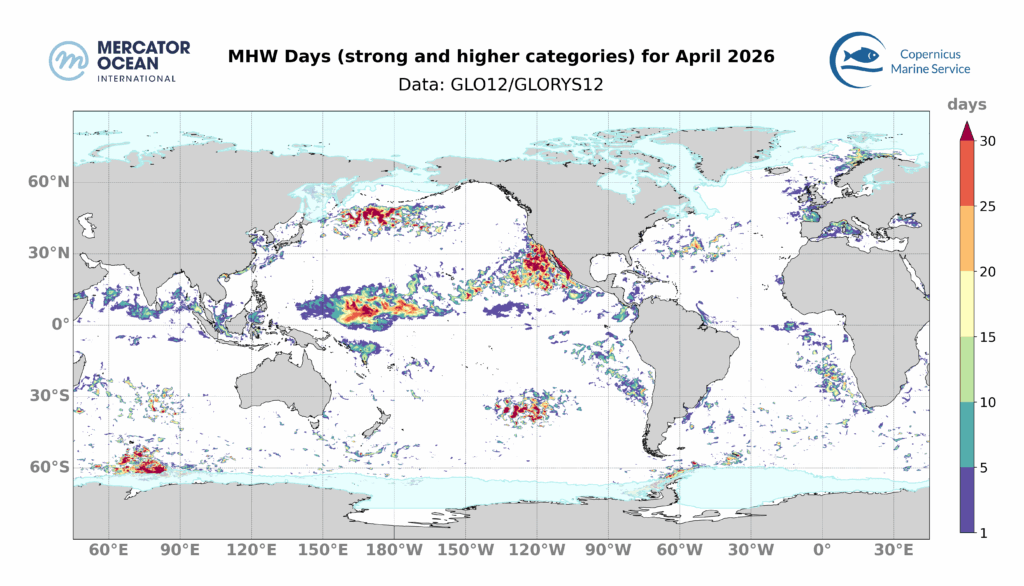
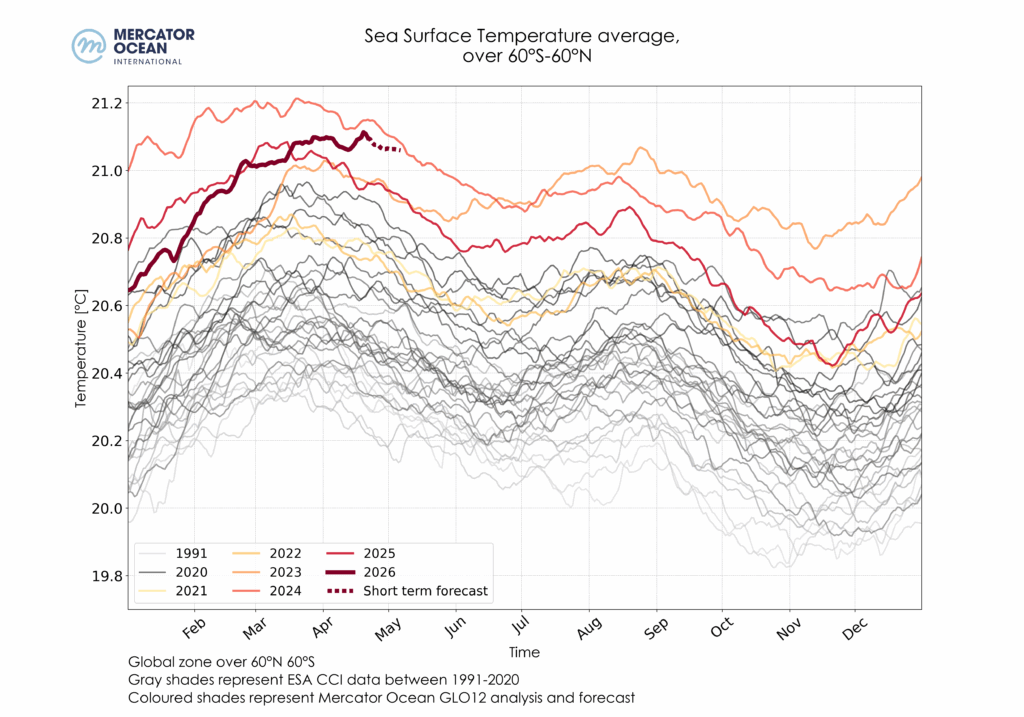
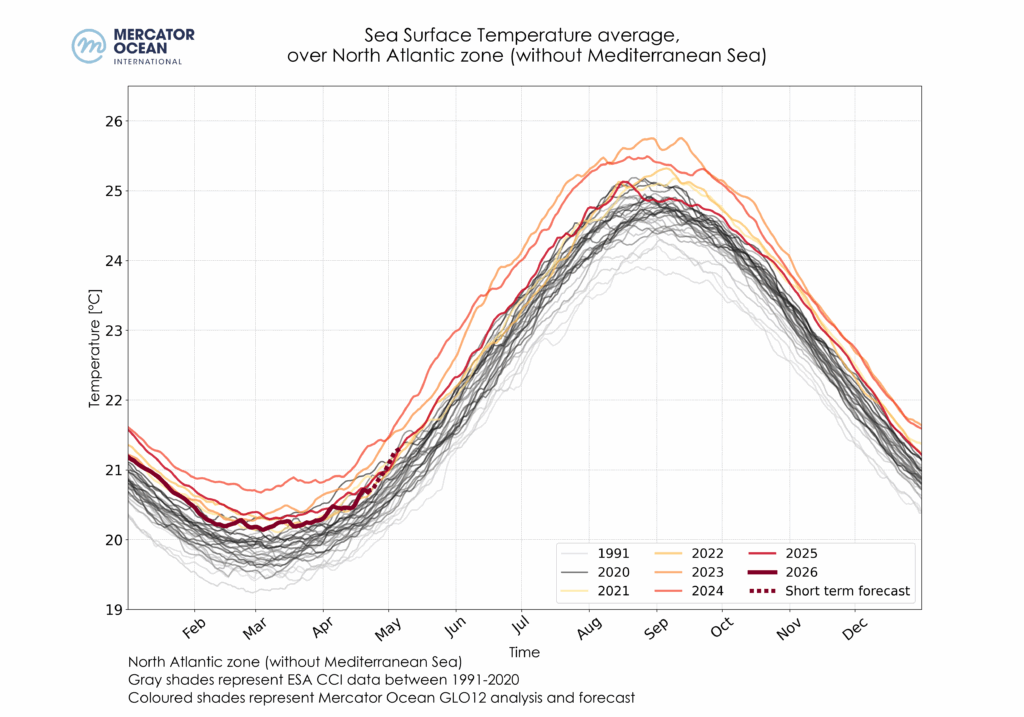
* Values represent forecast estimates of the average sea surface temperature (SST) for April 2026. These will be updated at the end of the month, along with associated uncertainties.

SEA SURFACE TEMPERATURE ANOMALIES 


April 2026 Mean SST Anomaly relative to a 30-year climatology (1993-2022), calculated using daily data from Mercator Ocean International’s GLO12 analysis and forecasting system for 2026 and from the GLORYS12 reanalysis for the climatological mean.


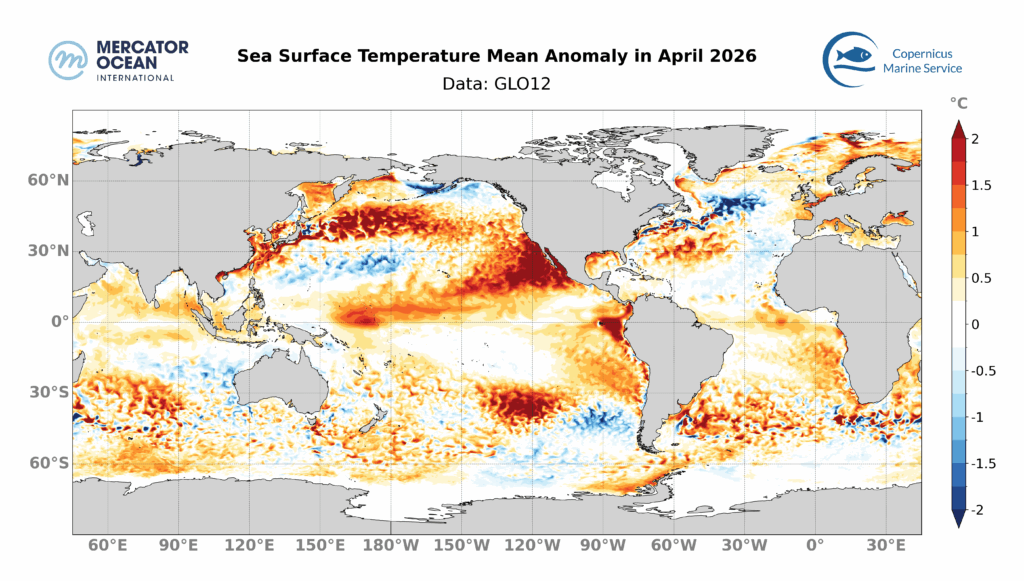
April 2026 mean SSTs are above average for 76% of the global ocean (between 60°S and 60°N), and 15% of the global ocean is above average by at least 1°C.

  • Most of the Mediterranean Sea (89%) showed above-average SSTs, with stronger SSTs in the northern part, reaching 1°C.
  • The North Pacific Ocean showed predominantly warmer than average SSTs, spanning the entire width of the basin and reaching 3°C above average in the Kuroshio region and its extension.
  • In the South Pacific, strong SSTs, reaching 3°C above average were observed in the around 120°W.
  • In the Equatorial Pacific, there are no longer cooler-than-average areas, indicating that ENSO conditions are currently neutral. Most of the basin between 30°S and 30°N (82%) showed stronger-than-average SSTs, with the strongest SSTs reached along and off the coast of Mexico, reaching 3°C above average.
  • The North Atlantic, at midlatitude, displayed above-average SSTs in the western part, and below-average in the easter part. The South Atlantic recorded mostly above-average SSTs.
  • In the Indian Ocean, above average SSTs are found east of Madagascar, reaching up to 2°C above average, and in the northern part, reaching almost 1°C above average.
  • SSTs are approximately 1°C above average in the Southern Ocean, between 50°E and 120°E.


RANKING APRIL 2026 MEAN SEA SURFACE TEMPERATURES

Ranking of average monthly SSTs reached in April 2026, calculated using daily data from Mercator Ocean International’s GLO12 analysis and forecasting system for 2026 and from the GLORYS12 reanalysis for the climatological mean. The colours indicate the rank of April 2026 among all months of April since 1993.
  • Around 8% of the global ocean (between 60°S and 60°N) ranked as the warmest April month on record, with more than half of the ocean (53%) within the 10 warmest.
  • More than 2/3 of the Mediterranean (68%) recorded average SSTs that ranked among the 10 highest ever observed in April, with record breaking SSTs along the coast of France.
  • In the North Atlantic, April 2026 SSTs rank within the 10 warmest April month in the European region. Most of the South Atlantic SSTs stand among the 10 warmest months, reaching record level locally.
  • In the North Pacific, April 2026 SSTs are reaching record levels between 40°N and 50°N. In the Central Pacific, between 30°S and 30°N, 12% of the basin reached record breaking SST, while 60% rank within the 10 warmest SST.


Ongoing Marine Heatwaves

Month of onset for the ongoing MHWs on the 30th of April 2026. The colours indicate the month during which the MHW started. For instance, ocean pixels in red correspond to an MHW that developed during April 2026 and are less than one month old, in orange MHW between 1 and 2 months old, etc.


  • On the 30th of April, 29% of the global ocean (between 60°S and 60°N) was affected by MHWs.
  • The majority of these MHWs developed recently, with 22% of the global Ocean (between 60°S and 60°N) affected by MHWs less than 1 month old and 5% by events between 1- and 2-month-old.
  • Widespread and persistent MHWs are found in the central Pacific, spanning the entire width of the basin, with the oldest MHW developed in January in the western and eastern part. 
  • 3-month-old MHWs can also be found in the South Pacific around 120°W.
  • In the North Pacific, off northern Japanese coasts, MHW are persisting since December 2025.
  • In the Southern Ocean, between 60°E and 90°E, MHWs reach locally almost 1 year old. 

Total Surface Marine Heatwaves

Global Ocean

Surface occupied by MHWs in the global ocean (between 60°S and 60°N) between May 2025 and April 2026 based on daily monitoring. The black solid line represents the total surface of MHW, while the coloured lines represent the surface of each MHW category. The grey background highlights the month of April 2026.


  • In April 2026, the total surface area of MHW (black line) rose from 24% to 30% of the global ocean (between 60°S and 60°N), with pronounced increase mid-month.
  • The majority of MHWs events were of moderate categories (from 20to 25% of the global ocean) andto a lesser extent, strong categories (around 4% of the global ocean). For comparison, in April 2025, MHW decreased to ~20% by the end of the month (not shown).


 Mediterranean Sea 


Surface occupied by MHWs in the Mediterranean Sea between May 2025 and April 2026 based on daily monitoring. The black solid line represents the total surface of MHW, while the coloured lines represent the surface of each MHW category. The grey background highlights the month of April 2026


  • For the Mediterranean Sea, the total area covered by MHWs increased during April 2026, from 4% to ~30%. 
  • These MHW were mainly moderate and strong in category (~21% and ~7% by the end of the month, respectively)with a noteworthy pic of strong events mid-month, reaching 16% of the Mediterranean Sea. 

North Atlantic


Surface occupied by MHWs in the Mediterranean Sea between May 2025 and April 2026 based on daily monitoring. The black solid line represents the total surface of MHW, while the coloured lines represent the surface of each MHW category. The grey background highlights the month of April 2026.


  • For the North Atlantic (between 0°N and 60°N)the total surface area of MHW increased from 12% to 15% between the beginning and the end of April 2026, with a slight decrease in between (to 9%). 
  • These events consist mostly of moderate categories (from 11% to 13%).

Total Number Marine Heatwaves

April 2026 MHW days of strong and higher category. Number of days during which a MHW of category strong, severe or extreme occurred in April 2026. Blank areas mean that no MHW of strong or higher category happened during the month. Blue shaded areas in the polar regions represent the sea ice maximum from the climatological period (1993-2022). Monitoring SST extremes with the MHW categorization approach as used here is not best suited for such regions.


  • 15% of the surface of the ocean was impacted by strong-or-higher MHW conditions for at least 1 day during April 2026. This is th2nd widest extent of the last 34 years, after only 2024 (28%)The central Pacific is the most affected, with intense MHWs lasting the entire month locally. 
  • Regionally, 8% of the North Atlantic (between 0°N and 60°N) was impacted by strong, or higher, MHW conditions for at least 1 day. This corresponds to the 8th largest extent of the last 34 years for a April month.  
  • For the Mediterranean Sea, 25% of the basin was affected by strong-or-higher MHW conditions for at least 1 day, which is the 4th largest extent for a April month, after 2018 (31%), 2016 (46%) and 2024 (80%). 


Year by year evolution of the surface impacted by strong and higher MHW during months of April. The size of the bar represents the proportion of the global ocean (between 60°S and 60°N) exposed to a strong or higher MHW during the month. As indicated by the colours, the proportion exposed to such MHWs is categorized according to the number of days impacted during the month.

Statistics

Marine heatwave average duration, intensity, occupied surface and activity in April 2026


  • April 2026 was the 3rd most extreme April month for the global ocean in terms of MHWs after 2023 and 2024.  
  • In the Mediterranean Sea, April 2026 was the 4th most extreme April in terms of MHW intensity, after 2016, 2018, 2007 and 2024. 
  • In the North Atlantic, April 2026 stands within the 10-most extreme April months in terms of MHW events, for the last 34 years. 


MHW Characteristics for April months from 1993 to 2026. Duration, intensity, extent and activity averaged for each April month between 1993 and 2026 for the global ocean (top), for the Mediterranean Sea (centre) and the North Atlantic Ocean (bottom). April 2026 is highlighted with a blue edge.

About the Bulletin

Mercator Ocean International publishes a monthly sea surface temperature bulletin reporting on mean temperature and marine heatwave conditions for the month just passed. It includes:

  • Regions where MHWs are present and the time these events started,
  • Timeseries showing the total surface occupied by MHWs globally and for the European region,
  • The total number of days of exposure to MHW during the month (including only strong and higher intensity categories).

Data sets and products

Sea Surface Temperature

The results are obtained using the Copernicus Marine Service global analysis and forecasting system together with observation-based products.

  • GLOBAL_ANALYSISFORECAST_PHY_001_024 Global Ocean Physics Analysis and Forecast sea surface temperature. U. Copernicus Marine Service Information (CMEMS). Marine Data Store (MDS). DOI: https://doi.org/10.48670/moi-00016
  • ESA SST CCI reprocessed sea surface temperature analyses. E.U. Copernicus Marine Service Information (CMEMS). Marine Data Store (MDS). DOI: https://doi.org/10.48670/moi-00169
  • NOAA OI SST V2 High Resolution Dataset data provided by the NOAA PSL, Boulder, Colorado, USA, from their website at https://psl.noaa.gov, Huang, B., C. Liu, V. Banzon, E. Freeman, G. Graham, B. Hankins, T. Smith, and H.-M. Zhang, 2021: Improvements of the Daily Optimum Interpolation Sea Surface Temperature (DOISST) Version 2.1, Journal of Climate, 34, 2923-2939. doi: 10.1175/JCLI-D-20-0166.1
  • Global Ocean OSTIA Sea Surface Temperature and Sea Ice Analysis. E.U. Copernicus Marine Service Information (CMEMS). Marine Data Store (MDS). DOI: https://doi.org/10.48670/moi-00165
  • ODYSSEA Global Sea Surface Temperature Gridded Level 4 Daily Multi-Sensor Observations. E.U. Copernicus Marine Service Information (CMEMS). Marine Data Store (MDS). DOI: https://doi.org/10.48670/moi-00016

Notes: The global analysis system was used to study the ocean surface temperature from 2021 and 2025. To study surface temperature for previous years (1991 to 2020), it was used the ESA CCI data. The other observation-based sea surface temperature products (OSTIA, OI SST and Odyssea) were used for calculating monthly mean and uncertainty values for April 2026

 Marine Heatwaves

The results are obtained using the Copernicus Marine Service global systems including the analysis and forecasting system together with the reanalysis product.

  • GLOBAL_ANALYSISFORECAST_PHY_001_024 Global Ocean Physics Analysis and Forecast sea surface temperature. U. Copernicus Marine Service Information (CMEMS). Marine Data Store (MDS). DOI: https://doi.org/10.48670/moi-00016
  • GLOBAL_MULTIYEAR_PHY_001_030 Global Ocean Physics Reanalysis sea surface temperature. U. Copernicus Marine Service Information (CMEMS). Marine Data Store (MDS). DOI: https://doi.org/10.48670/moi-00021

Notes: The global analysis system was used to study MHWs for 2024 and 2025. To study MHWs for previous Aprils (1993 to 2023), it was used the reanalysis system. The reanalysis product was used for generating a daily climatology using the 30-year period from 1993 to 2022