Ocean Temperature Bulletin
August 2025

Mercator Ocean International (MOi) oceanographers examine marine heatwaves across the global ocean. They analyse a variety of datasets from observation analyses
(satellite sea surface temperature maps) to model analyses
(assimilating satellite and in situ observations) and model forecasts.¹

All images in this article can be used freely and should be credited with the following information :
Image source: European Union, Copernicus Marine Service Data 2025 © Mercator Ocean .

Key takeaway

Global Ocean: August 2025 is the third-warmest August on record
  • August 2025 was the 3rd warmest August on record, with a mean Sea Surface Temperature (SST) of 20.85 ± 0.07 °C — behind only 2024 and 2023. For the North Atlantic, August 2025 was the 6th warmest August month with a mean SST of 24.89 ± 0.08 °C.
  • August 2025 mean SSTs are above average for 70% of the global ocean (between 60°S and 60°N), with 12% exceeding the average by at least 1°C
European region: In the Mediterranean Sea, August 2025 is warmer than average, but not extreme for marine heatwave events.
  • Mediterranean Sea, August 2025 was warmer than average for this month, with a mean SST of 26.90 ± 0.10°C –a record of 28.11 ± 0.08°C was reached in 2024.
  • 77% of the Mediterranean Sea showed above-average SSTs, but unlike June and July, most of the basin remained near normal temeprature, with just 8% more than 1 °C above average.
  • In the Mediterranean Sea, August 2025 was not an extreme year for MHWs (in terms of surface, intensity and duration), especially when compared with Augusts of recent years.
  • For the North Atlantic, August 2025 was the 6th warmest August month with a mean SST of 24.89 ± 0.08 °C.


sea Surface Temperature

  • August 2025, at global level (between 60°S and 60°N), was the 3rd warmest August on record, with a mean Sea Surface Temperature (SST) of 20.85 ± 0.07 °C — behind only 2024 (20.94 ± 0.05 °C) and 2023 (21.01 ± 0.06 °C).
  • Regionally, for the Mediterranean Sea, August 2025 corresponded to a warmer than average August with a mean SST of 26.90 ± 0.10°C –a record of 28.11 ± 0.08°C was reached in 2024.
  • For the North Atlantic, August 2025 was the 6th warmest August month with a mean SST of 24.89 ± 0.08 °C.


August 2025 mean SSTs are above average for 70% of the global ocean (between 60°S and 60°N), with 12% exceeding the average by at least 1°C (mean SST anomaly map).
  • 77% of the Mediterranean Sea showed above-average SSTs, but unlike June and July, most of the basin remained near normal temeprature, with just 8% more than 1 °C above average.
  • The North Pacific Ocean showed widespread high SSTs at midlatitude, with a large region to the west with monthly SSTs 3°C above average. At lower latitudes, off Philippine and Papua New Guinea, temperatures are closer to average, reaching 1°C above average.
  •  The North Atlantic also showed above average SSTs, covering 72% of the area (between 0°N and 60°N). The highest anomalies are observed off western European coast, in the Gulf of Mexico and between Norwegian coast and Iceland (reaching more than 1.5°C above average).
  • In the Indian Ocean, SSTs were predominantly between 0.5°C to 1°C above average, with higher value along the Indonesian coast. The Arabian Sea showed under average SSTs, contrasting with SSTs observed in the Gulf of Bengal.
  • Note: In the central Pacific, along the equator, we observe a large area of below-average SSTs (reaching -1°C).

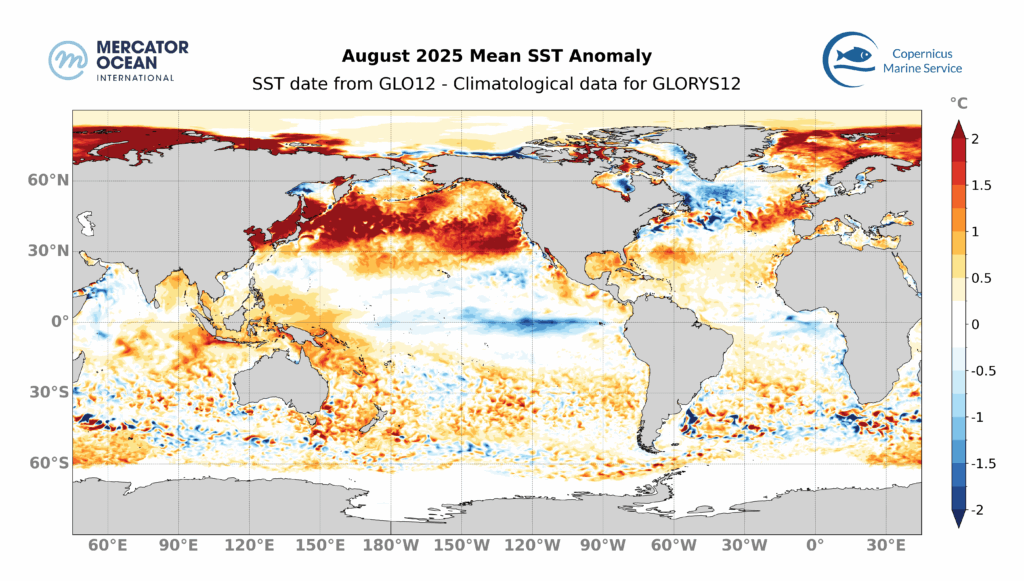
 August 2025 Mean SST Anomaly relative to a 30-year climatology (1993-2022), calculated using daily data from Mercator Ocean International’s GLO12 analysis and forecasting system for 2025 and from the GLORYS12 reanalysis for the climatological mean

Ongoing Marine Heatwaves

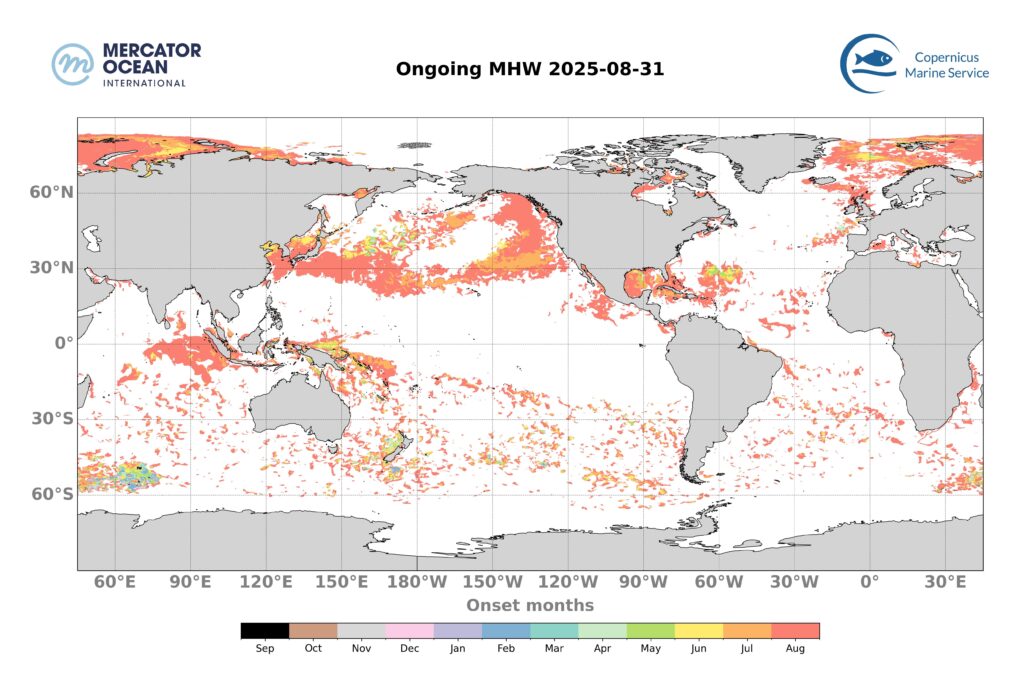
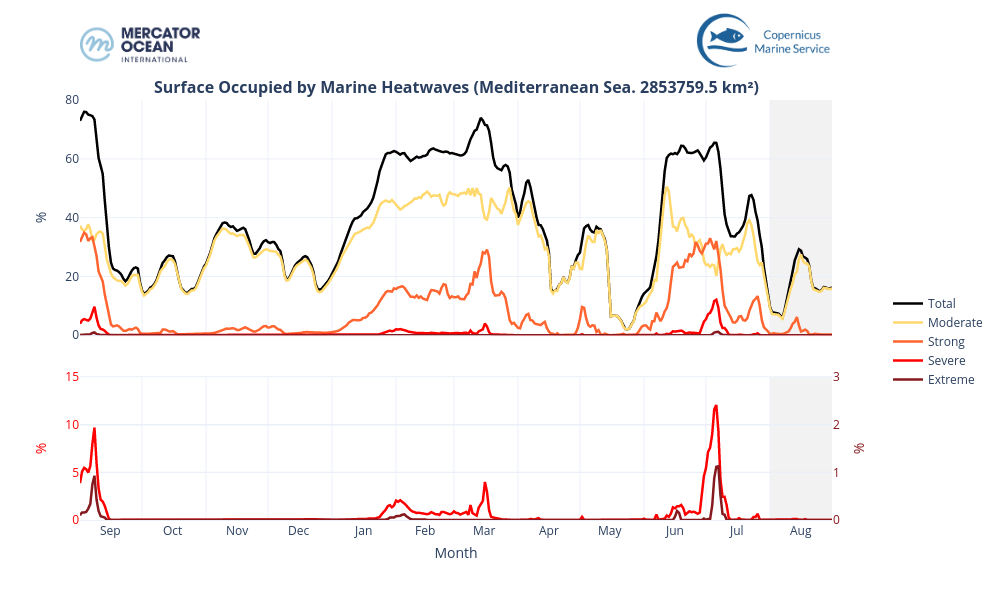
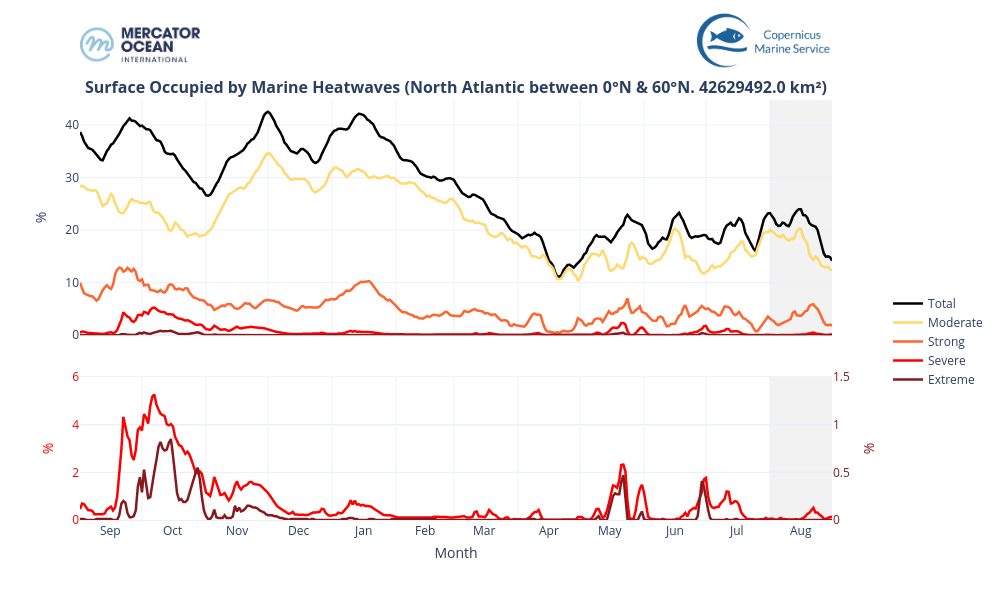
The duration of ongoing MHWs is monitored because prolonged events may induce important stress on marine ecosystems.

Ongoing Marine Heatwaves on August 31, 2025 :

  • 19% of the global ocean (between 60°S and 60°N) was affected by MHWs on the 31st of August.
  • The majority of these MHWs developed recently, with 14% of the global Ocean (between 60°S and 60°N) affected by MHWs less than 1 month old and more than 3% by events between 1- and 2-month-old.

Month of onset for the ongoing MHWs on the 31th August 2025. Colours indicate the month during which the MHW started. For instance, ocean pixels in red correspond to an MHW that developed during August 2025 and are less than one month old, in orange MHW between 1 and 2 months old, etc.


Total Surface Marine Heatwaves

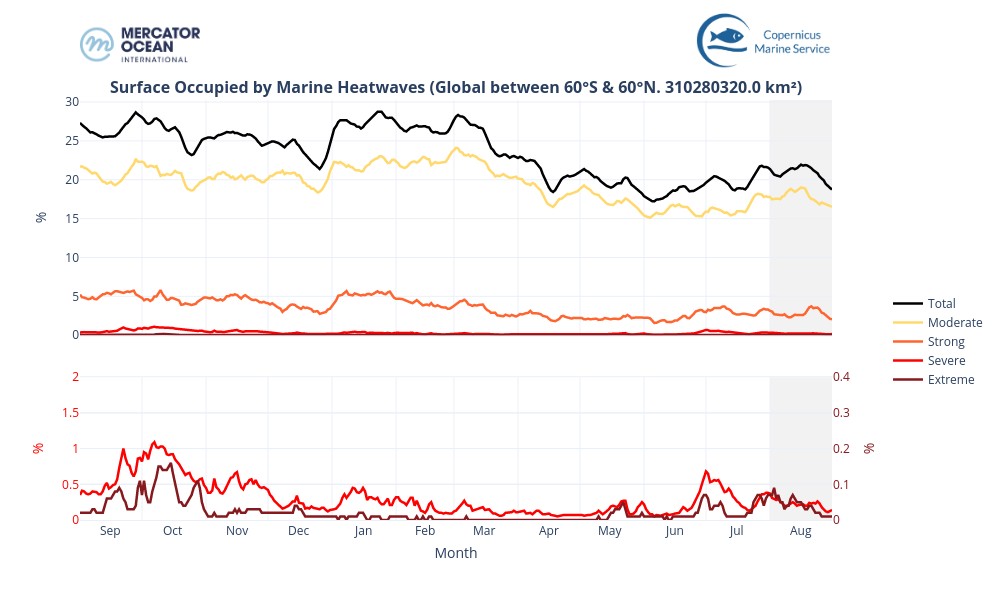
MHWs are classified into four categories: Moderate, Strong, Severe, and Extreme. We monitor daily the surface occupied by MHWs and show for the past year (since September 2024) the proportion of the global Ocean (between 60°S and 60°N) exposed to MHWs. We focus on the evolution over the past August 2025 (grey bar).

Global Ocean
  • The total surface of MHW (black line) decreased from 21% to 19% of the global ocean (between 60°S and 60°N).
  • These MHWs consist mainly of moderate and strong events (17% and 2%, respectively, by the end of the month).
  • For comparison, in August 2024, MHW total extent decreased from 29% and 27% of the global ocean (between 60°S and 60°N).

Mediterranean Sea
  • For the Mediterranean Sea, the total MHW surface increased from 8% to 16% of the basin, with a peak at 29% mid-August.
  • These MHW events mainly consist of moderate categories, with strong ones occurring during the peak (6%).
  • For comparison, in August 2024, the total MHW extent varied between 58% and 74%, with the surface of strong and extreme categories peaking at 32% and 6%, respectively (not shown).


North Atlantic (between 0°N and 60°N)
  • For the North Atlantic (between 0°N and 60°N), the total MHW surface fluctuated between 15% and 23% during the month of August 2025.
  • These events consist mostly of moderate and strong categories.
  • For comparison, in August 2024, the total MHW extent decreased from 48% to 40%, with mostly moderate and strong categories (not shown).

Total Number Marine Heatwaves

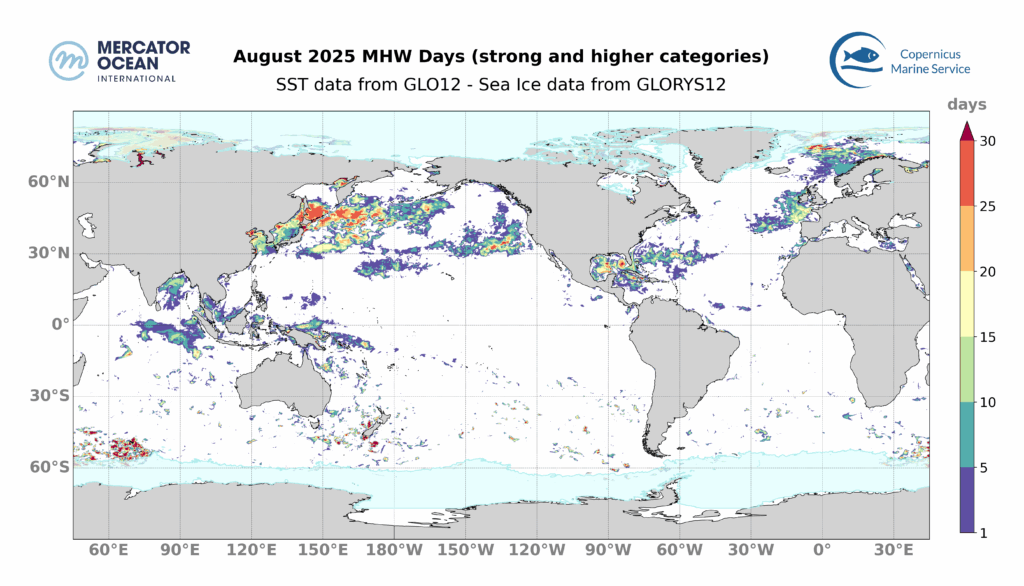
We monitor the number of MHW days to highlight the region often impacted or impacted by long MHW. Longer and more regular MHWs increase heat stress on marine ecosystems, especially intense MHW (i.e. MHW of strong or higher category). Here we look at the total number of days where a MHW of strong or higher category occurred during August 2025. For instance, ocean regions in light green correspond to areas where a total of 10 to 15 days of strong or higher MHW were observed during the month of August of 2025.

  • 13% of the surface of the ocean was impacted by strong, or higher, MHW conditions for at least 1 day during August 2025. This is the 4th widest extent after 2015, 2024 and 2023 (15%, 23% and 25%, respectively). The northern Pacific Ocean, the northern and western European region and the Gulf of Mexico are the most affected (Figure 7).
  • Regionally, 18% of the North Atlantic (between 0°N and 60°N) was impacted by strong, or higher, MHW conditions for at least 1 day, which is the 3rd widest extent after 2024 and 2023 (45% and 61%, respectively).
August 2025 Marine Heatwave Days
Number of MHW days of strong and higher category in August 2025. Blank areas mean that no MHW of strong or higher category happened during the month. Blue shaded areas in the polar regions represent the sea ice maximum from the climatological period (1993-2022).  Monitoring SST extremes with the MHW categorization approach as used here is not best suited for such regions.


Year by year evolution of the surface impacted by strong and higher MHW during months of August. The size of the bar represents the proportion of the global ocean (60°S to 60°N) exposed to a strong or higher MHW during the month. As indicated by the colours, the proportion exposed to such MHWs is categorized according to the number of days impacted during the month.

Statistics

August 2025 :  Marine Heatwave Statistics

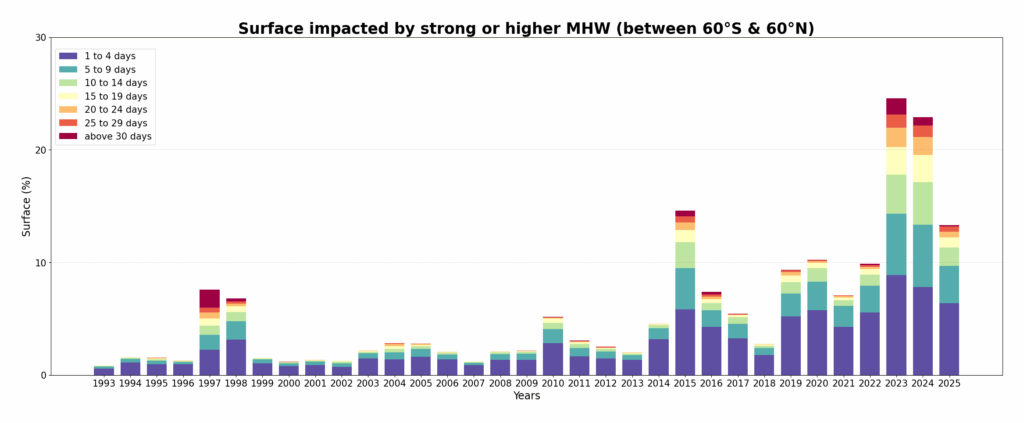
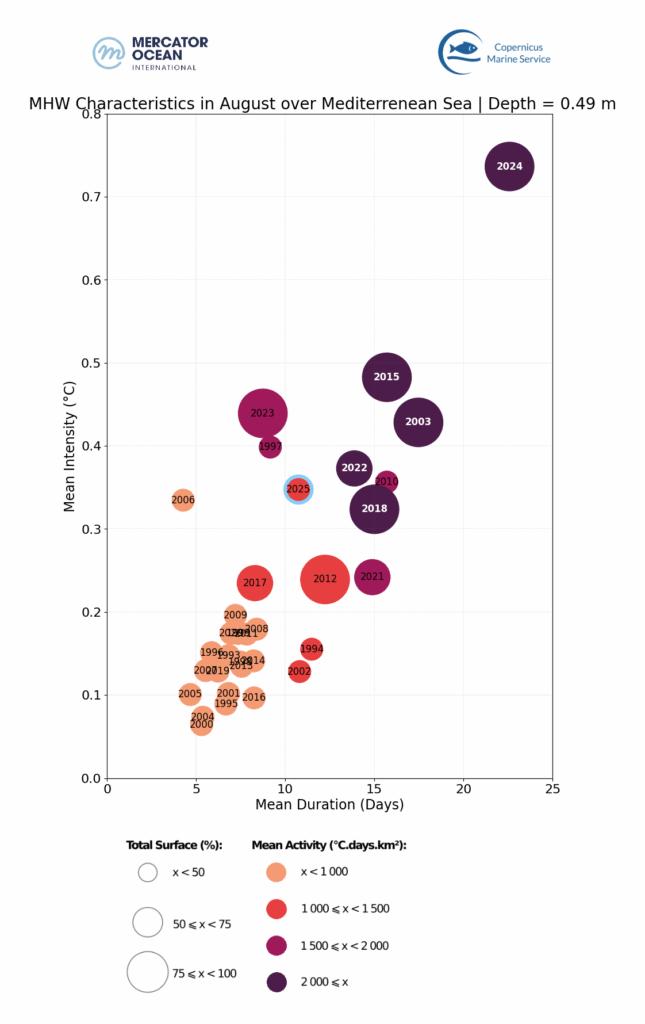
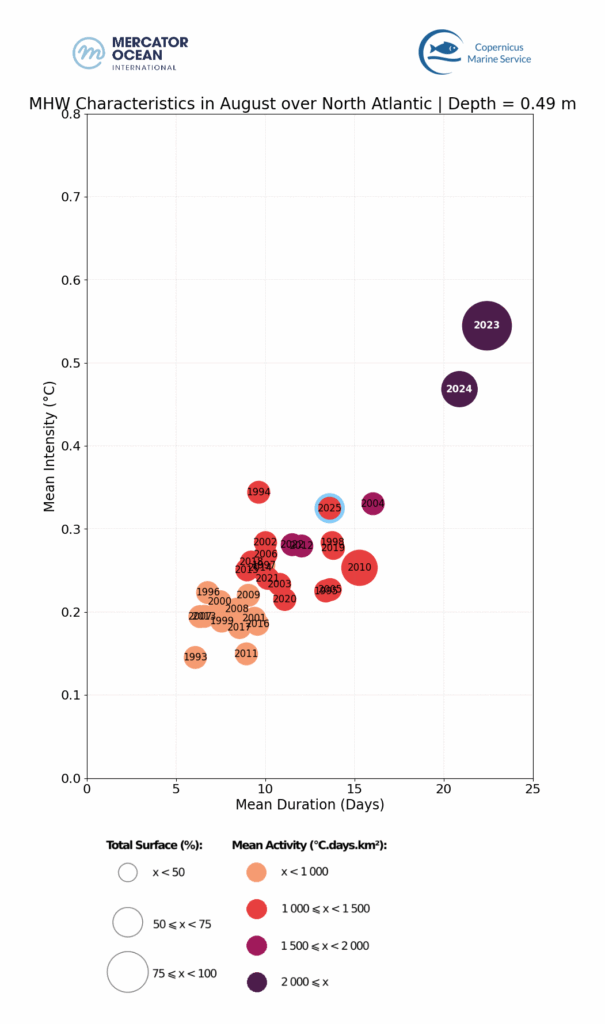
The MHW statistics (MHW duration, intensity, surface occupied and activity) for August 2025 are compared to those for August months from previous years (since 1993).

  • On a global scale, August 2025 is the 5th most extreme August month in terms of MHW after 2015, 2024, 1997 and 2023.
  • In the Mediterranean Sea, August 2025 was not an extreme year for MHWs (in terms of surface, intensity and duration), especially when compared with Augusts of recent years.
  • In the North Atlantic, August 2025 is the 5th most extreme August in terms of MHW.


MHW Characteristics for August months from 1993 to 2025. Duration, intensity, extent and activity averaged for each August month between 1993 and 2025 for the global ocean (top), for the Mediterranean Sea (center) and the North Atlantic Ocean (bottom). August 2025 is highlighted with a blue edge.

About the Bulletin

Mercator Ocean International publishes a monthly sea surface temperature bulletin reporting on mean temperature and marine heatwave conditions for the month just passed. It includes:

  • Regions where MHWs are present and the time these events started,
  • Timeseries showing the total surface occupied by MHWs globally and for the European region,
  • The total number of days of exposure to MHW during the month (including only strong and higher intensity categories).


Data sets and products

Sea Surface Temperature

The results are obtained using the Copernicus Marine Service global analysis and forecasting system together with observation-based products.

  • GLOBAL_ANALYSISFORECAST_PHY_001_024 Global Ocean Physics Analysis and Forecast sea surface temperature. U. Copernicus Marine Service Information (CMEMS). Marine Data Store (MDS). DOI: https://doi.org/10.48670/moi-00016
  • ESA SST CCI reprocessed sea surface temperature analyses. E.U. Copernicus Marine Service Information (CMEMS). Marine Data Store (MDS). DOI: https://doi.org/10.48670/moi-00169
  • NOAA OI SST V2 High Resolution Dataset data provided by the NOAA PSL, Boulder, Colorado, USA, from their website at https://psl.noaa.gov, Huang, B., C. Liu, V. Banzon, E. Freeman, G. Graham, B. Hankins, T. Smith, and H.-M. Zhang, 2021: Improvements of the Daily Optimum Interpolation Sea Surface Temperature (DOISST) Version 2.1, Journal of Climate, 34, 2923-2939. doi: 10.1175/JCLI-D-20-0166.1
  • Global Ocean OSTIA Sea Surface Temperature and Sea Ice Analysis. E.U. Copernicus Marine Service Information (CMEMS). Marine Data Store (MDS). DOI: https://doi.org/10.48670/moi-00165
  • ODYSSEA Global Sea Surface Temperature Gridded Level 4 Daily Multi-Sensor Observations. E.U. Copernicus Marine Service Information (CMEMS). Marine Data Store (MDS). DOI: https://doi.org/10.48670/moi-00016

Notes: The global analysis system was used to study the ocean surface temperature from 2021 and 2025. To study surface temperature for previous years (1991 to 2020), it was used the ESA CCI data. The other observation-based sea surface temperature products (OSTIA, OI SST and Odyssea) were used for calculating monthly mean and uncertainty values for March 2025.

 Marine Heatwaves

The results are obtained using the Copernicus Marine Service global systems including the analysis and forecasting system together with the reanalysis product.

  • GLOBAL_ANALYSISFORECAST_PHY_001_024 Global Ocean Physics Analysis and Forecast sea surface temperature. U. Copernicus Marine Service Information (CMEMS). Marine Data Store (MDS). DOI: https://doi.org/10.48670/moi-00016
  • GLOBAL_MULTIYEAR_PHY_001_030 Global Ocean Physics Reanalysis sea surface temperature. U. Copernicus Marine Service Information (CMEMS). Marine Data Store (MDS). DOI: https://doi.org/10.48670/moi-00021

Notes: The global analysis system was used to study MHWs for 2024 and 2025. To study MHWs for previous March (1993 to 2023), it was used the reanalysis system. The reanalysis product was used for generating a daily climatology using the 30-year period from 1993 to 2022