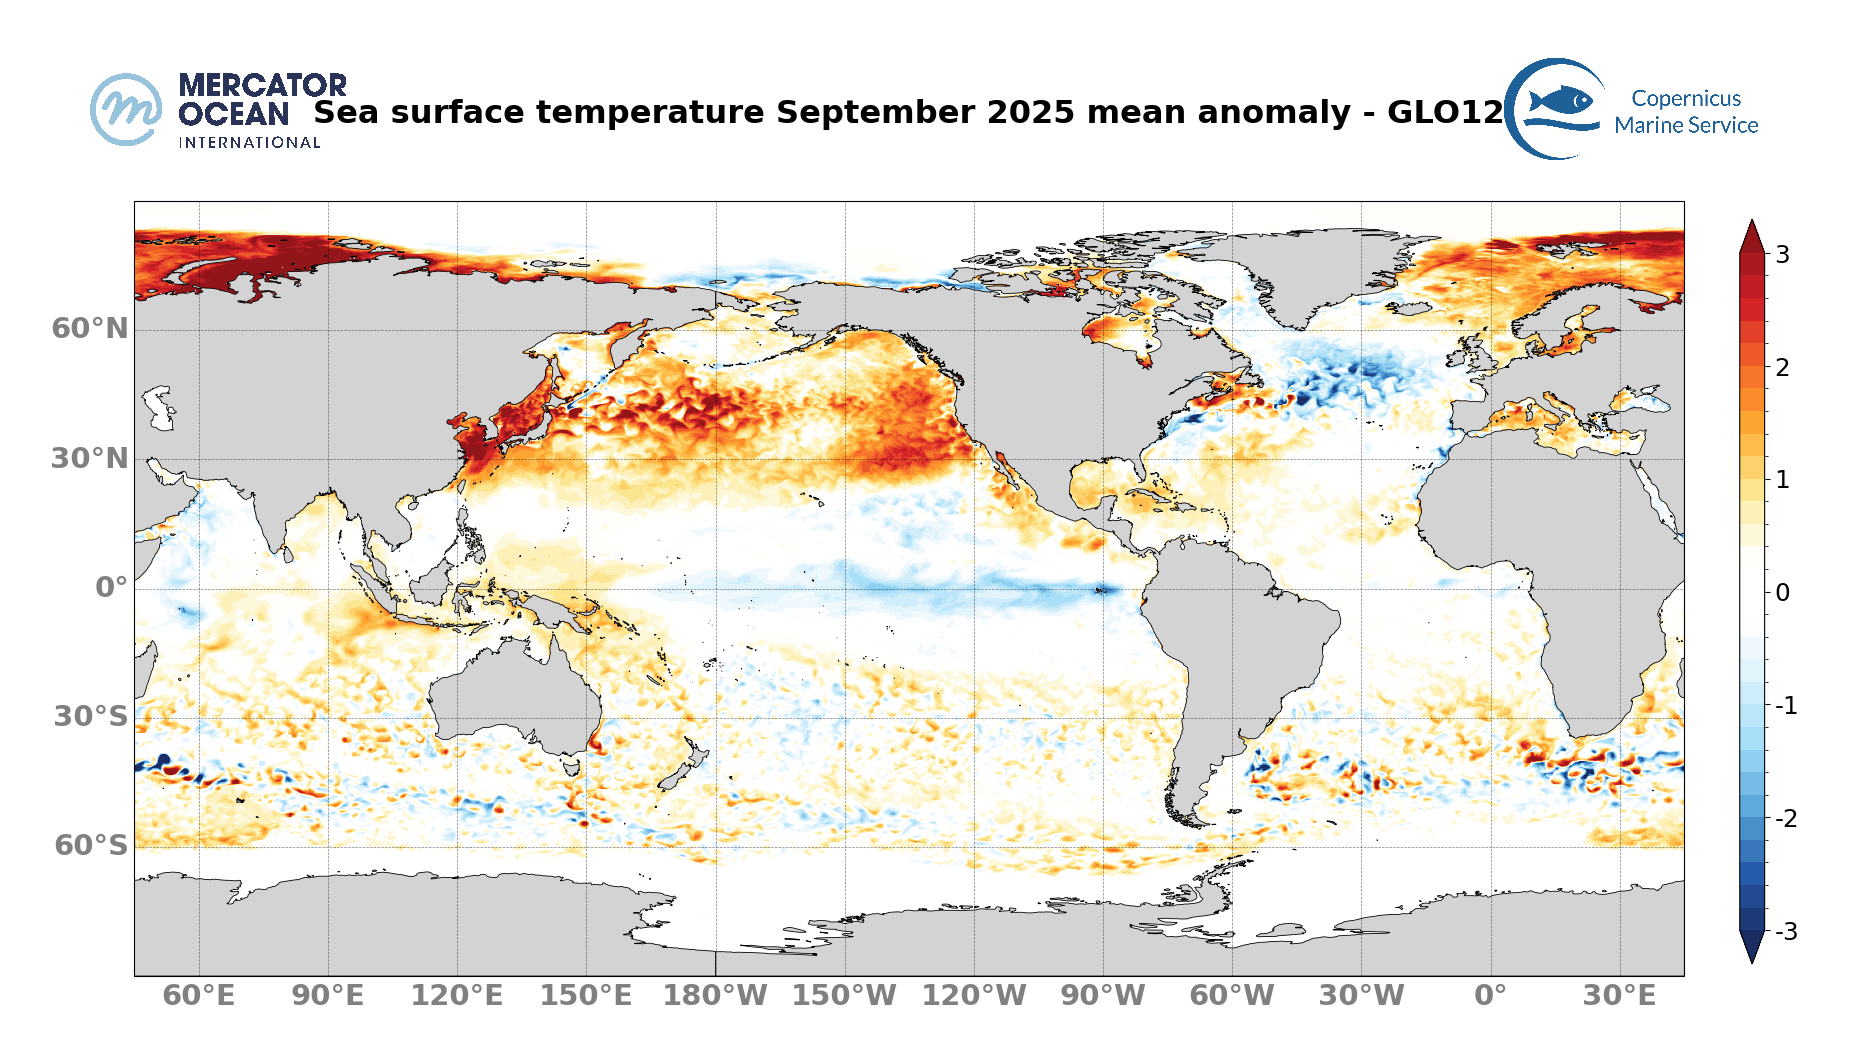
September 2025 mean SSTs are above average for 68% of the global ocean (between 60°S and 60°N), with 11% exceeding the average by at least 1°C (Figure 2).
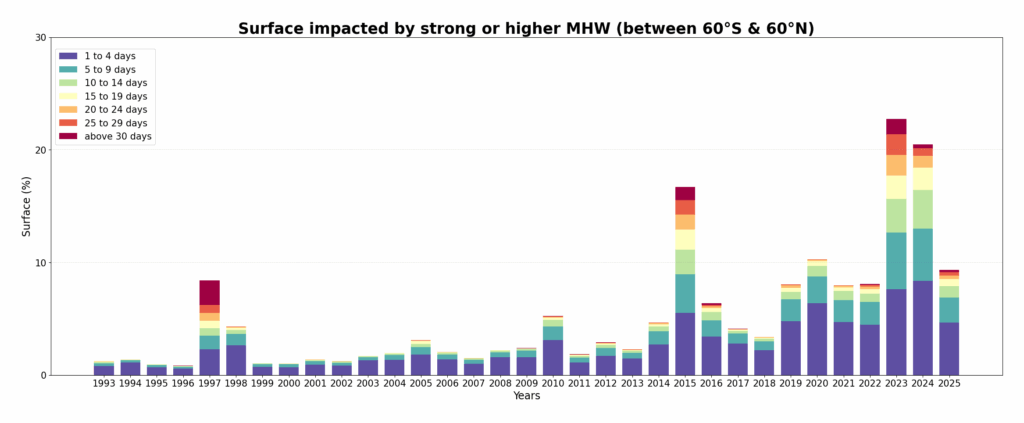
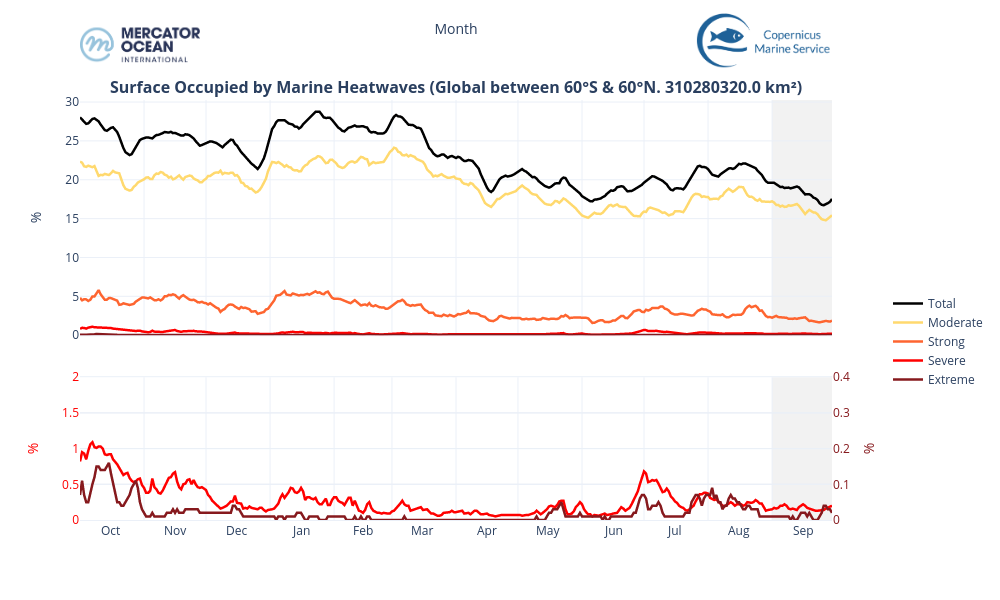
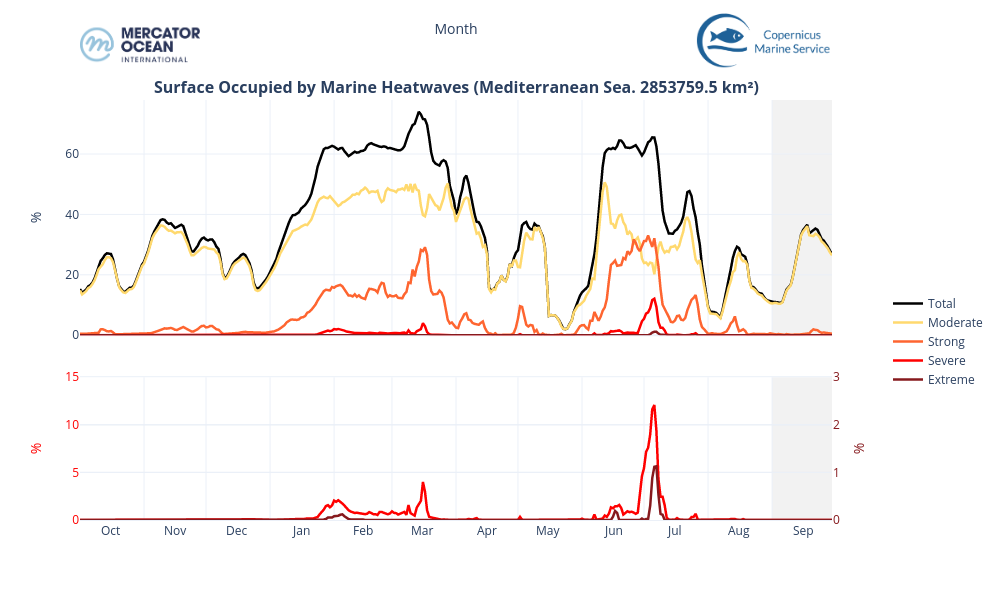
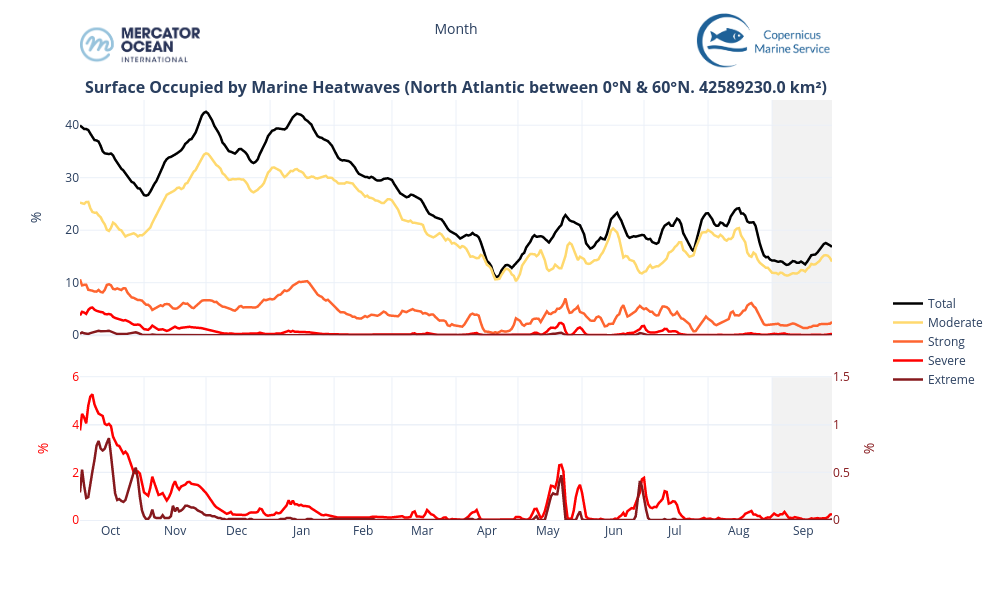
Surface occupied by MHWs in the n the global ocean (between 60°S and 60°N), in the Mediterranean Sea and in the North Atlantic (between 0°N and 60°N) between October 2024 and September 2025 based on daily monitoring. The black solid line represents the total surface of MHW, while the colored lines represent the surface of each MHW category. The gray background highlights the month of September 2025
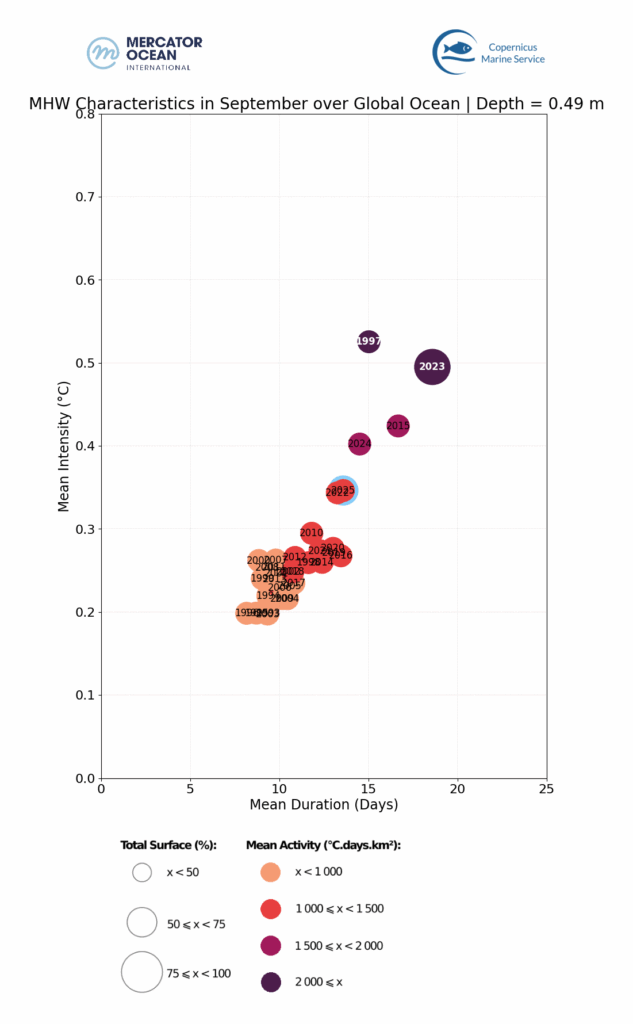
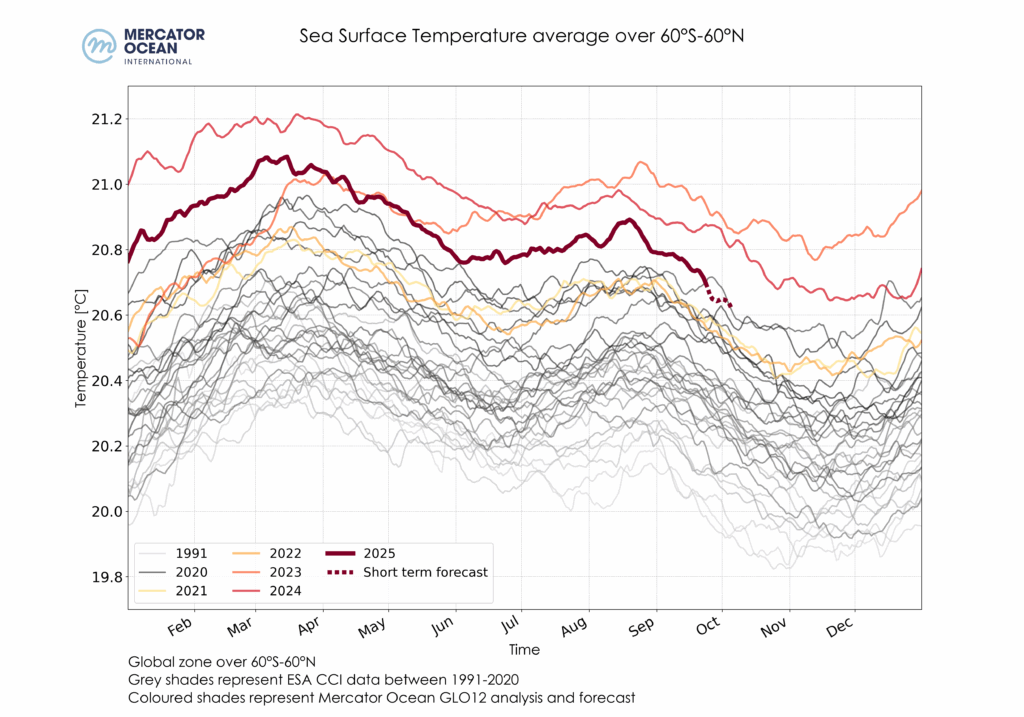
Global Ocean
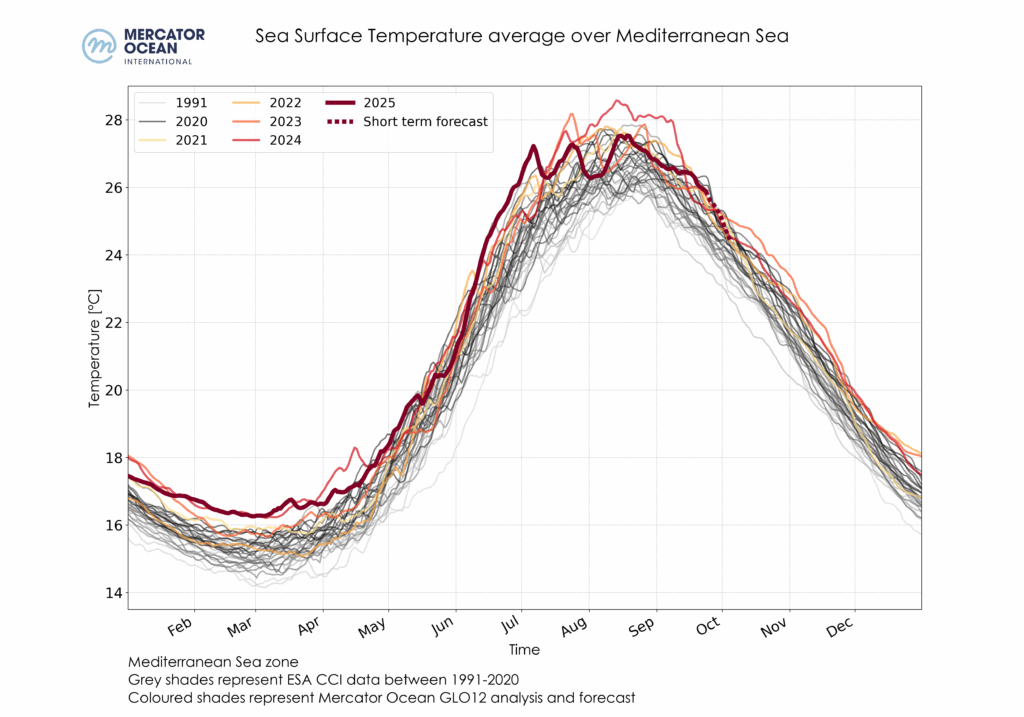
Mediterranean Sea
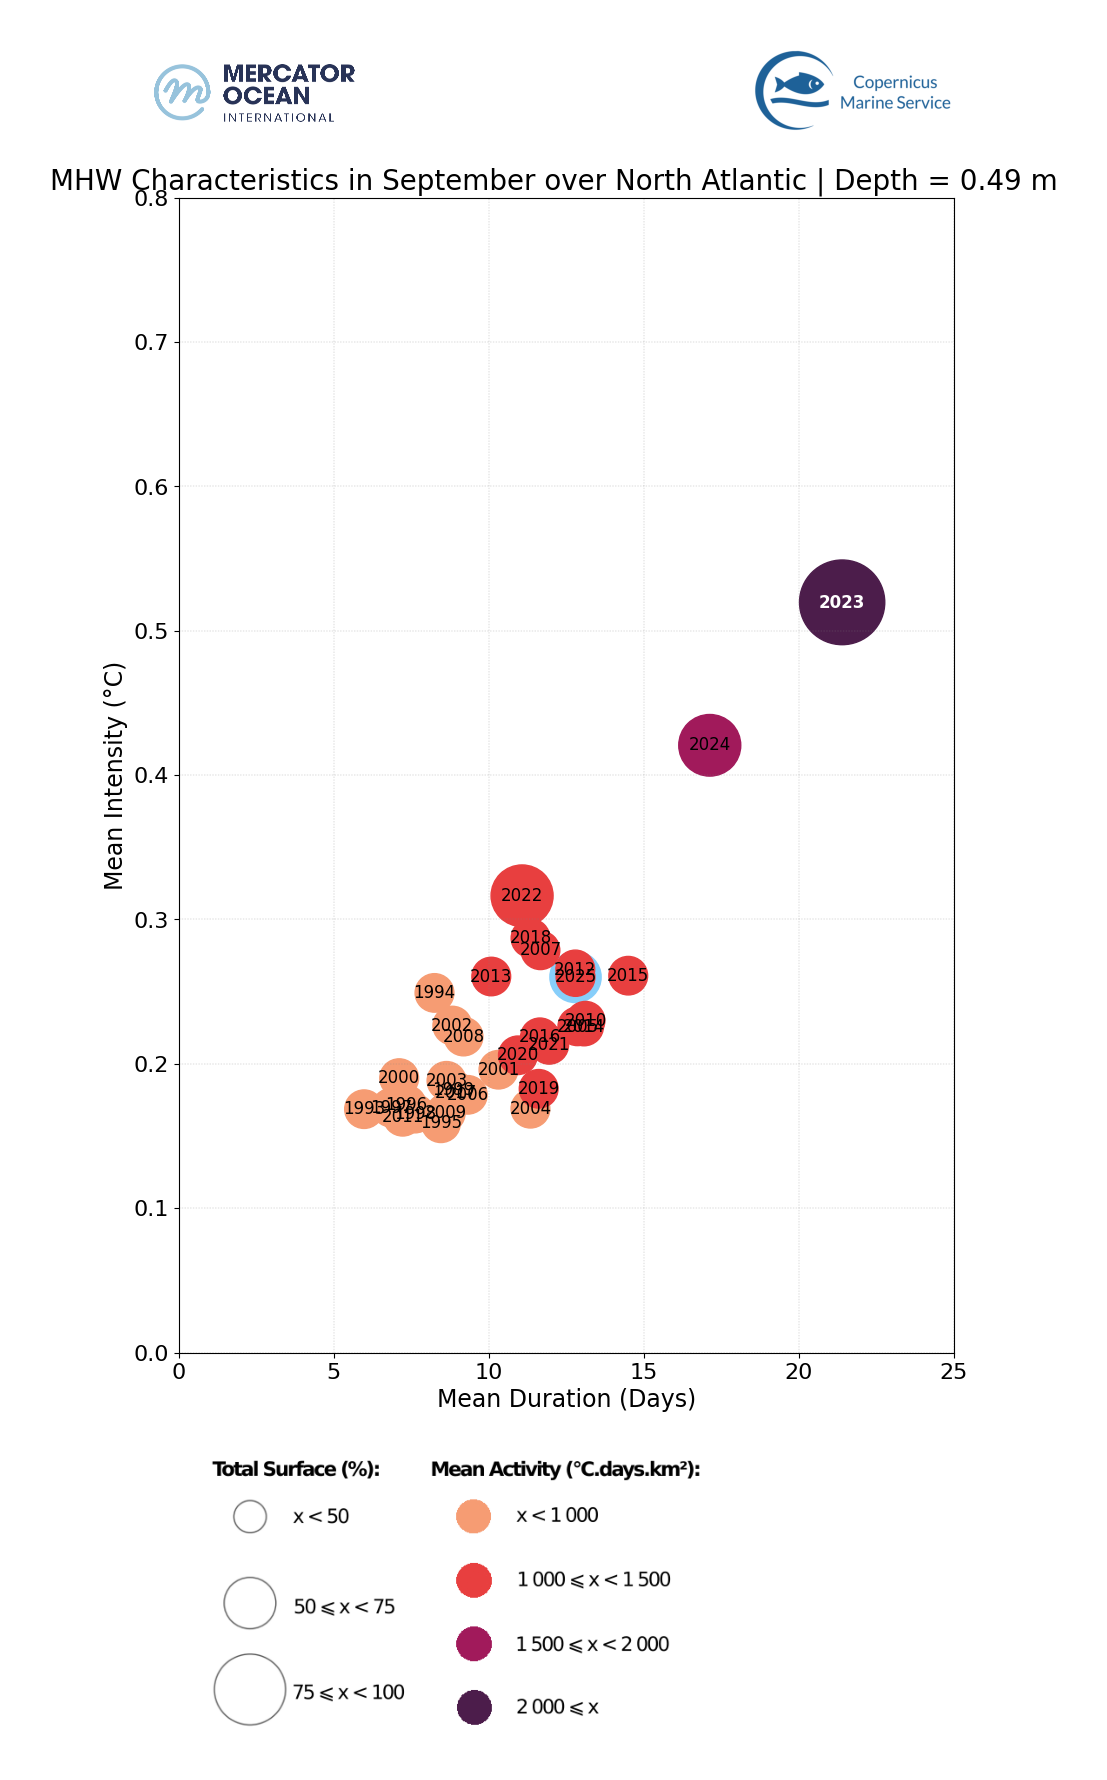
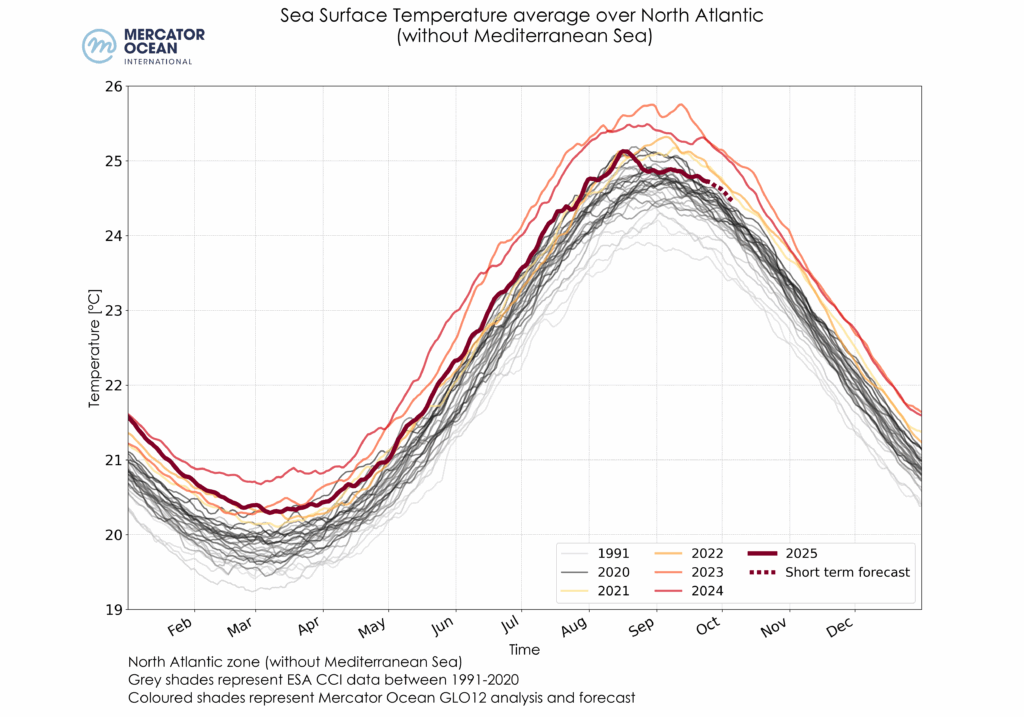
North Atlantic
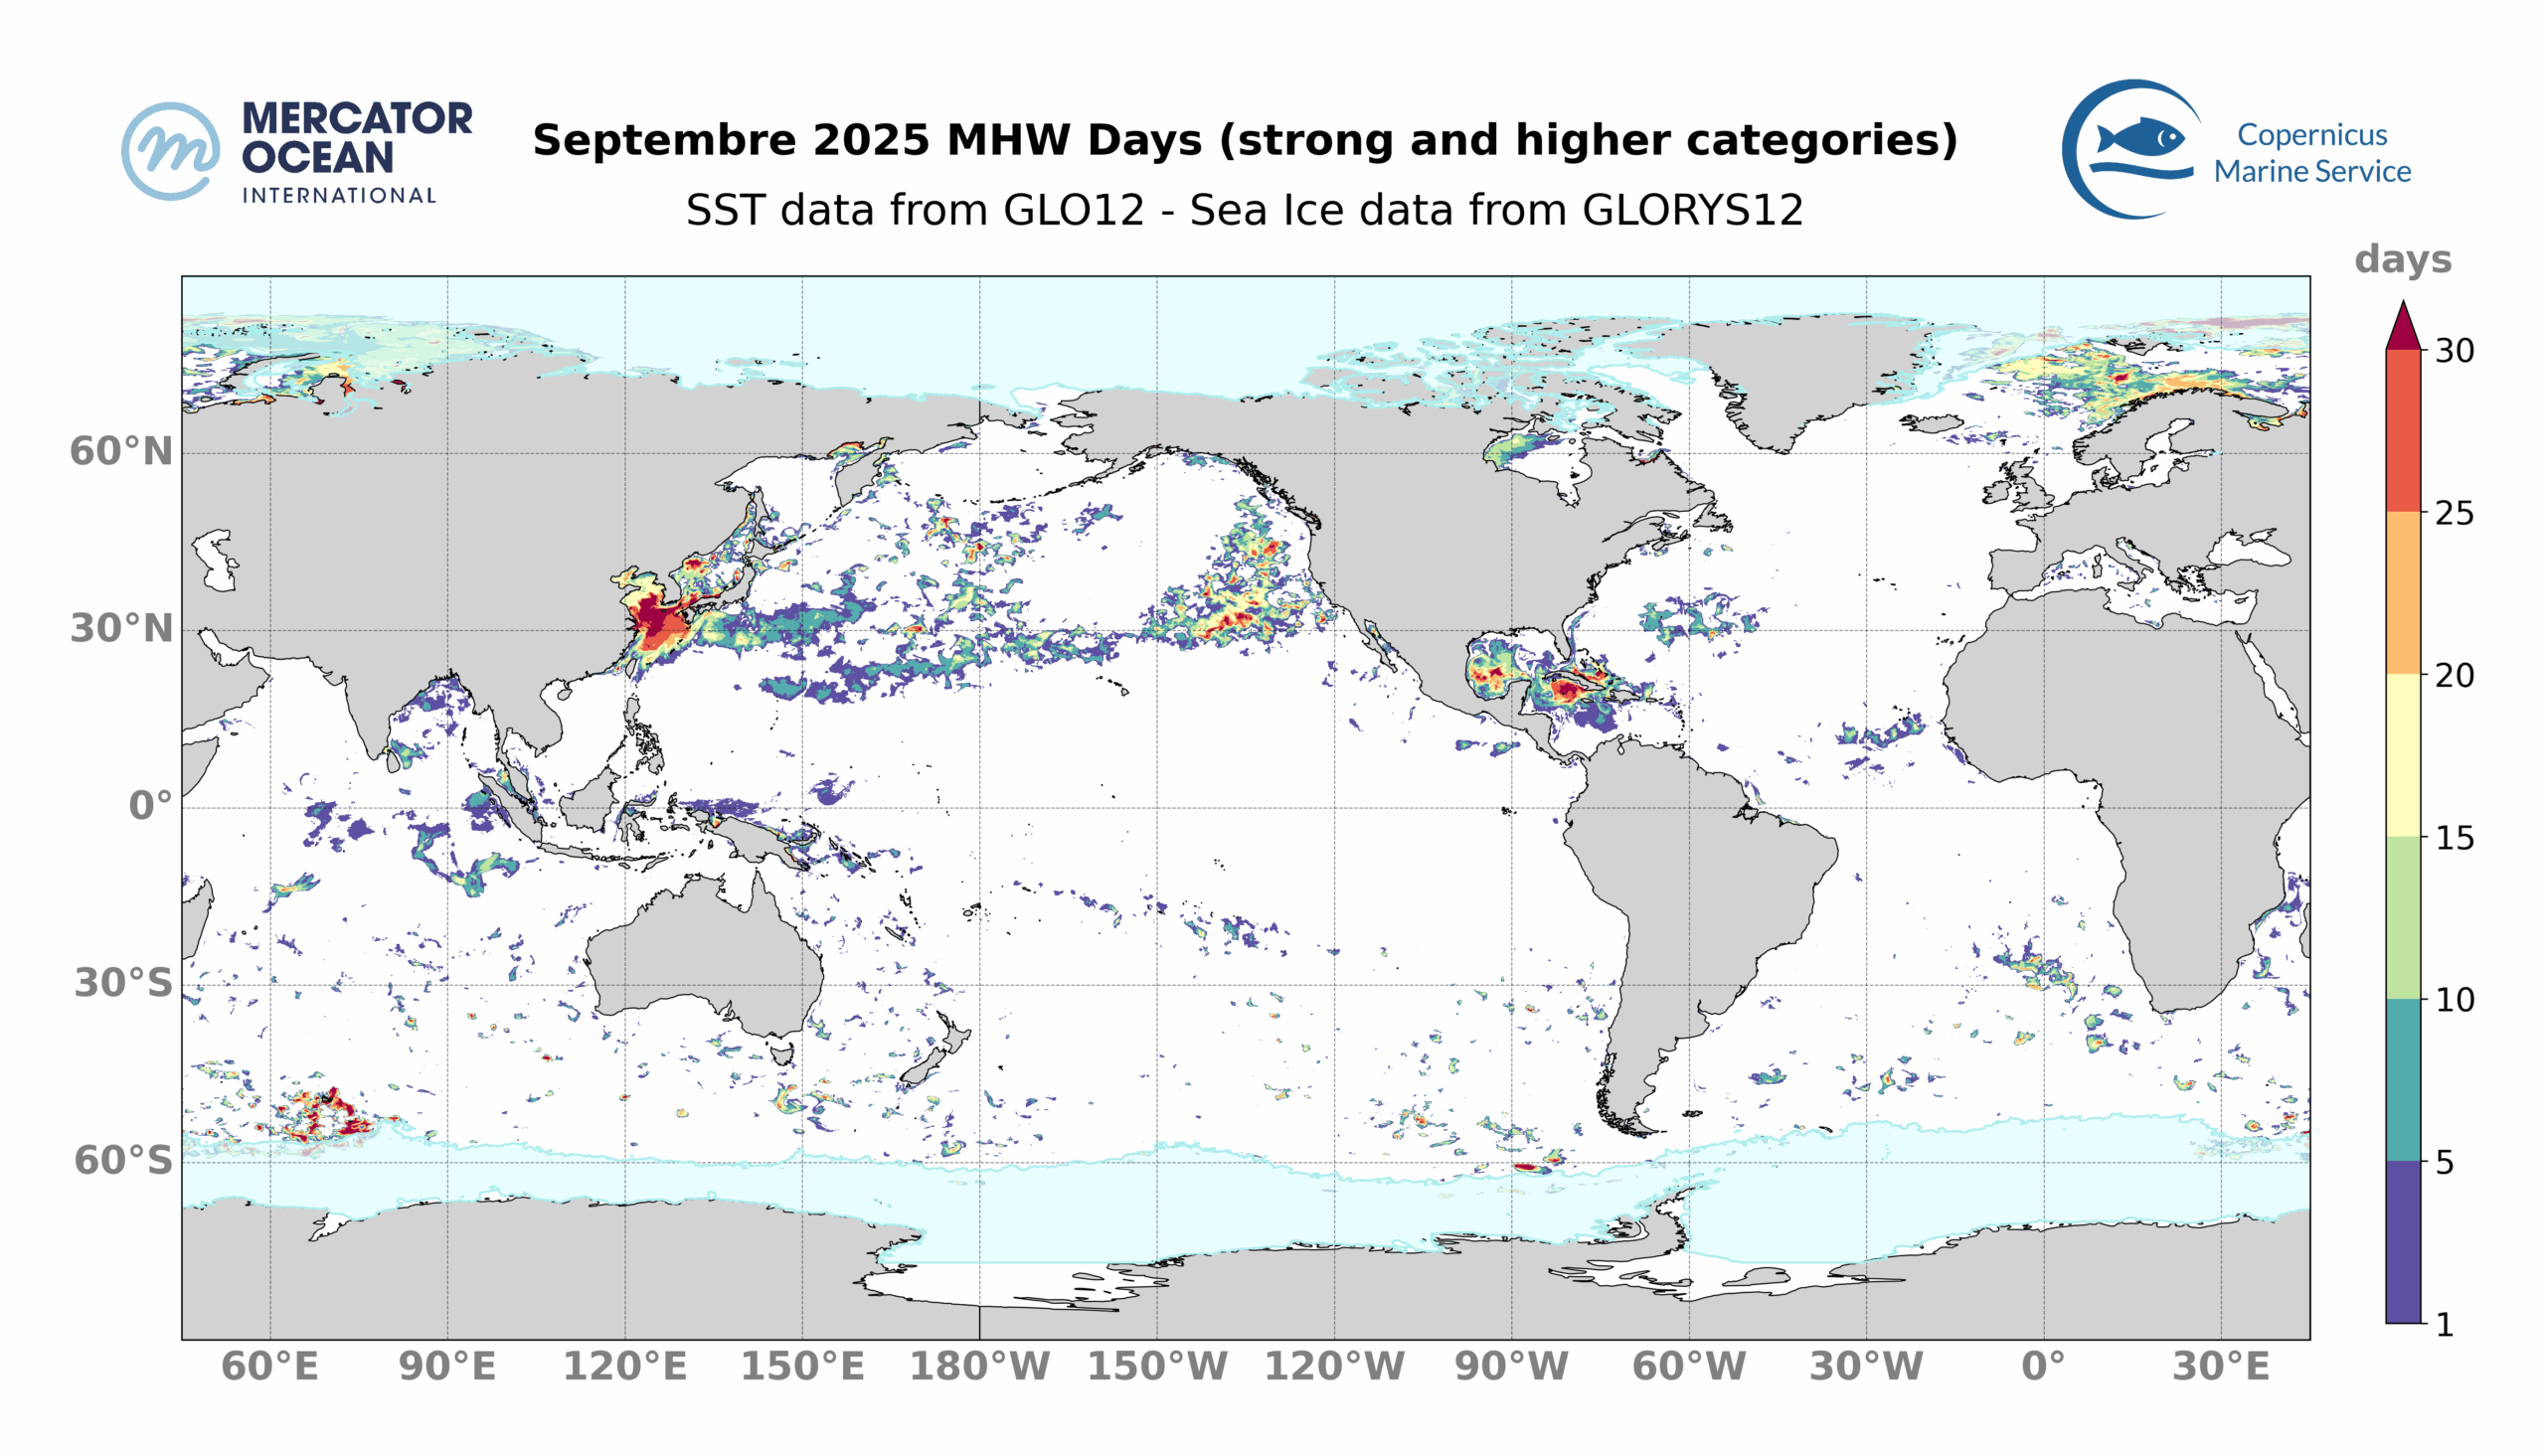
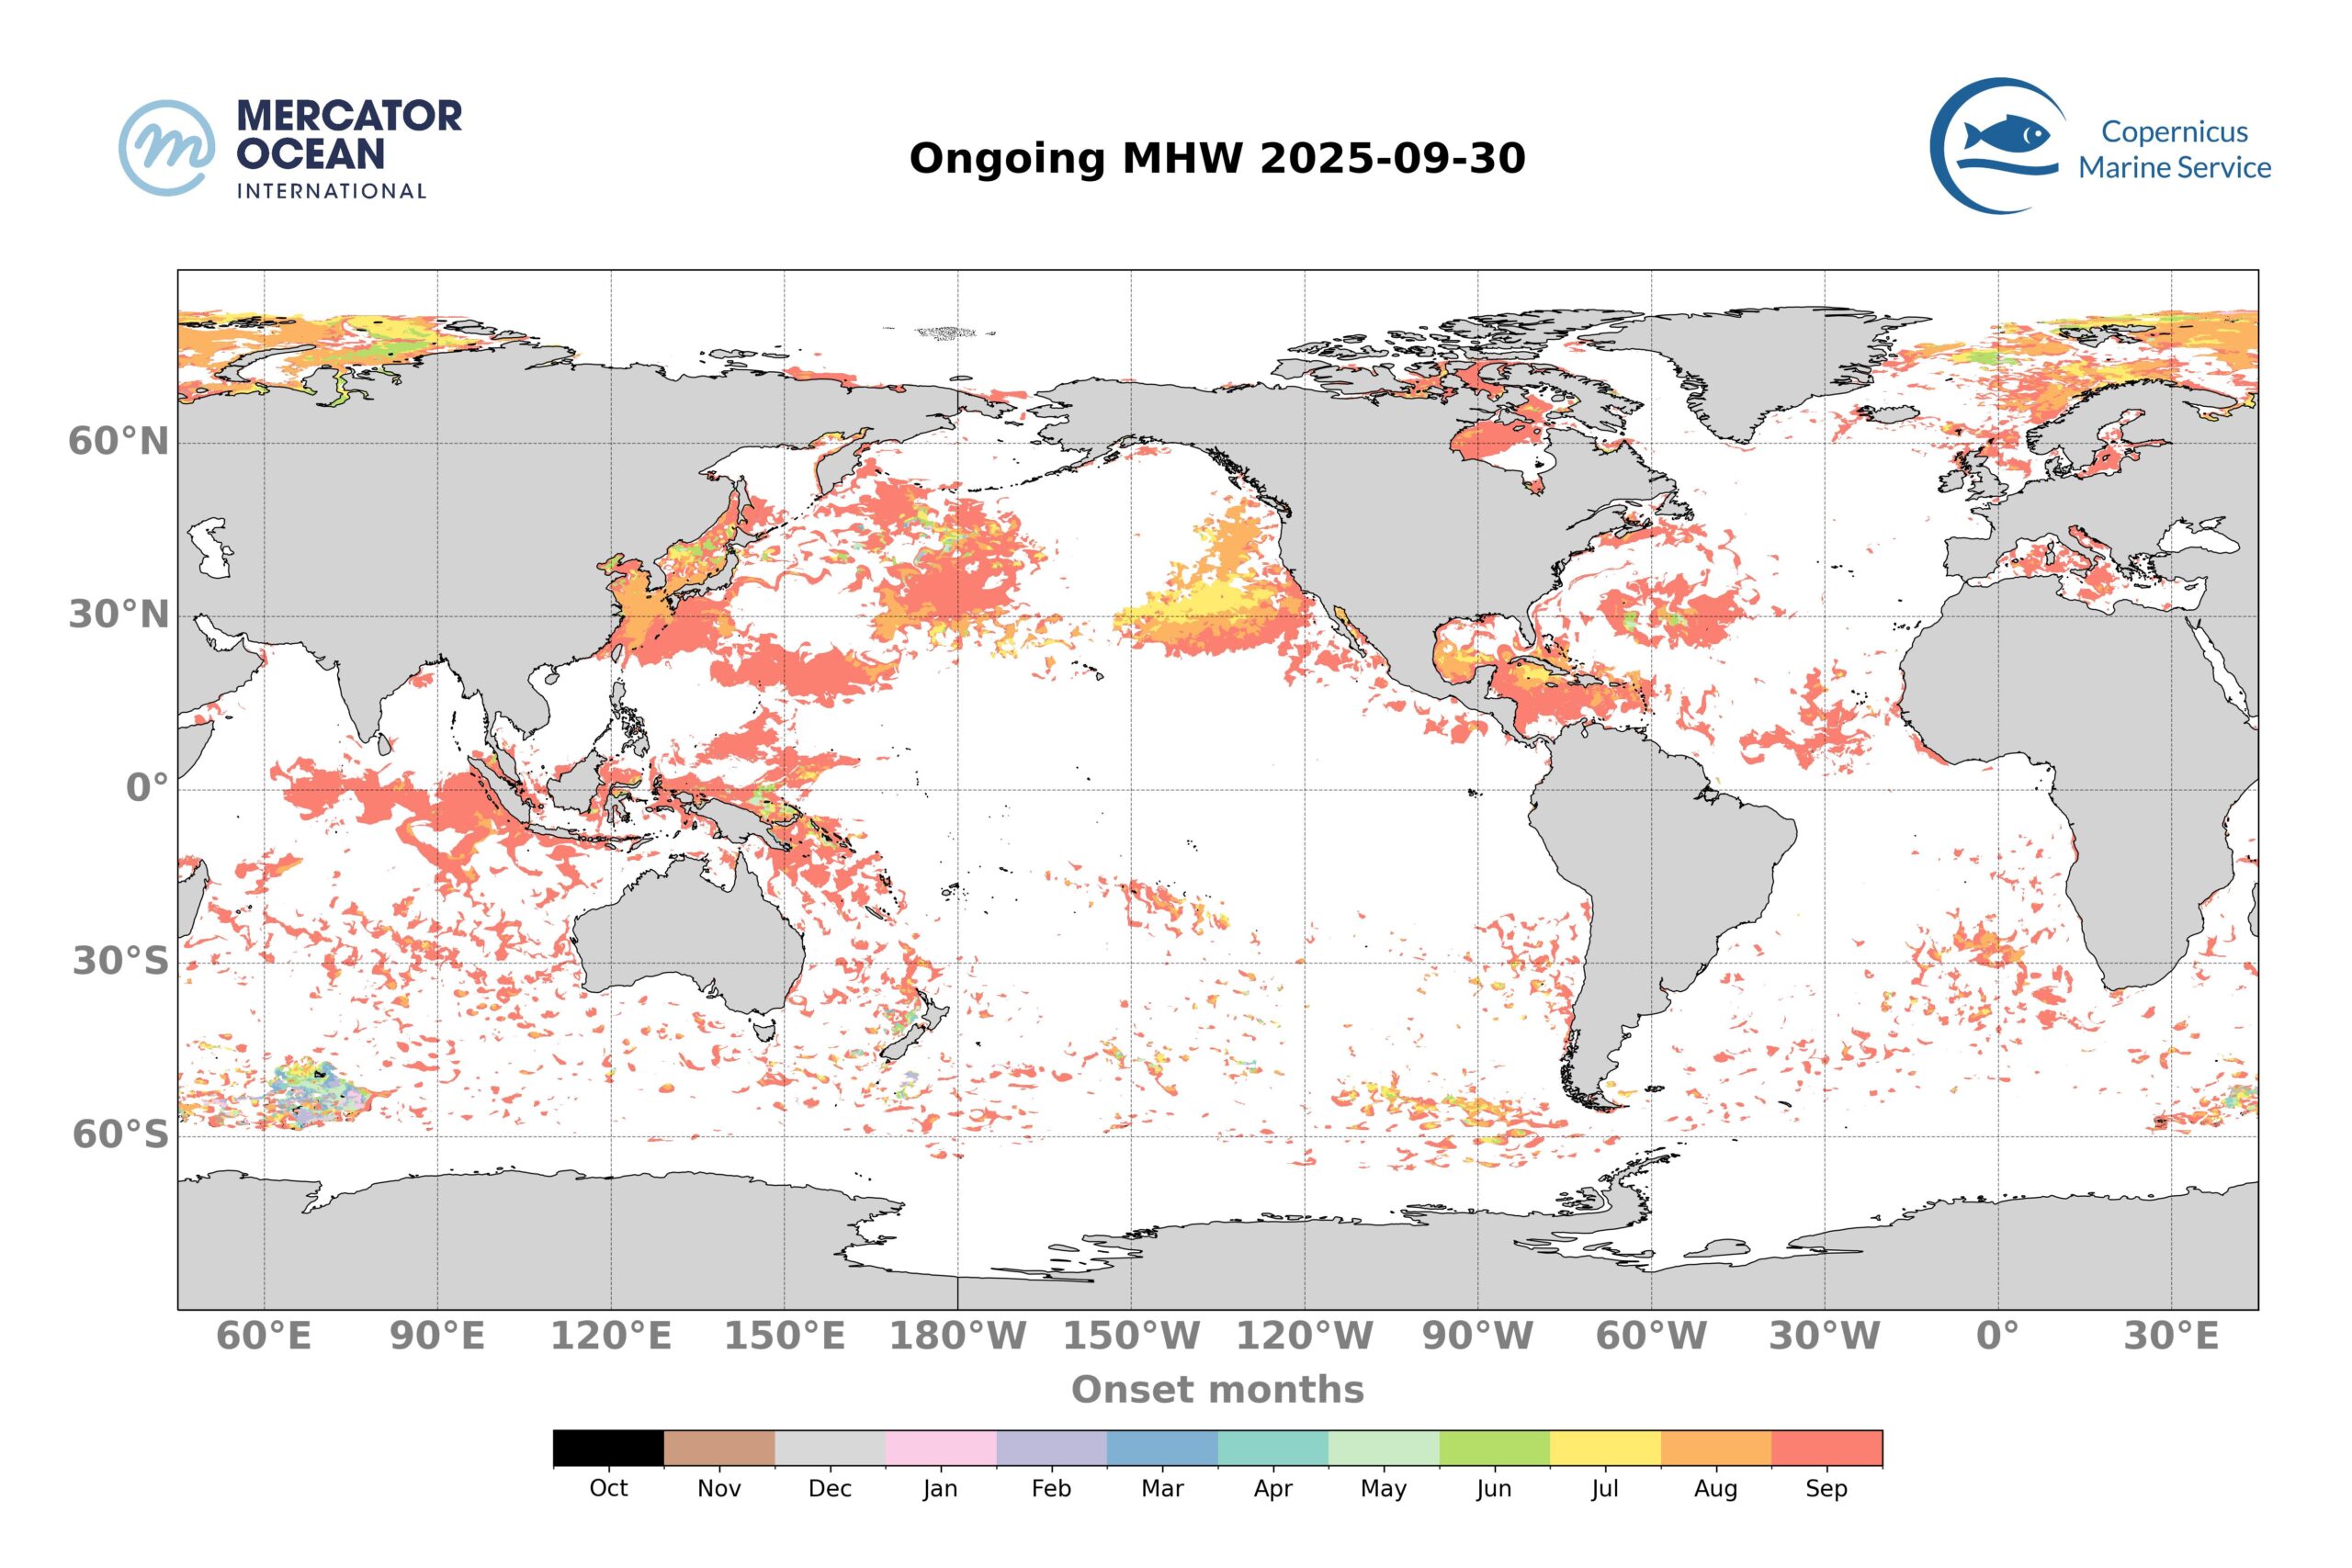
Marine heatwave days are monitored globally to highlight the region often impacted or impacted by long MHWs. Longer and more regular MHWs increase heat stress on marine ecosystems, especially intense MHW (i.e. MHW of strong or higher category). Analysis focuses on MHWs of strong or higher category which occurred in September 2025. Ocean regions in light green correspond to areas where a total of 10 to 15 days of strong or higher MHW were observed during the month of September of 2025.