Ocean Temperature Bulletin
October 2025

Mercator Ocean International (MOi) oceanographers examine marine heatwaves across the global ocean. They analyse a variety of datasets from observation analyses
(satellite sea surface temperature maps) to model analyses
(assimilating satellite and in situ observations) and model forecasts.¹

All images in this article can be used freely and should be credited with the following information :
Image source: European Union, Copernicus Marine Service Data 2025 © Mercator Ocean .

Key takeaway

  • October 2025 was the 4th warmest October on record with a mean sea surface temperature (SST) of 20.59 ± 0.08°C (between 60°S and 60°N).
  • In the North Atlantic, October 2025 was the 5th warmest October month with a mean SST of 24.17 ± 0.05 °C and the 3rd warmes
  • In the Mediterranean Sea, October 2025 SST ranks within the 10 warmest Octobers of the past 33 years.
  • Marine heatwave events during the past month ranked the 5th most extreme, after 2024, 2015,2024,1997 and 2023.

sea Surface Temperature

  • October 2025, at global level (between 60°S and 60°N), was the 4th warmest October on record, with a mean Sea Surface Temperature (SST) of 20.59 ± 0.08°C — behind 2015 (20.62 ± 0.12), 2024 (20.74 ± 0.07 °C) and 2023 (20.83 ± 0.06 °C).
  • In the Mediterranean Sea, October 2025 SST ranks within the warmest third of the past 33 years, with a mean SST of 23.57 ± 0.24°C — the record of 24.44 ± 0.08°C was reached in 2023.
  • For the North Atlantic, October 2025 was the 5th warmest October month with a mean SST of 24.17 ± 0.05 °C.

Daily sea surface temperatures averaged for the global ocean (top), the Mediterranean Sea (middle) and the North Atlantic Ocean (bottom) between 1991-2020 using ESA’s Climate Change Initiative (grey shades), and between 2021-2025 (colored shades) using Mercator Ocean International’s GLO12 analysis and forecast.

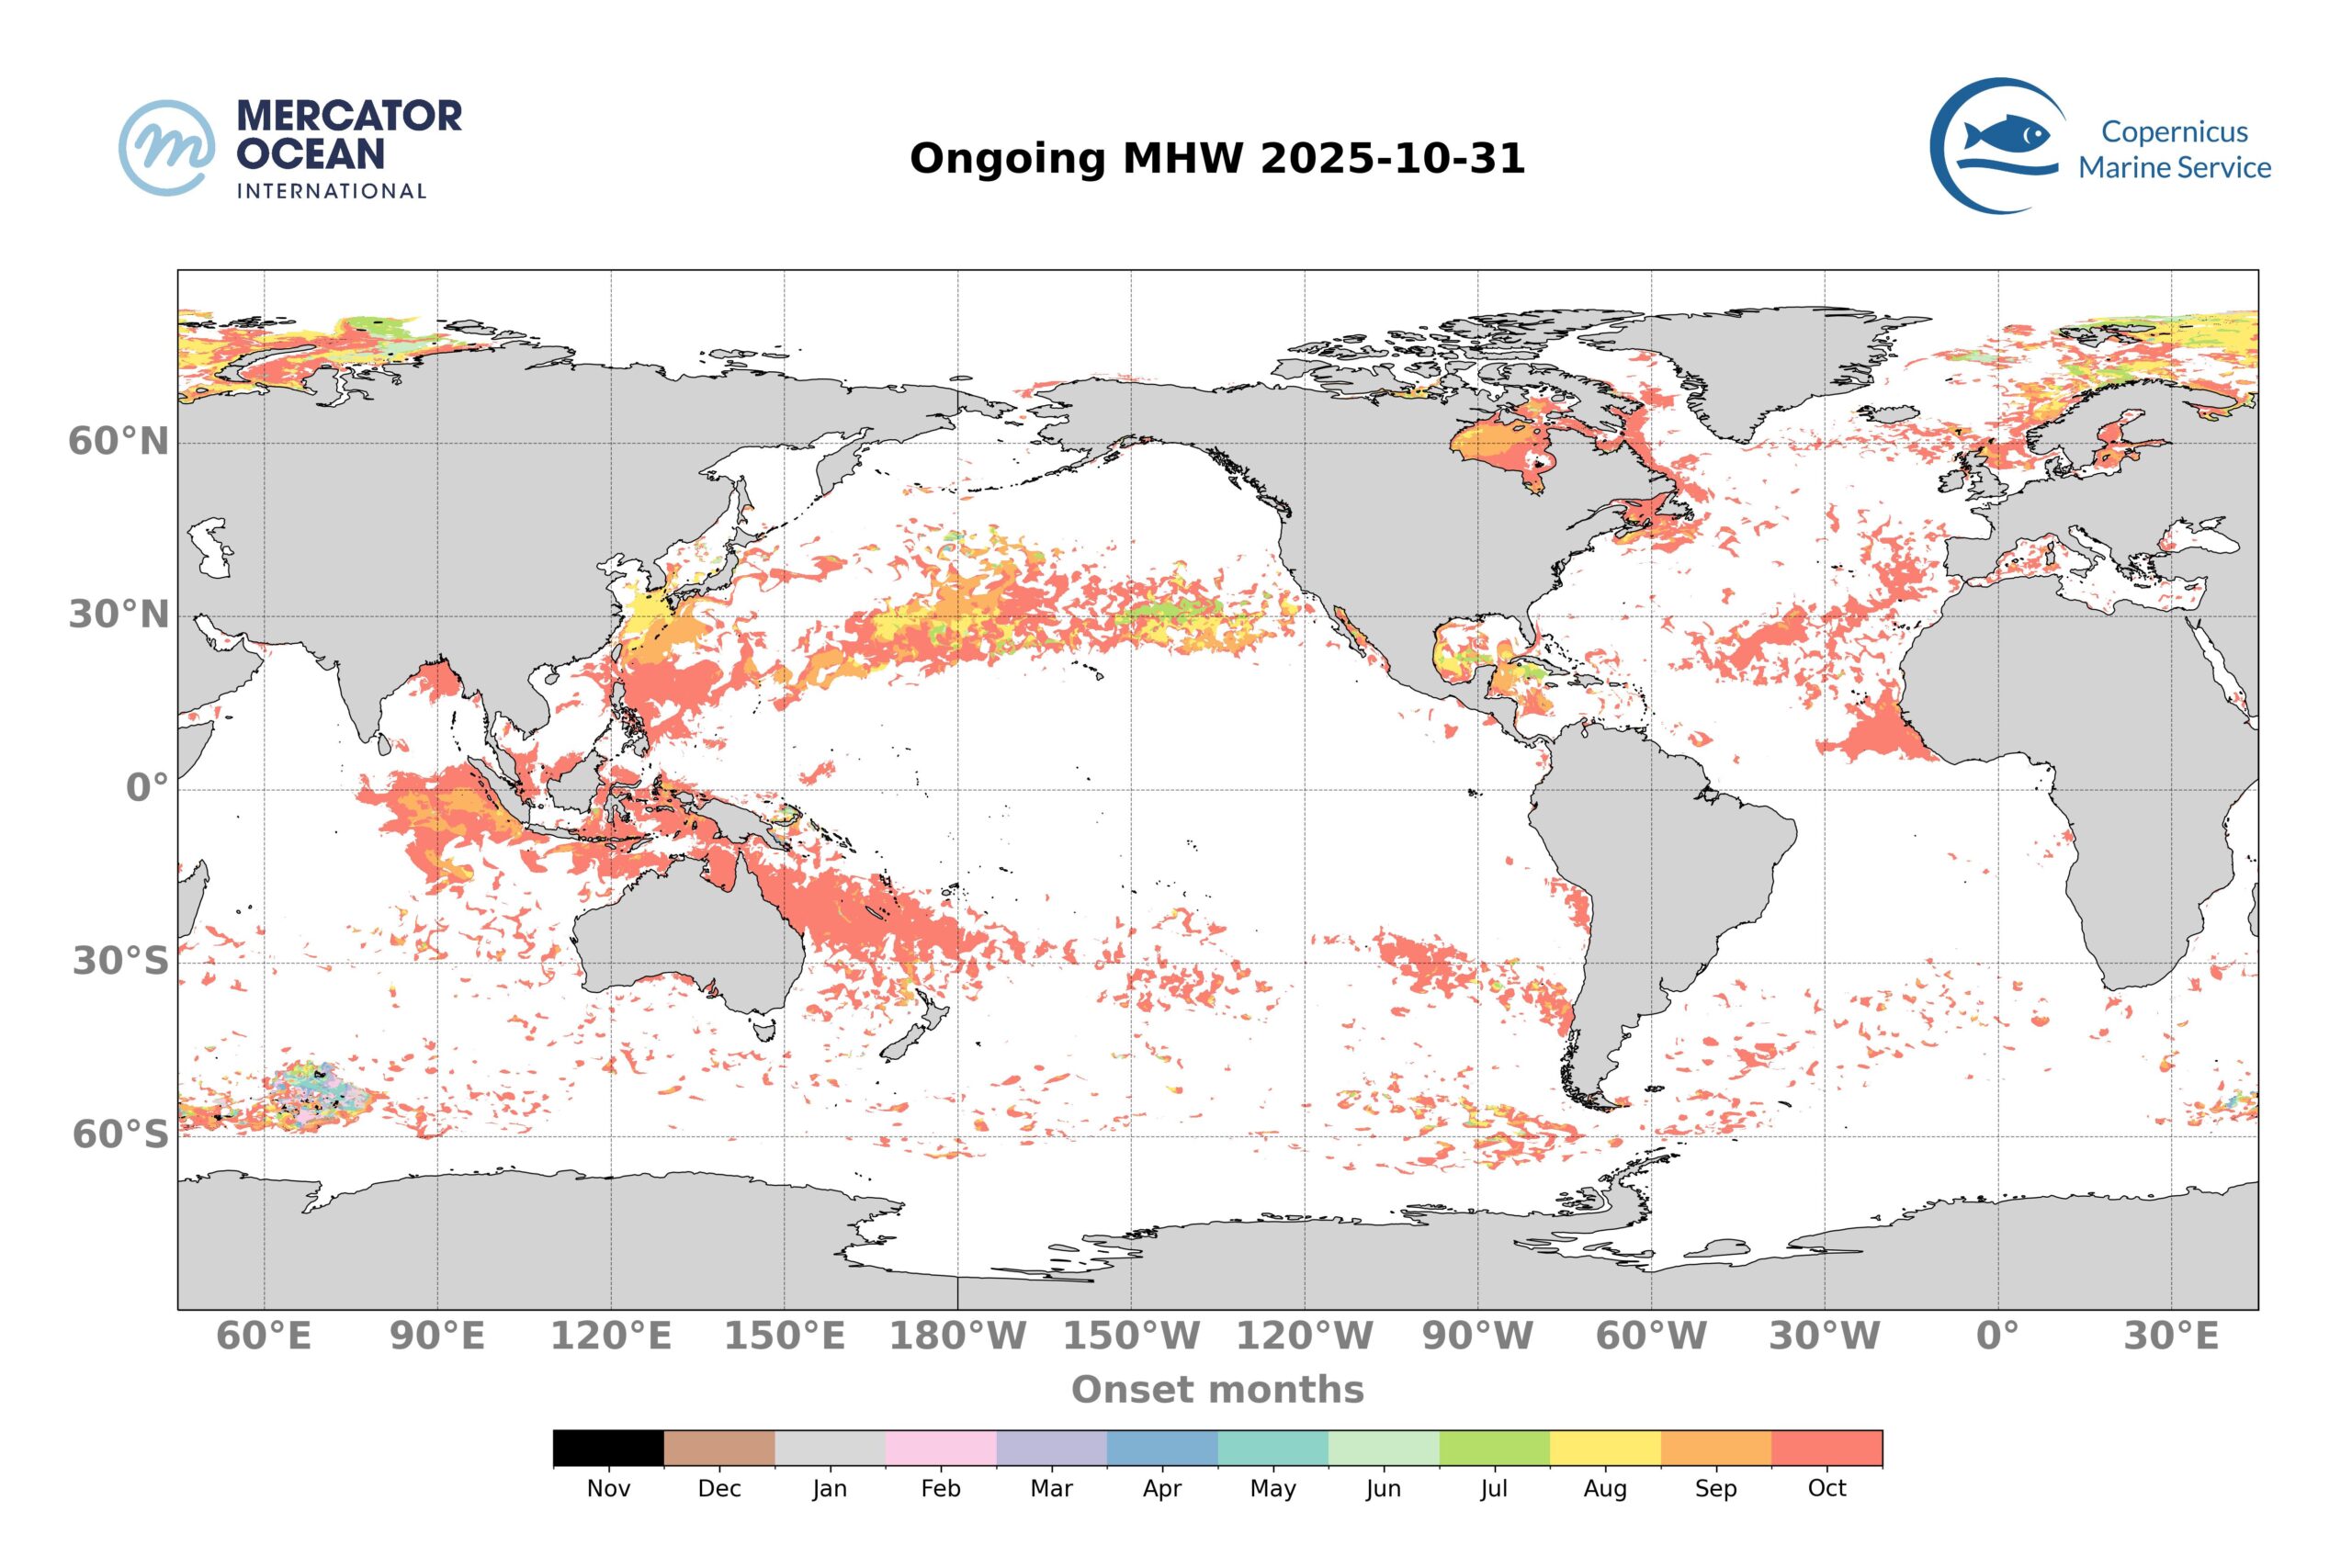
Sea Surface Temperature Anomalies 


  • October 2025 mean SSTs are above average for 63% of the global ocean (between 60°S and 60°N), with 9% exceeding the average by at least 1°C.
  • More than half of the Mediterranean Sea showed above-average SSTs, with the highest SST above average on the western part.
  • North Pacific Ocean – widespread high SSTs at midlatitude spanning the entire width of the basin, reaching 3°C above average. Similar above-average SSTs are observed in the South Pacific, extending from the Australian to the Chilean coasts. The equatorial region is characterized by a large below average SST continuing the transition from ENSO neutral to La Niña conditions observed in previous months.
  • The North Atlantic showed above average SSTs for 74% of the area (between 0°N and 60°N) mostly mild except in the western region around Newfoundland.
  • The Arctic region shows large above-average temperature -reaching more than 2°C above average.
  • In the Indian Ocean, SSTs were predominantly above average in the eastern part and below average in the western part.
October 2025 mean SST anomalies relative to a 30-year climatology (1993-2022). Data sources: daily sea surface temperature using Mercator Ocean International’s GLO12 analysis and forecasting system for 2025; GLORYS12 reanalysis to calculate a climatological mean.

Ongoing Marine Heatwaves

31 October 2025 

Month of onset for ongoing MHWs as of 31st October 2025. Colours indicate the month during which the MHW started. For instance, ocean pixels in red correspond to an MHW that developed during October 2025 and are less than one month old. In orange MHWs are between 1 and 2 months old, etc.
  •  18% of the global ocean (between 60°S and 60°N) was affected by MHWs on the 31st of October.
  • The majority of these MHWs developed recentely, with 13% of the global Ocean (between 60°S and 60°N) affected by MHWs less than 1 month old and more than 3% by events between 1- and 2-month-old.

Total Surface Marine Heatwaves


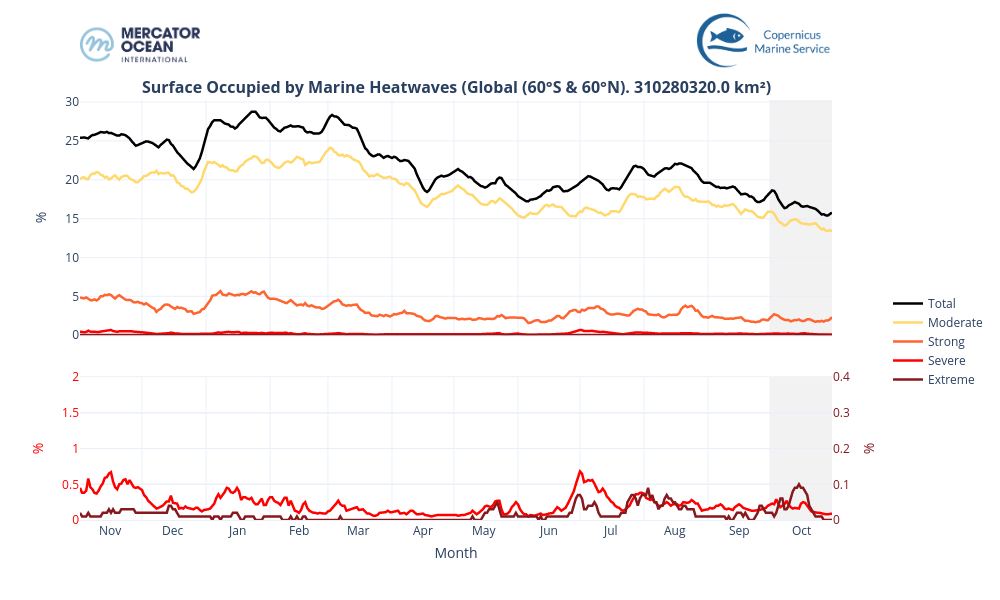
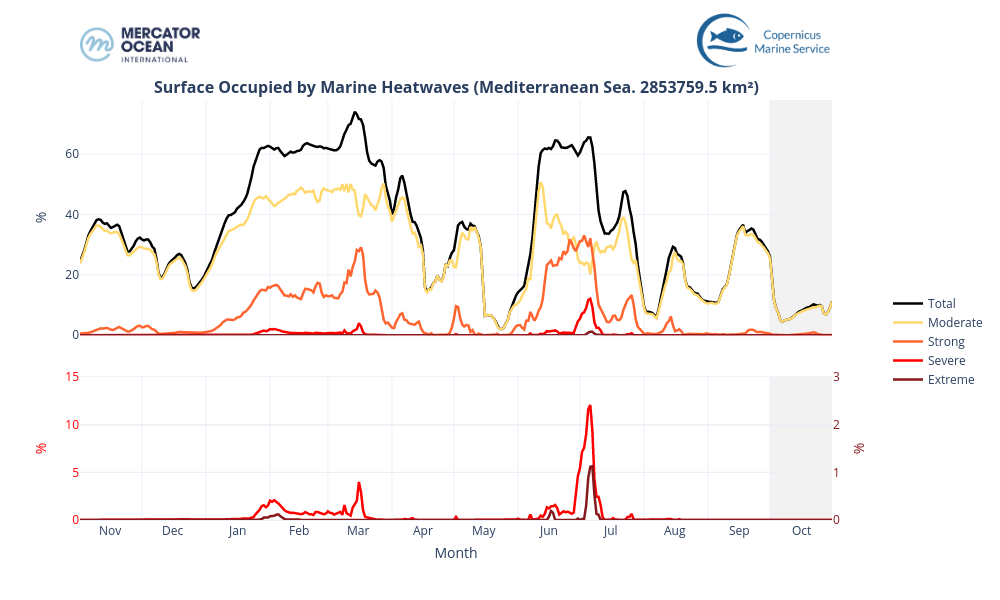
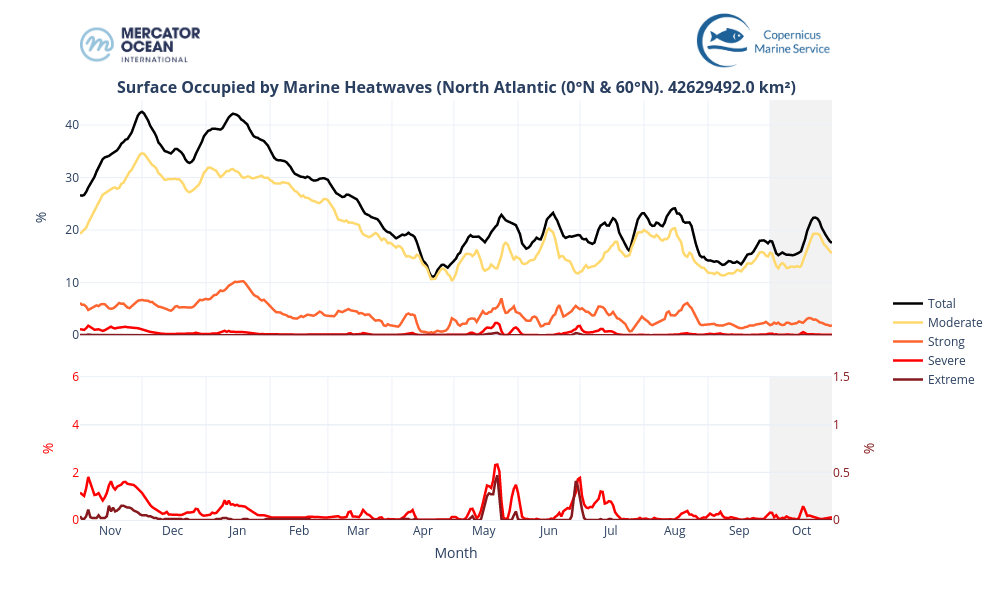
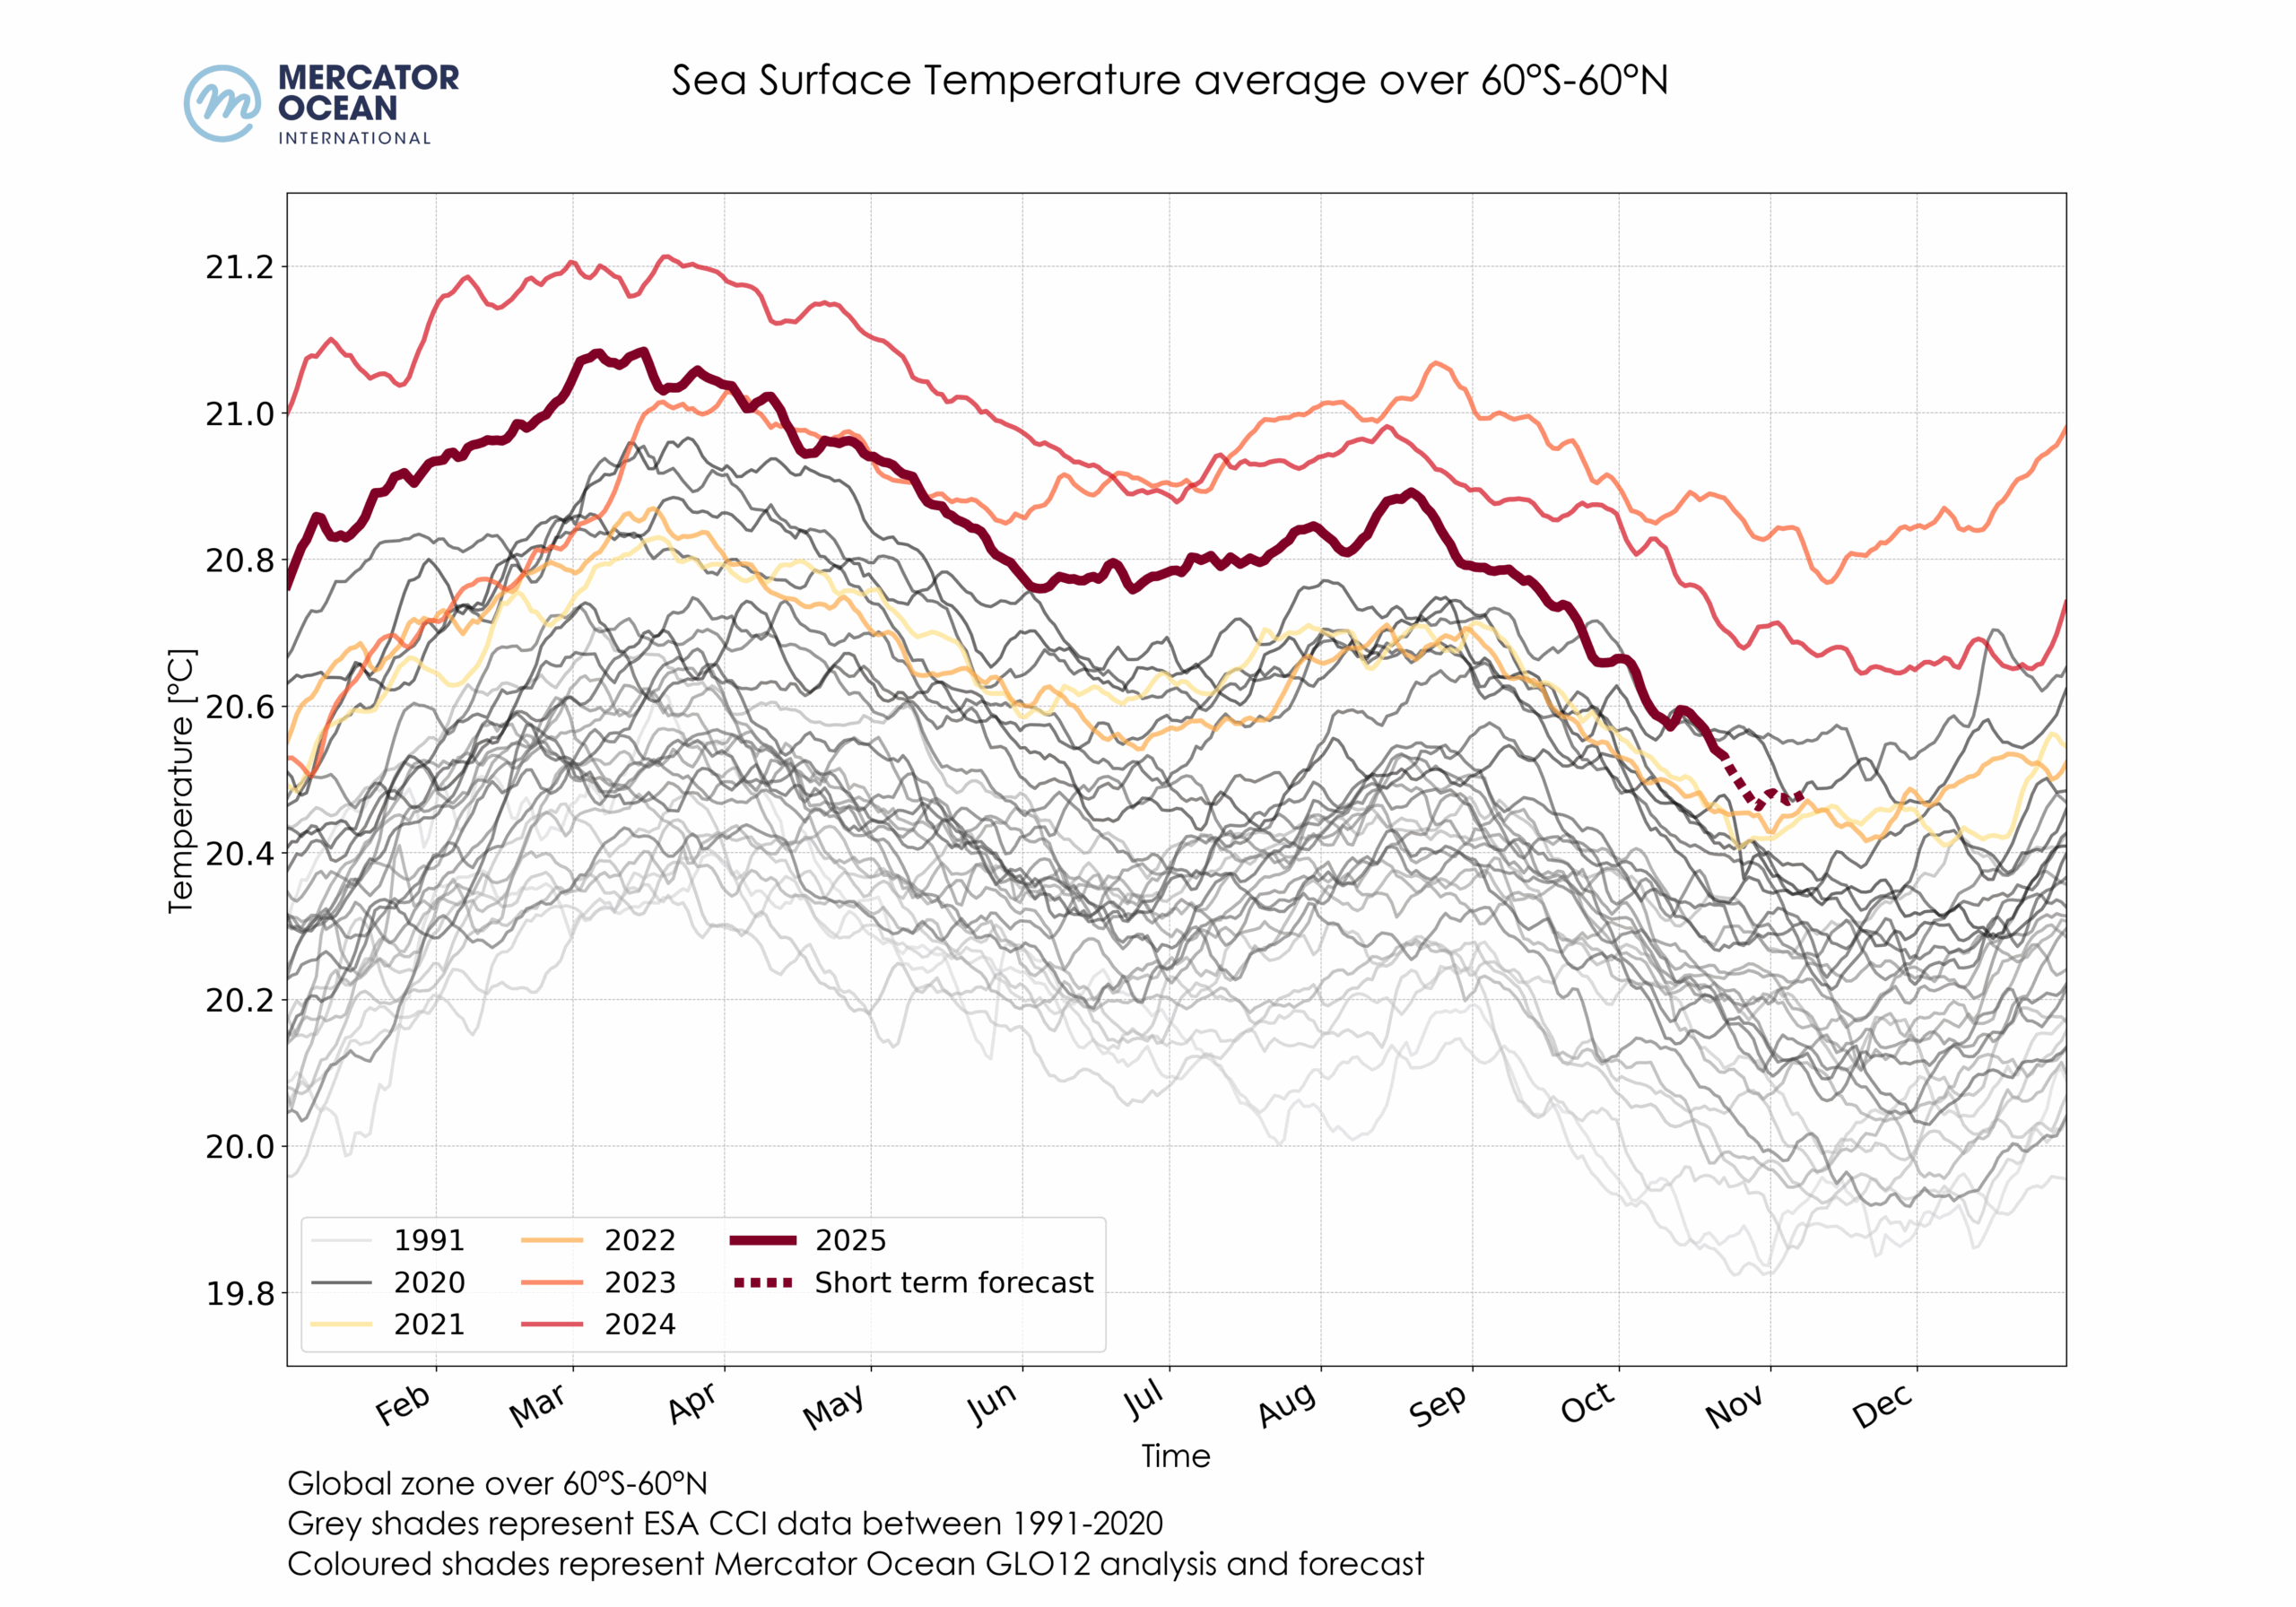
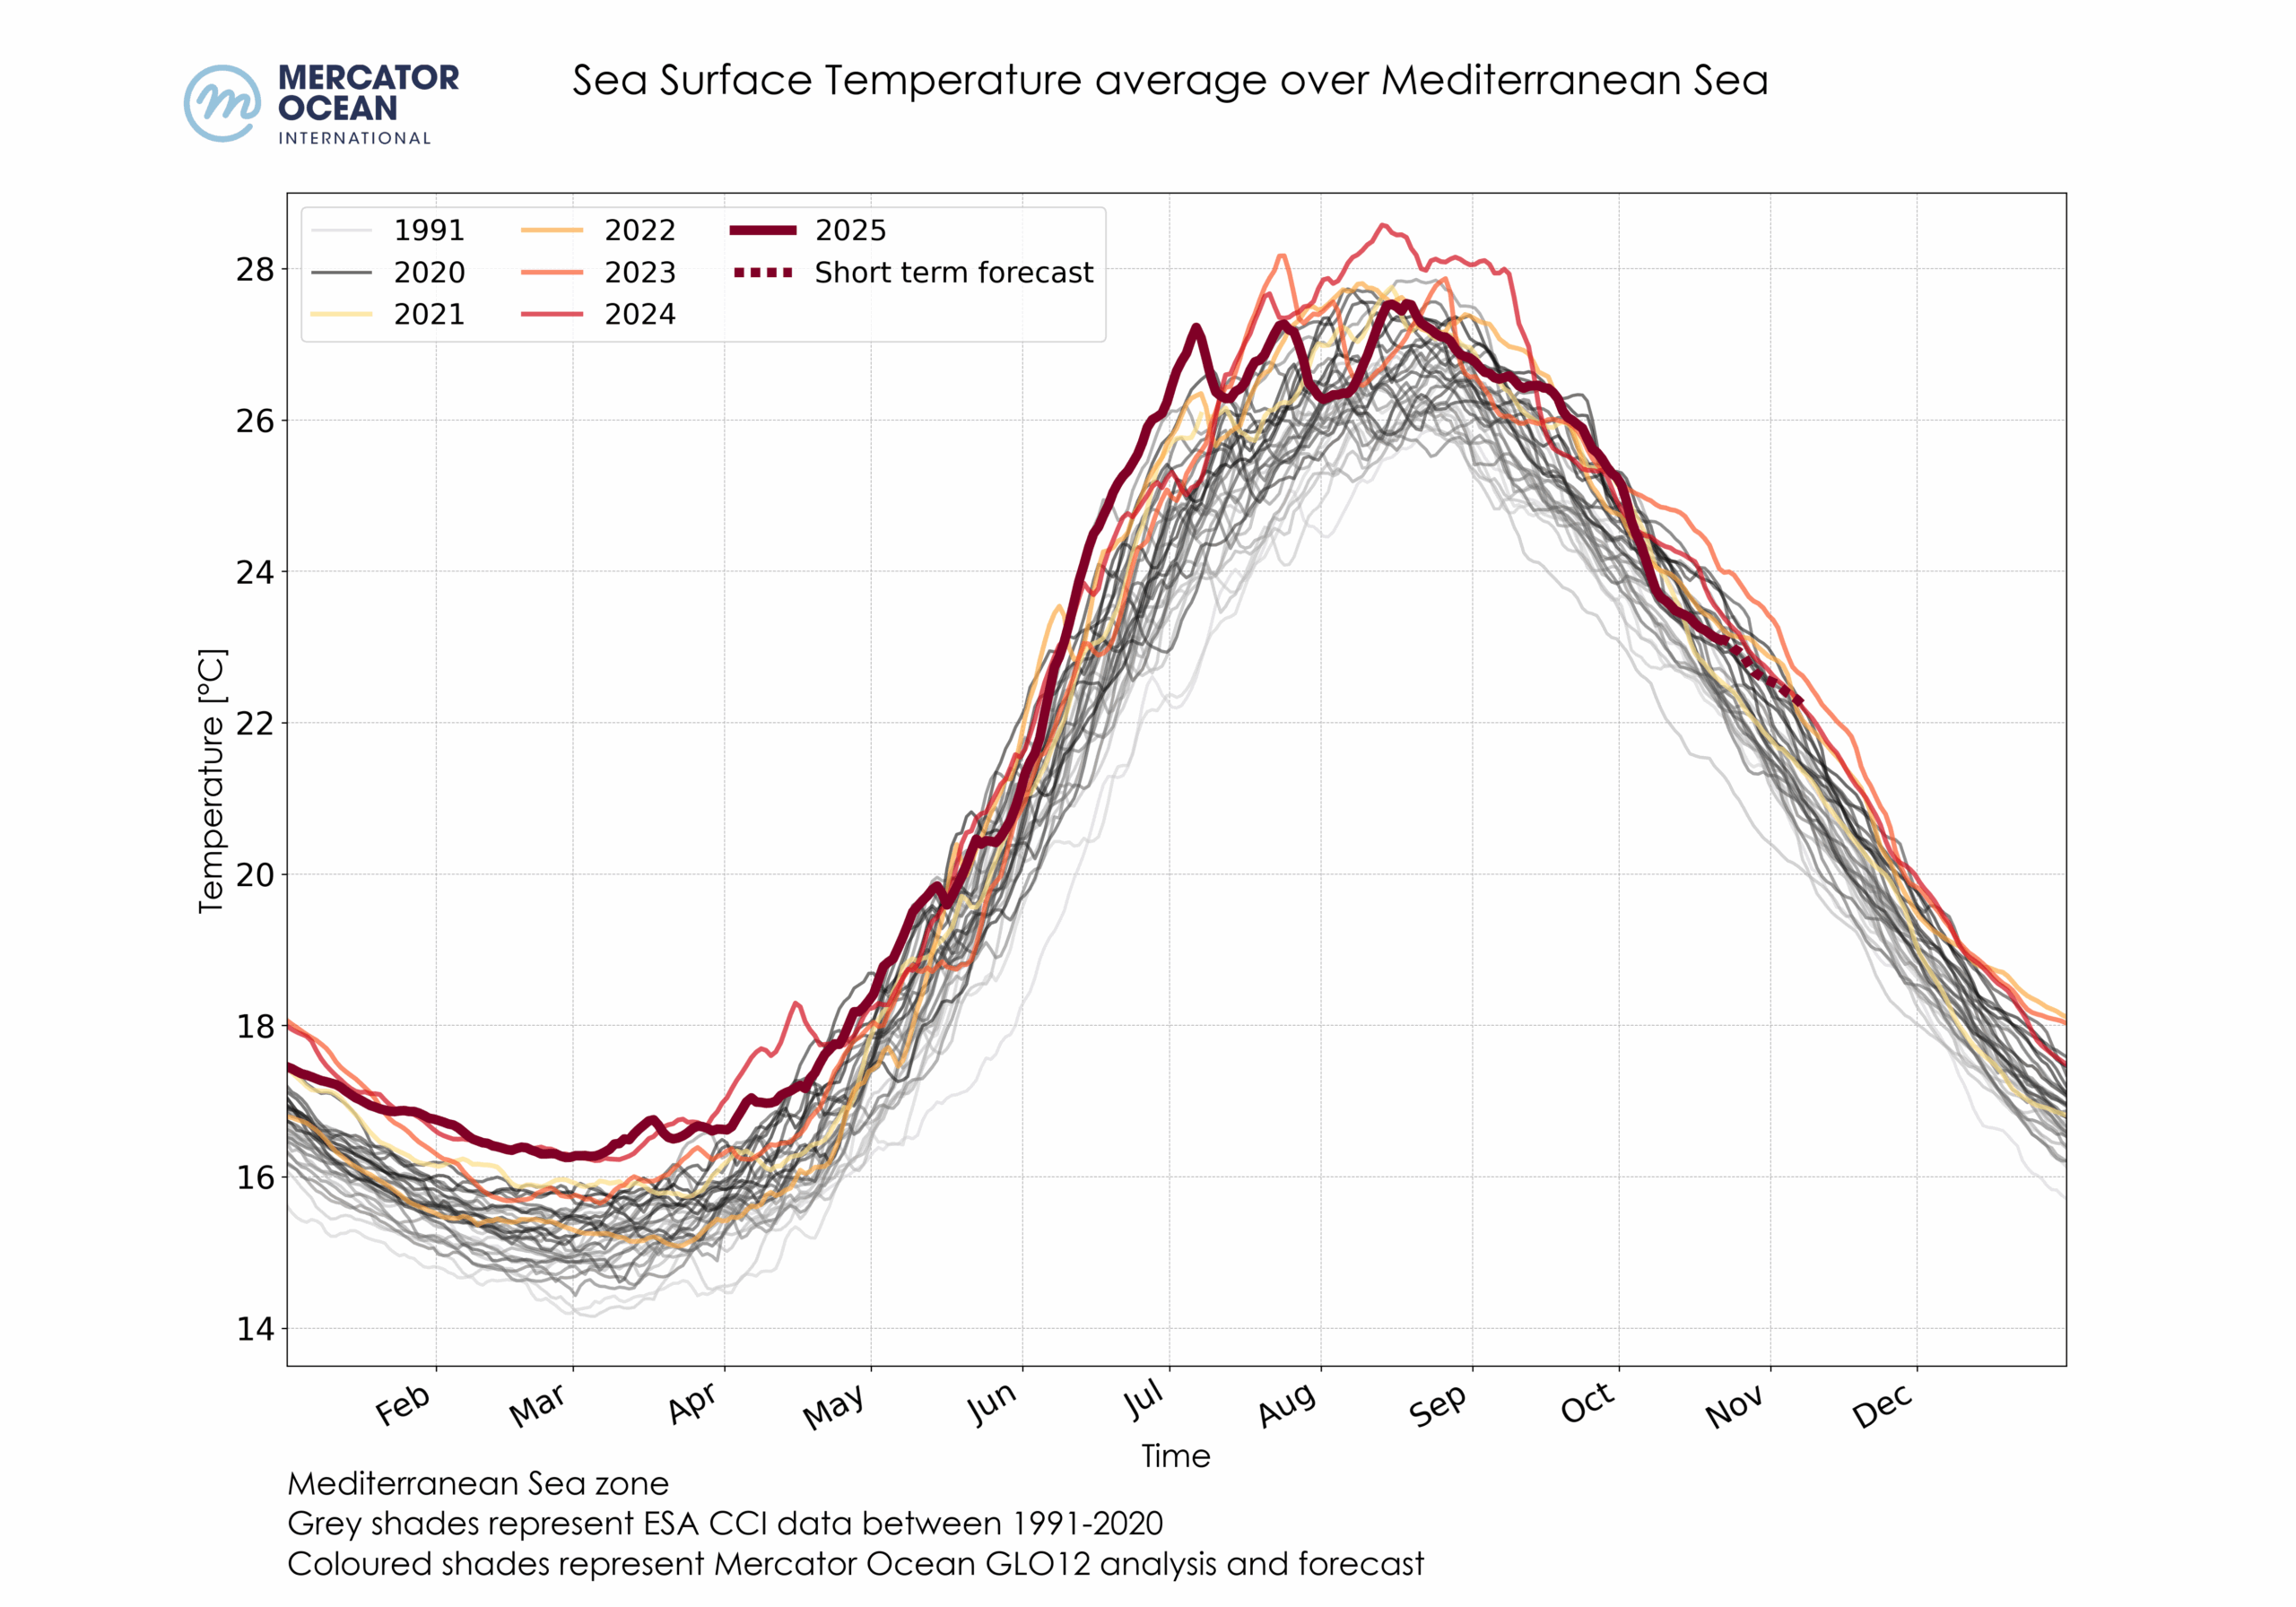
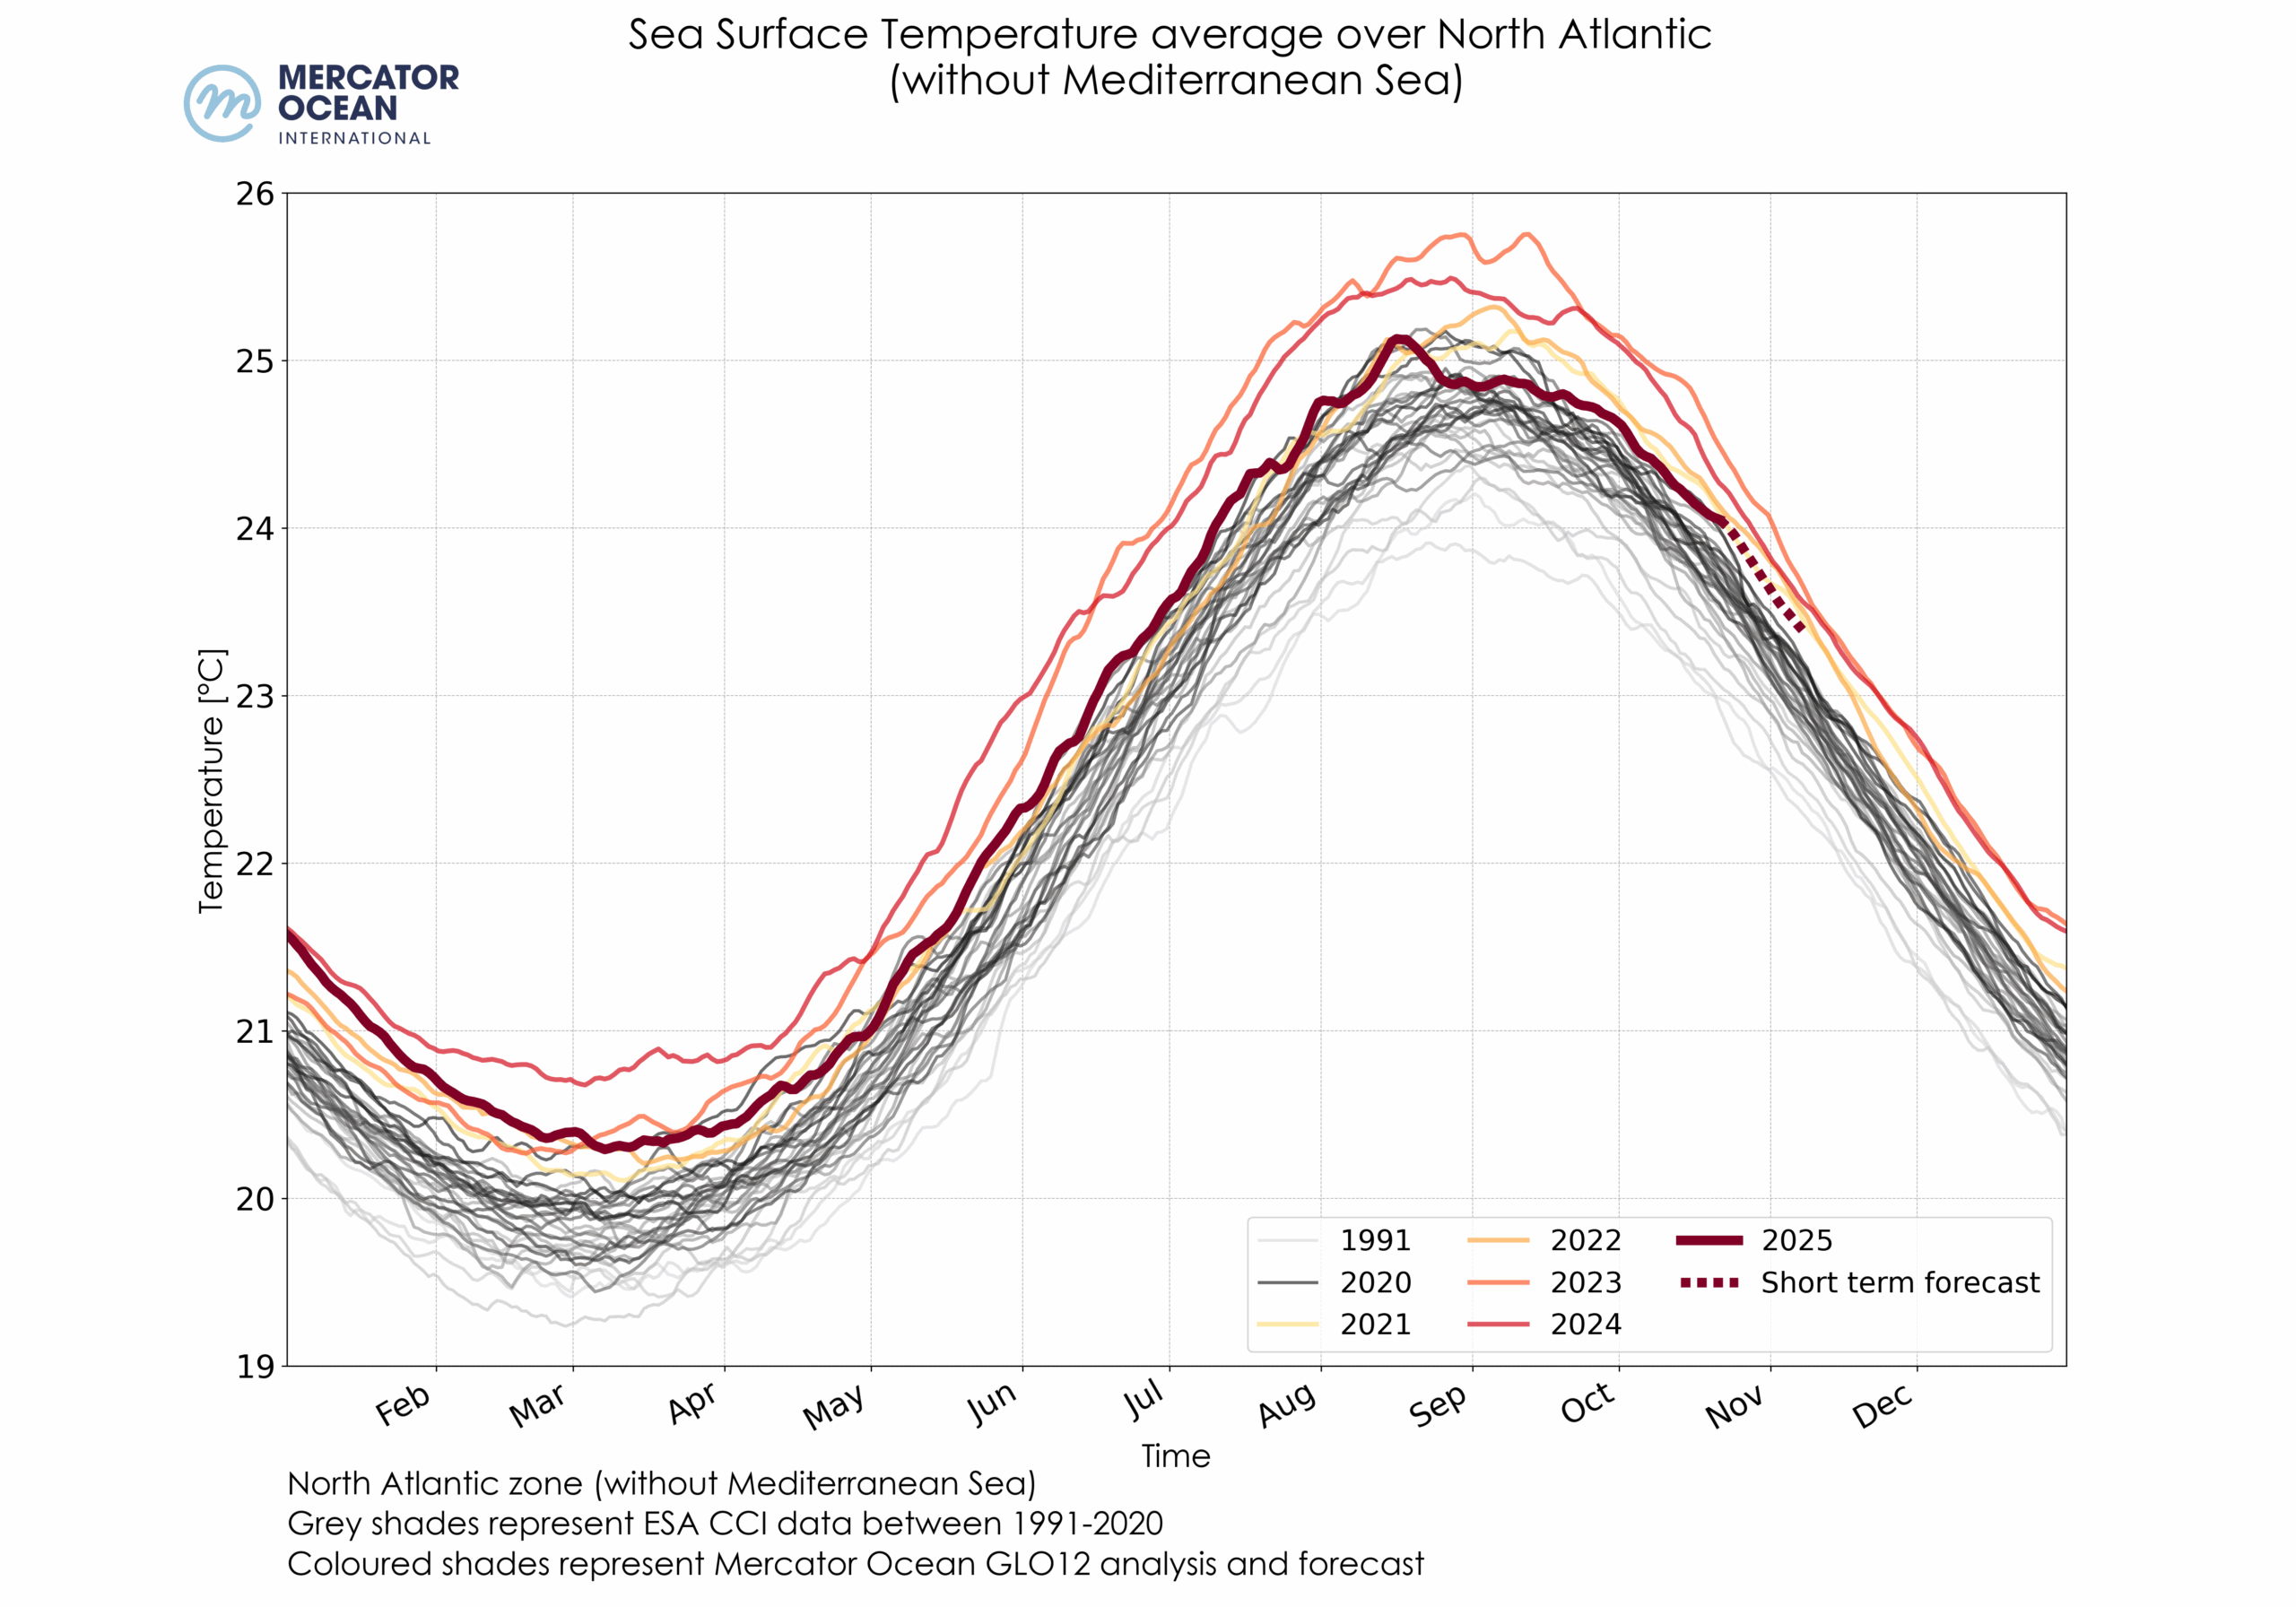
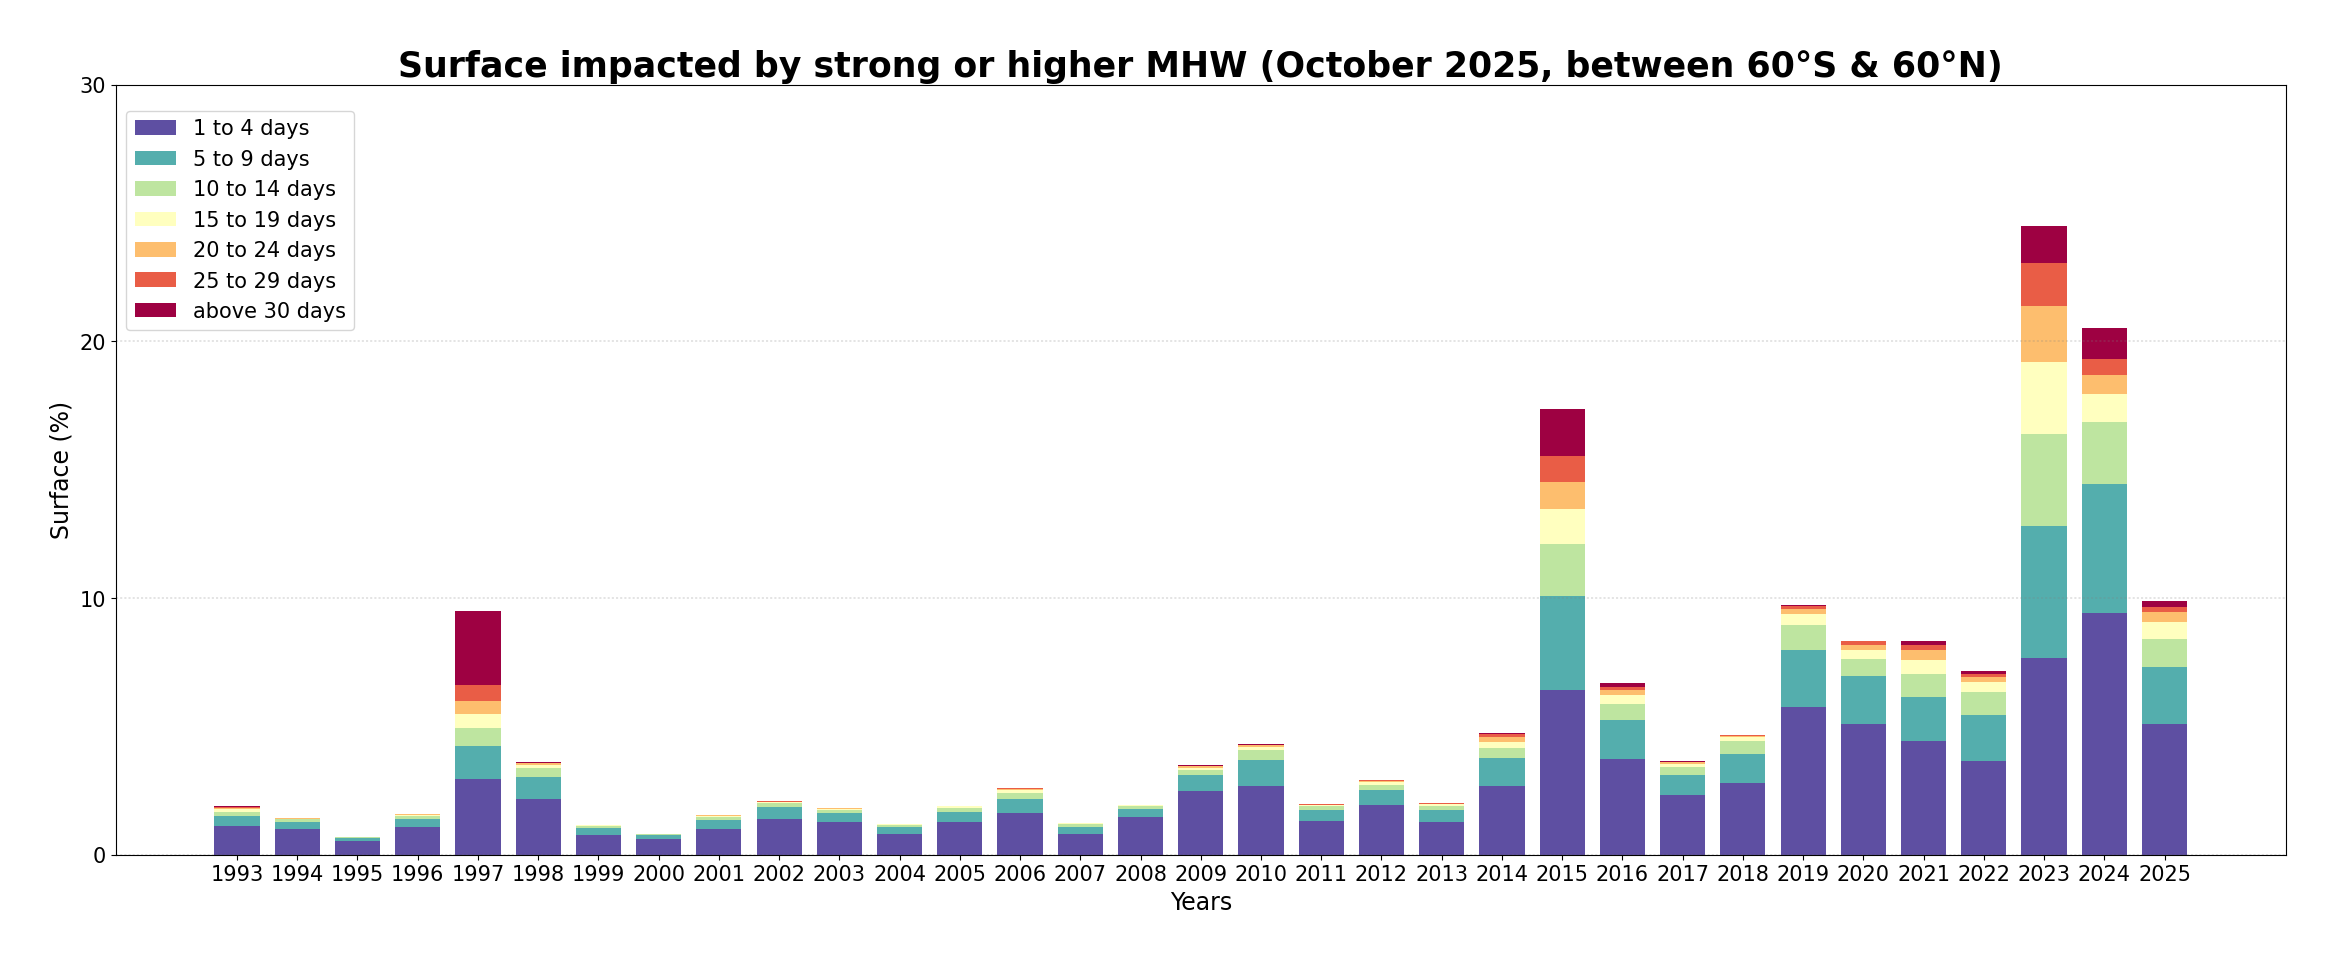
Surface occupied by MHWs in the global ocean (between 60°S and 60°N), MHWs in the Mediterranean Sea and in the North Atlantic (between 0°N and 60°N) between November 2024 and October 2025 based on daily monitoring. The black solid line represents the total surface of MHW, while the colored lines represent the surface of each MHW category. The gray background highlights the month of October 2025.

  • In October 2025, the total surface of MHW (black line) decreased from 18% to 16% of the global ocean (between 60°S and 60°N), continuing a decreasing trend since the same period last year (extent of MHW in October 2024 ranged between 25% and 28%). The majority of MHWs events were of moderate category (~16-13%) and to a lesser extent strong categories (~2%).
  • For the Mediterranean Sea, the total MHW surface fell from 26% to 5% at the very beginning of the month, for then progressively increasing to reach 9% by the end of October. These MHW events consisted of moderate categories only. For comparison, in October 2024, the total MHW extent varied between 27% and 14% (not shown).
  • For the North Atlantic (between 0°N and 60°N), the total MHW surface remained stable in the first half of the month around ~17%, and experienced a peak at 22% during the second half. These events consist mostly of moderate and strong categories (15-16% and 2%, respectively). For comparison, in October 2024, the total MHW extent dropped from 40% to 27%, with the noteworthy presence of strong (10-7%), severe (~5-2%) and a peak of extreme (to 0.9%) categories (not shown).

Total Number Marine Heatwaves

Number of days during which a MHW of category strong, severe or extreme occurred in October 2025. Blank areas mean that no MHW of strong or higher category happened during the month. Blue shaded areas in the polar regions represent the sea ice maximum from the climatological period (1993-2022). Monitoring SST extremes with the MHW categorization approach as used here is not best suited for such regions.
  • 10% of the surface of the ocean was impacted by strong-or-higher MHW conditions for at least 1 day during October 2025. This is the 4th widest extent after 2015, 2024 and 2023. The center North Pacific Ocean, the East China Sea, the Indian Ocean west of Sumatra and the Caribbean Sea are the most affected (Figure 7).
  • Regionally, 13% of the North Atlantic (between 0°N and 60°N) was impacted by strong, or higher, MHW conditions for at least 1 day. This corresponds to the 3rd largest extent for an October month – far behind 2024 (36%) and 2023 (53%). Noteworthy, 2% of the region was affected by intense MHW condition (Strong or higher) during, at least, half of the month.
  • For the Mediterranean Sea, the surface affected by strong or higher MHW ranks within the third largest extent in the past 33 years.


Yearly evolution of the ocean surface impacted by strong and higher MHW during October since 1993. The size of the bar represents the surface of the global ocean (60°S to 60°N) exposed to a strong or higher MHW during the month and their duration. As indicated by the colours, the proportion of the ocean exposed to such MHWs is categorized according to the number of days impacted during the month.

Statistics

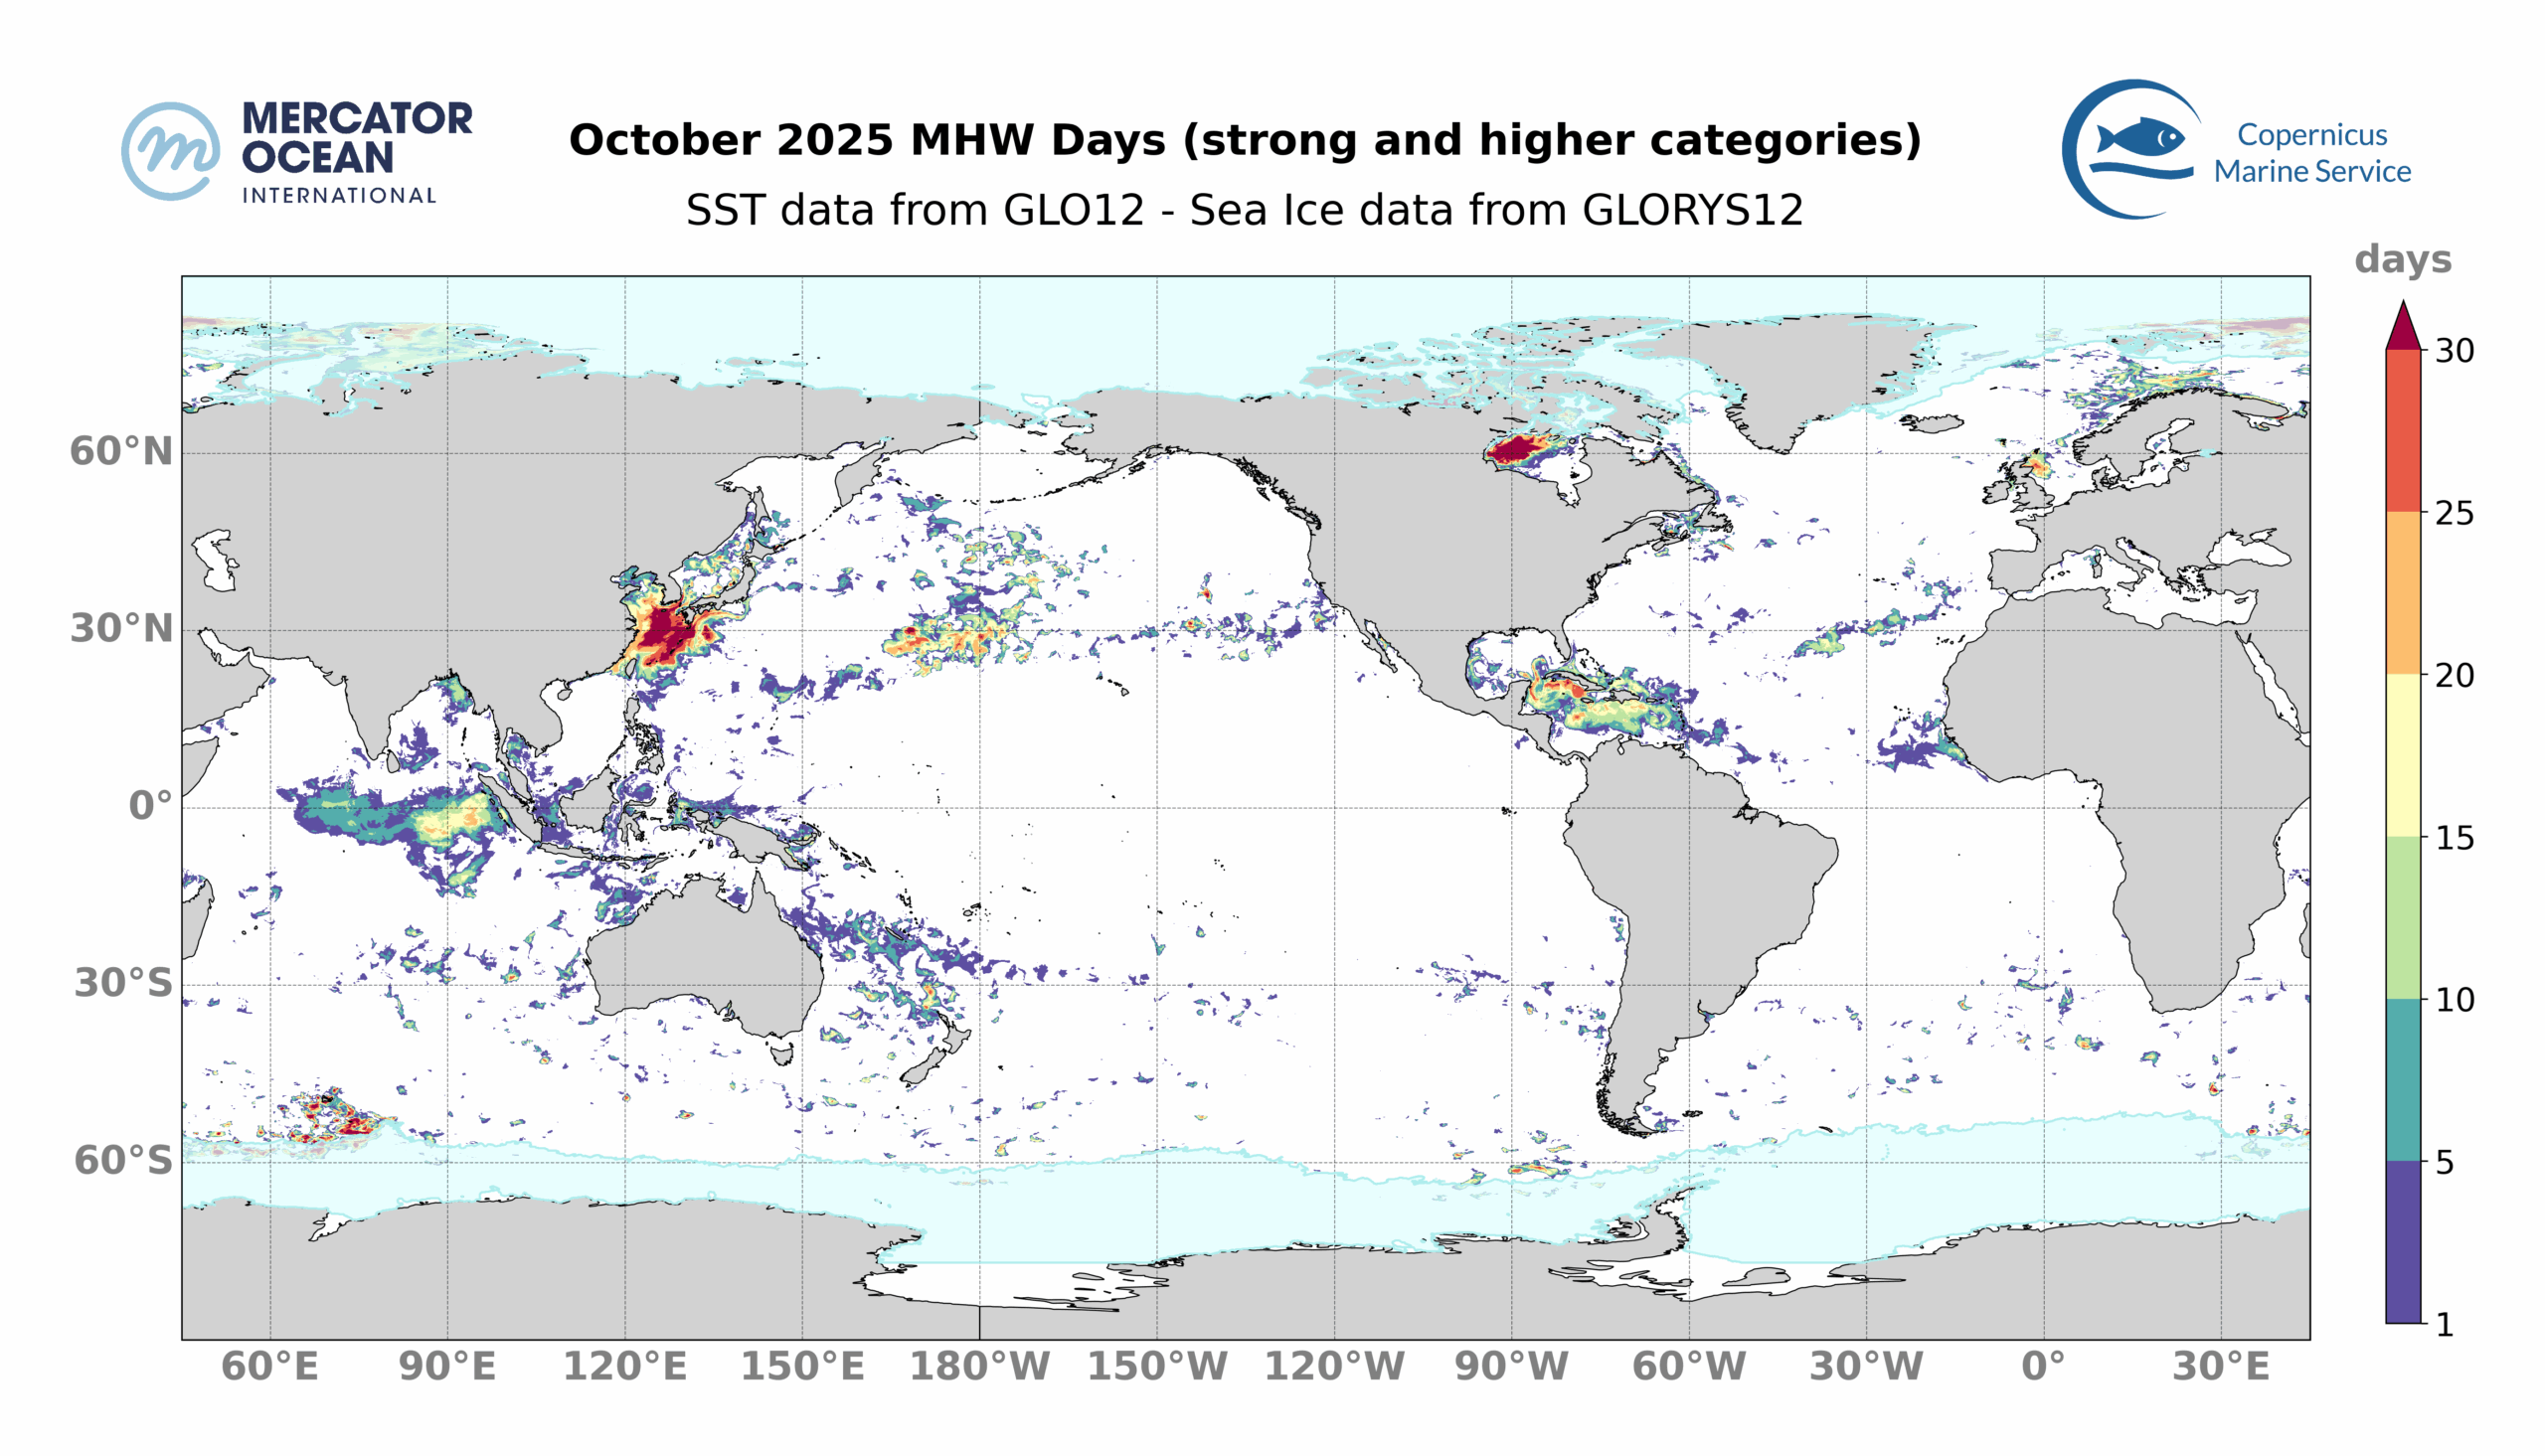
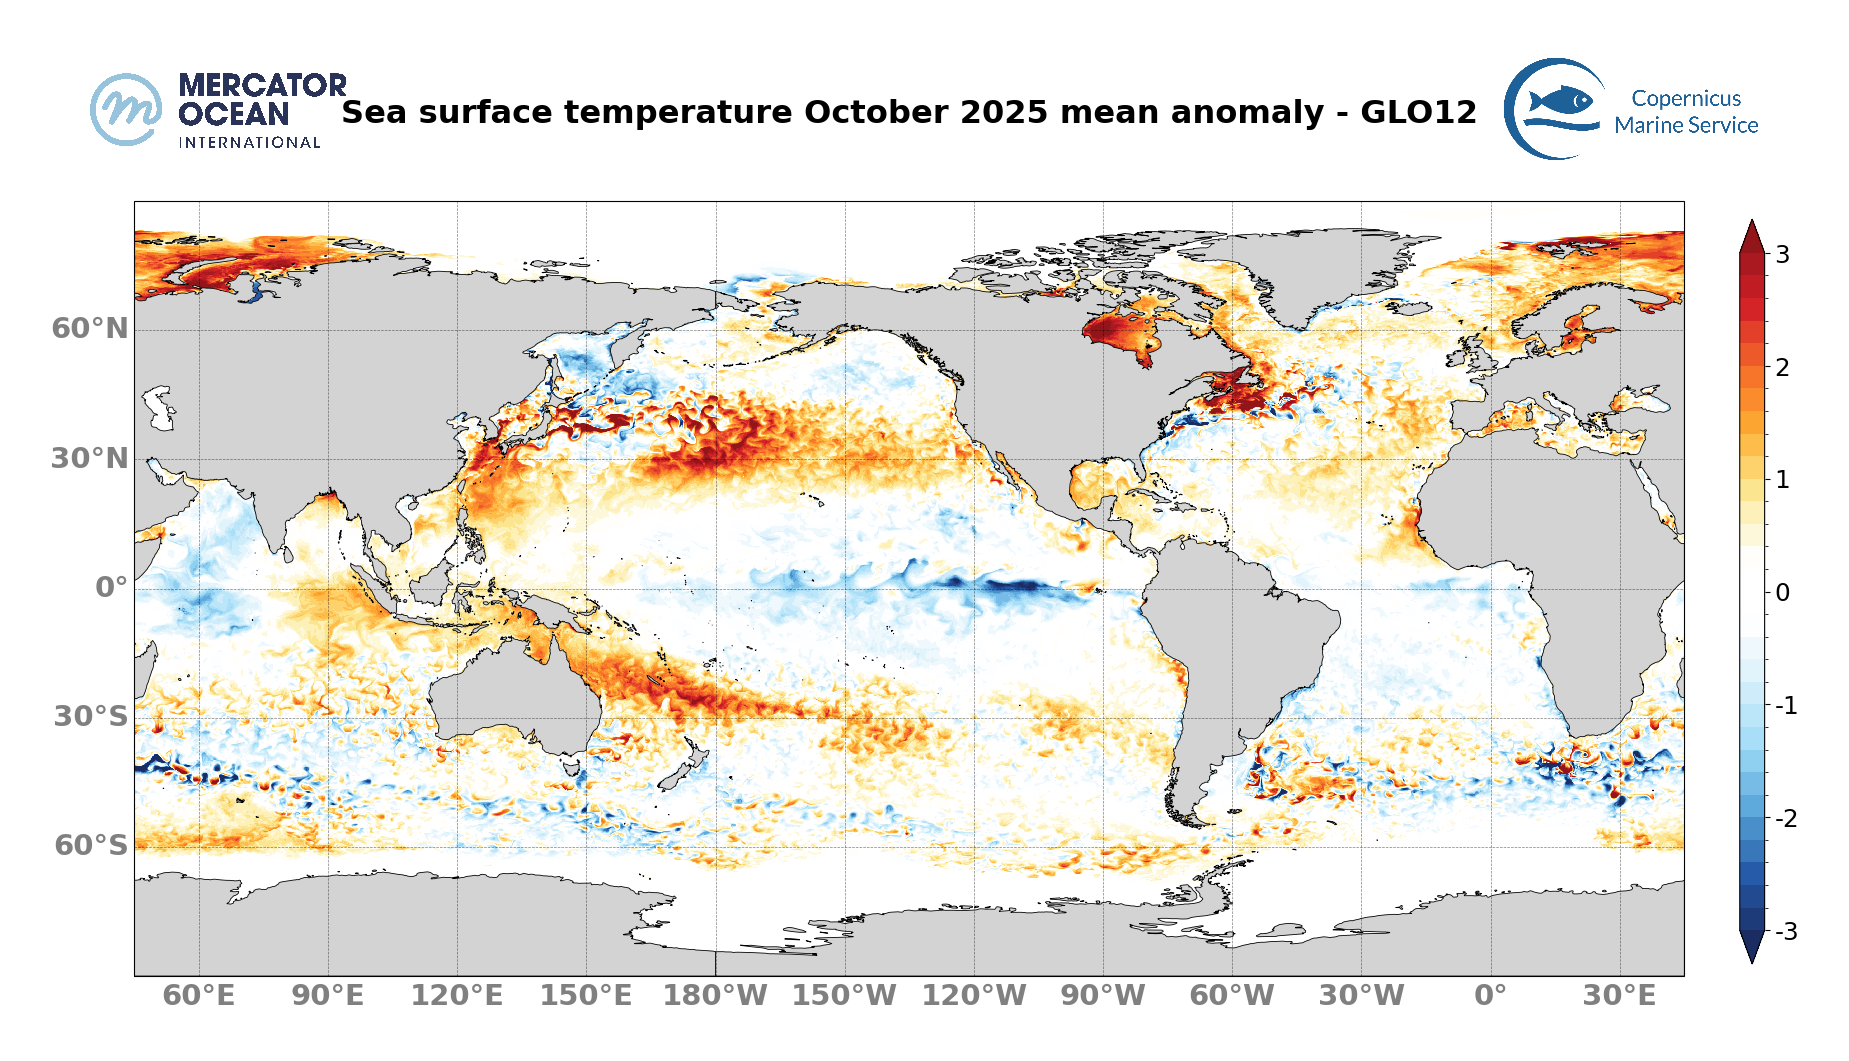
Marine heatwave statistics for October 2025

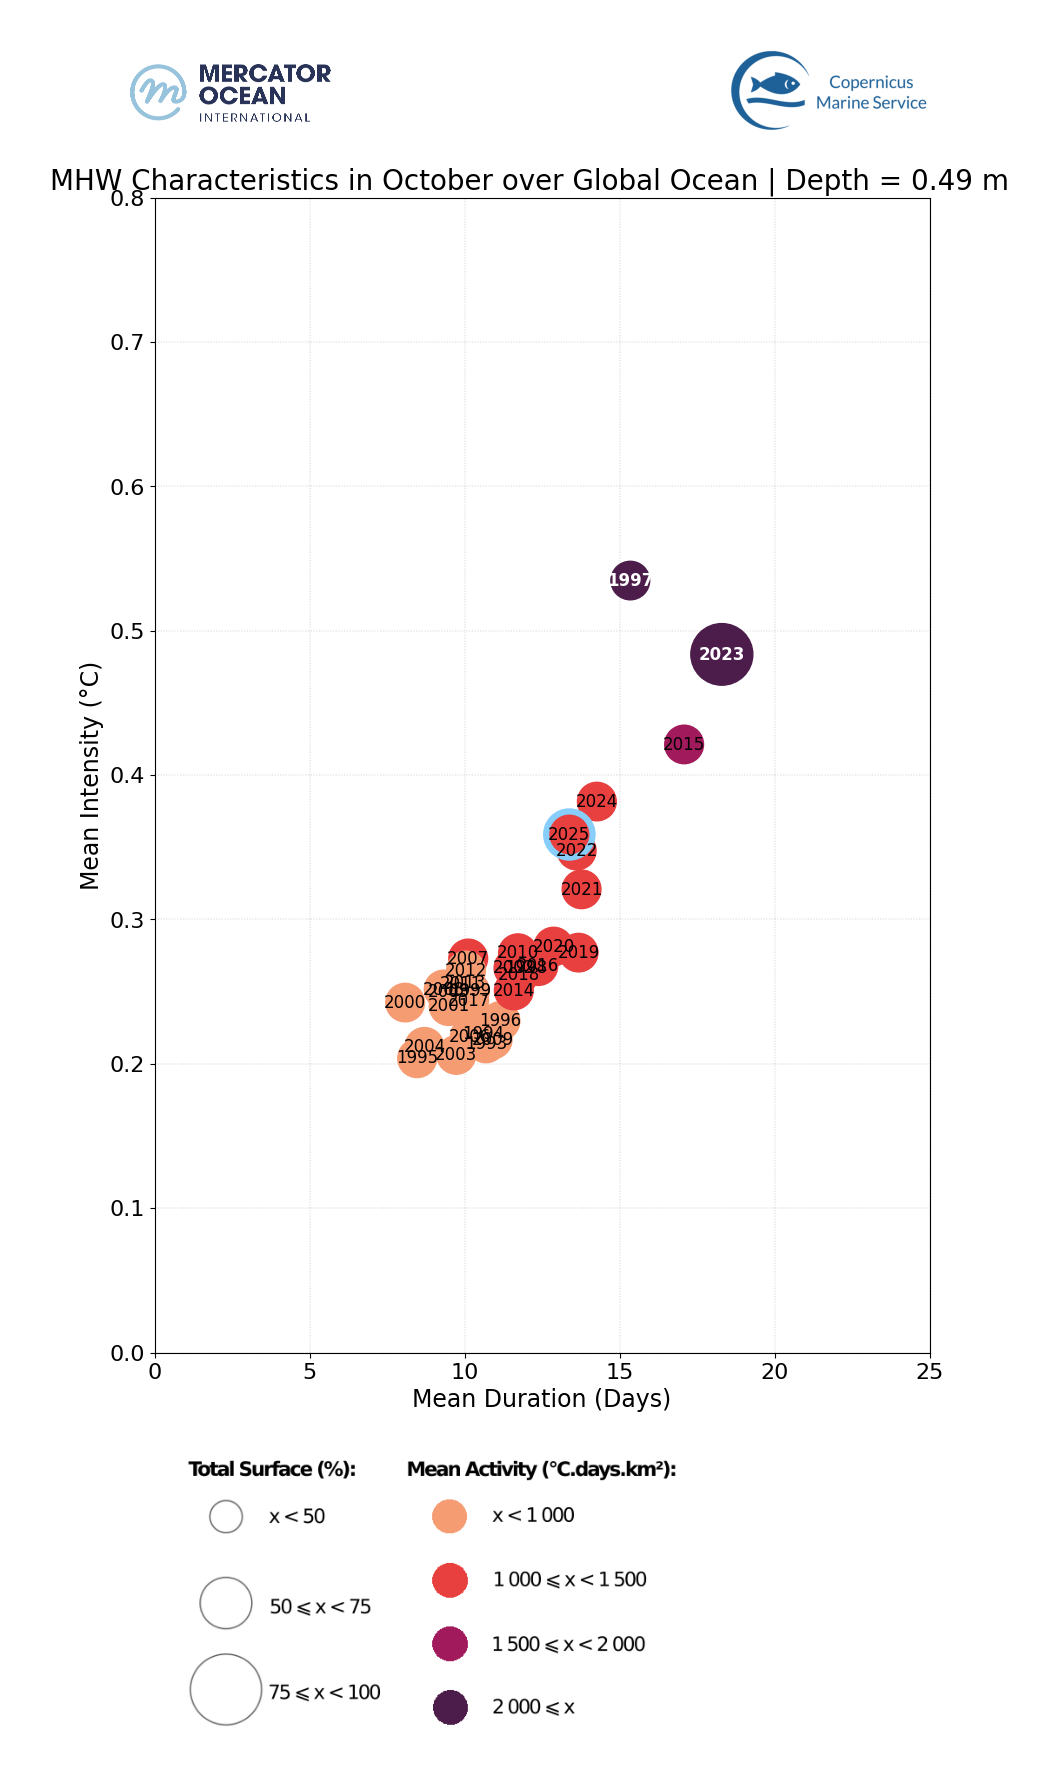
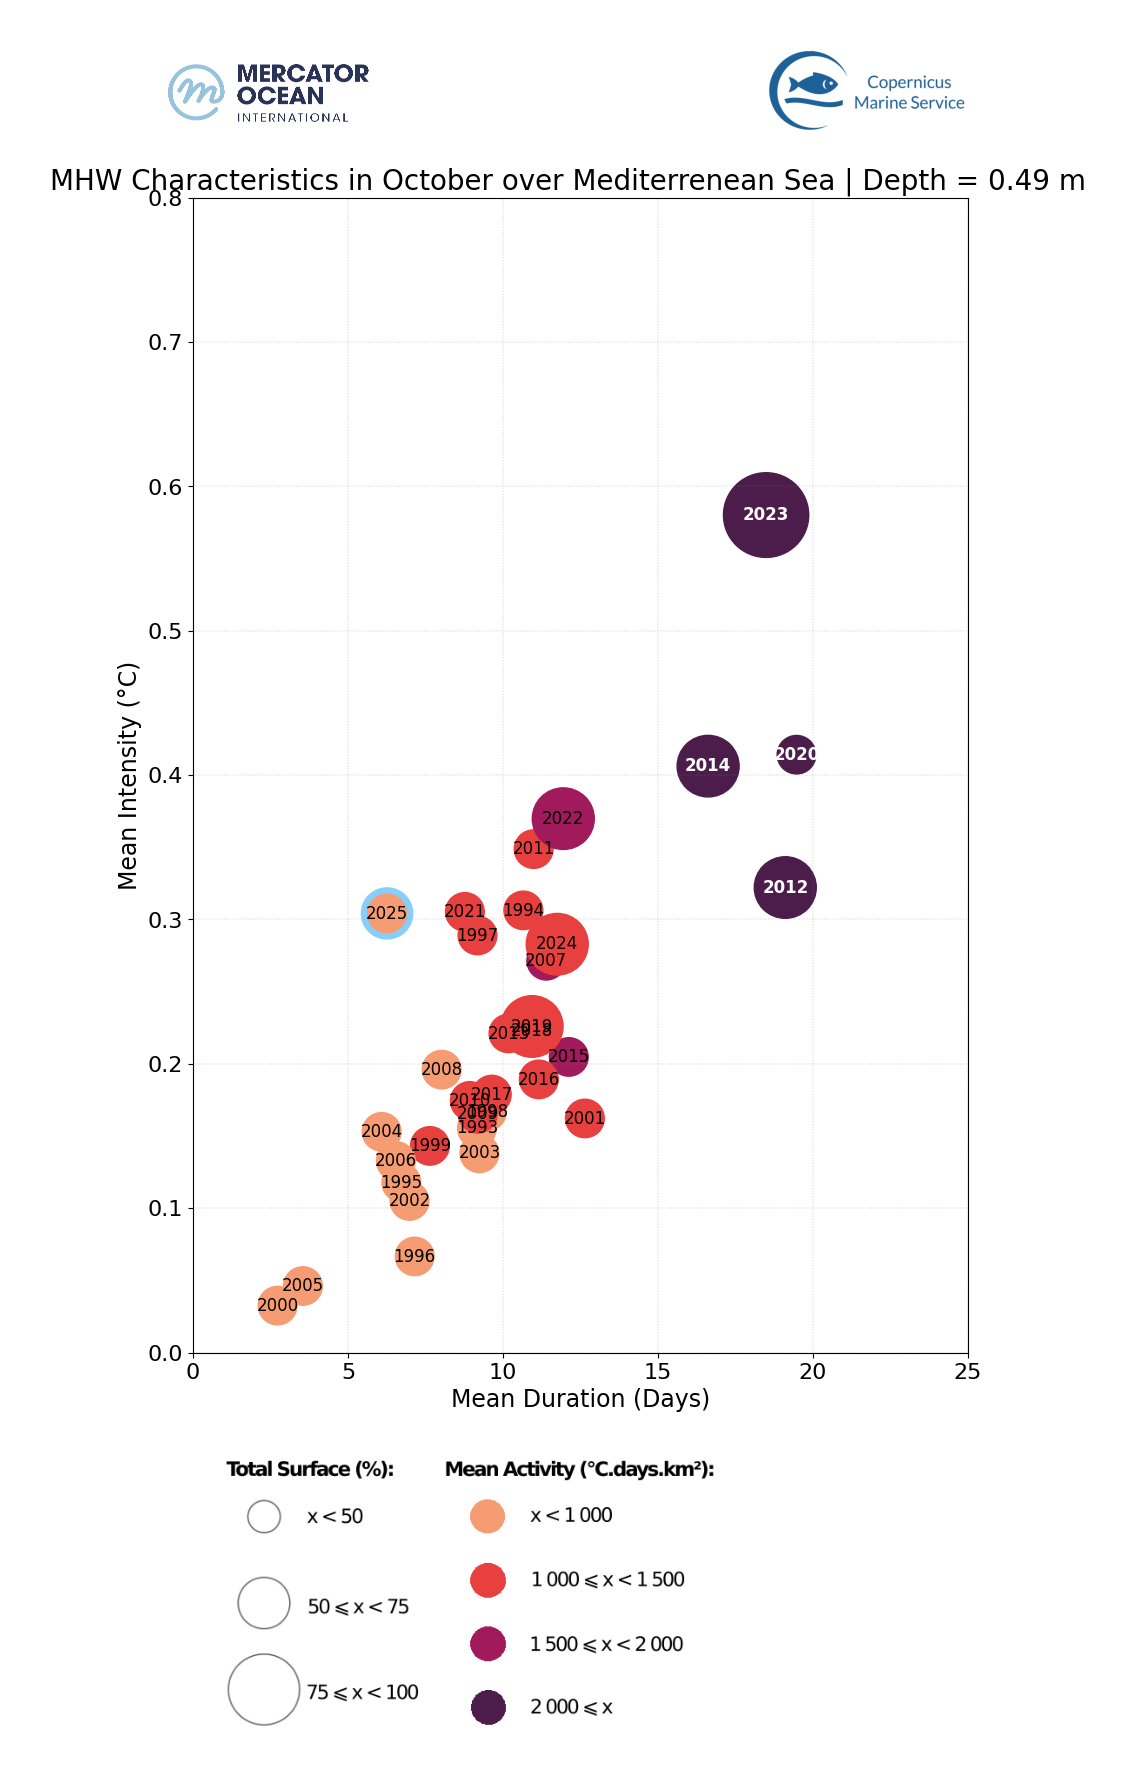
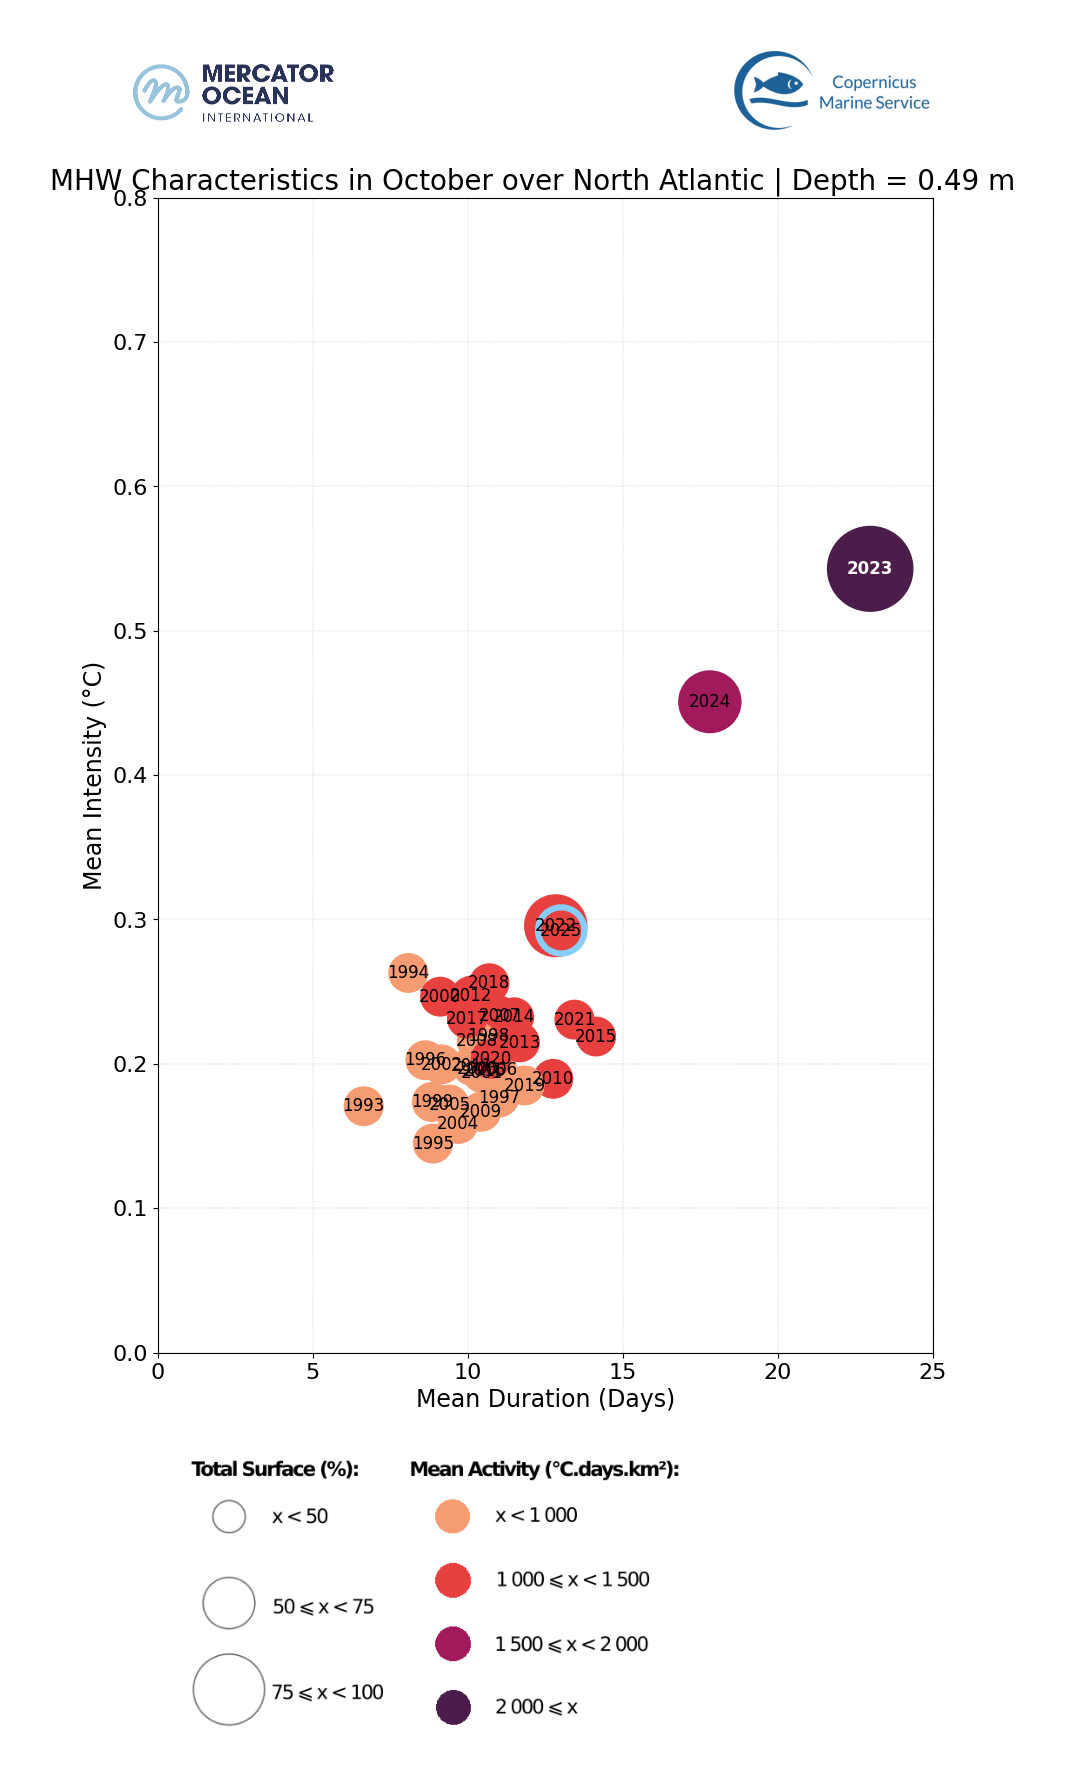
MHW characteristics (duration, intensity, extent and activity) for October months between 1993 and 2025. October 2025 is highlighted with a blue edge. Each bubble corresponds to October of a given year. its position on the horizontal axis – duration, on the vertical axis – intensity, size of each bubble indicates the mean surface area occupied, and the color represents the MHW activity. MHW average characteristics are calculated for each month for the global ocean, the North Atlantic, and the Mediterranean Sea to obtain a MHW profile for each month that can be compared to those same months from previous years (since 1993) in a bubble plot (figure above). 

  • October 2025 was the 5th most extreme October month in terms of MHW after 2024, 2015, 2024, 1997 and 2023. Events remained however regional.
  • In the Mediterranean Sea, October 2025 was affected by rather short and locally warm MHWs on average but not as extreme as October 2023.
  • In the North Atlantic, October 2025 ranked as the third most extreme October for MHWs, tied with 2022, while Octobers 2024 and 2023 were significantly more extreme than 2025.


About the Bulletin

Mercator Ocean International publishes a monthly sea surface temperature bulletin reporting on mean temperature and marine heatwave conditions for the month just passed. It includes:

  • Regions where MHWs are present and the time these events started,
  • Timeseries showing the total surface occupied by MHWs globally and for the European region,
  • The total number of days of exposure to MHW during the month (including only strong and higher intensity categories).

Data sets and products

Sea Surface Temperature

The results are obtained using the Copernicus Marine Service global analysis and forecasting system together with observation-based products.

  • GLOBAL_ANALYSISFORECAST_PHY_001_024 Global Ocean Physics Analysis and Forecast sea surface temperature. U. Copernicus Marine Service Information (CMEMS). Marine Data Store (MDS). DOI: https://doi.org/10.48670/moi-00016
  • ESA SST CCI reprocessed sea surface temperature analyses. E.U. Copernicus Marine Service Information (CMEMS). Marine Data Store (MDS). DOI: https://doi.org/10.48670/moi-00169
  • NOAA OI SST V2 High Resolution Dataset data provided by the NOAA PSL, Boulder, Colorado, USA, from their website at https://psl.noaa.gov, Huang, B., C. Liu, V. Banzon, E. Freeman, G. Graham, B. Hankins, T. Smith, and H.-M. Zhang, 2021: Improvements of the Daily Optimum Interpolation Sea Surface Temperature (DOISST) Version 2.1, Journal of Climate, 34, 2923-2939. doi: 10.1175/JCLI-D-20-0166.1
  • Global Ocean OSTIA Sea Surface Temperature and Sea Ice Analysis. E.U. Copernicus Marine Service Information (CMEMS). Marine Data Store (MDS). DOI: https://doi.org/10.48670/moi-00165
  • ODYSSEA Global Sea Surface Temperature Gridded Level 4 Daily Multi-Sensor Observations. E.U. Copernicus Marine Service Information (CMEMS). Marine Data Store (MDS). DOI: https://doi.org/10.48670/moi-00016

Notes: The global analysis system was used to study the ocean surface temperature from 2021 and 2025. To study surface temperature for previous years (1991 to 2020), it was used the ESA CCI data. The other observation-based sea surface temperature products (OSTIA, OI SST and Odyssea) were used for calculating monthly mean and uncertainty values for March 2025.

 Marine Heatwaves

The results are obtained using the Copernicus Marine Service global systems including the analysis and forecasting system together with the reanalysis product.

  • GLOBAL_ANALYSISFORECAST_PHY_001_024 Global Ocean Physics Analysis and Forecast sea surface temperature. U. Copernicus Marine Service Information (CMEMS). Marine Data Store (MDS). DOI: https://doi.org/10.48670/moi-00016
  • GLOBAL_MULTIYEAR_PHY_001_030 Global Ocean Physics Reanalysis sea surface temperature. U. Copernicus Marine Service Information (CMEMS). Marine Data Store (MDS). DOI: https://doi.org/10.48670/moi-00021

Notes: The global analysis system was used to study MHWs for 2024 and 2025. To study MHWs for previous March (1993 to 2023), it was used the reanalysis system. The reanalysis product was used for generating a daily climatology using the 30-year period from 1993 to 2022