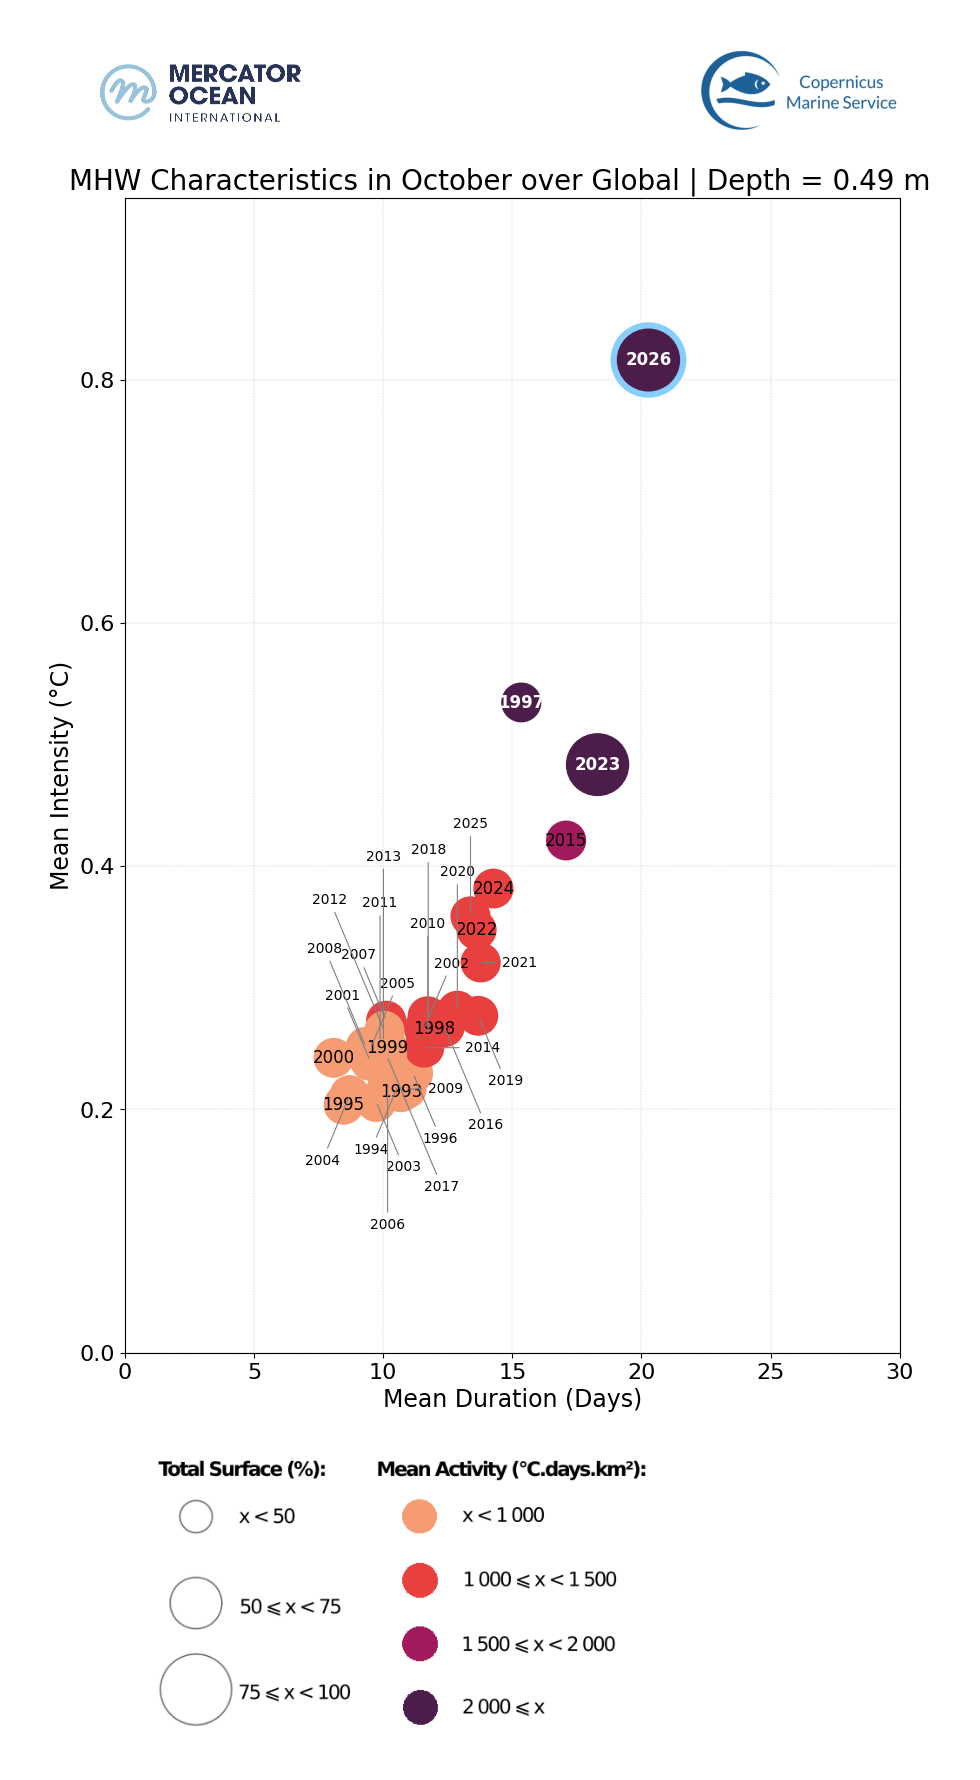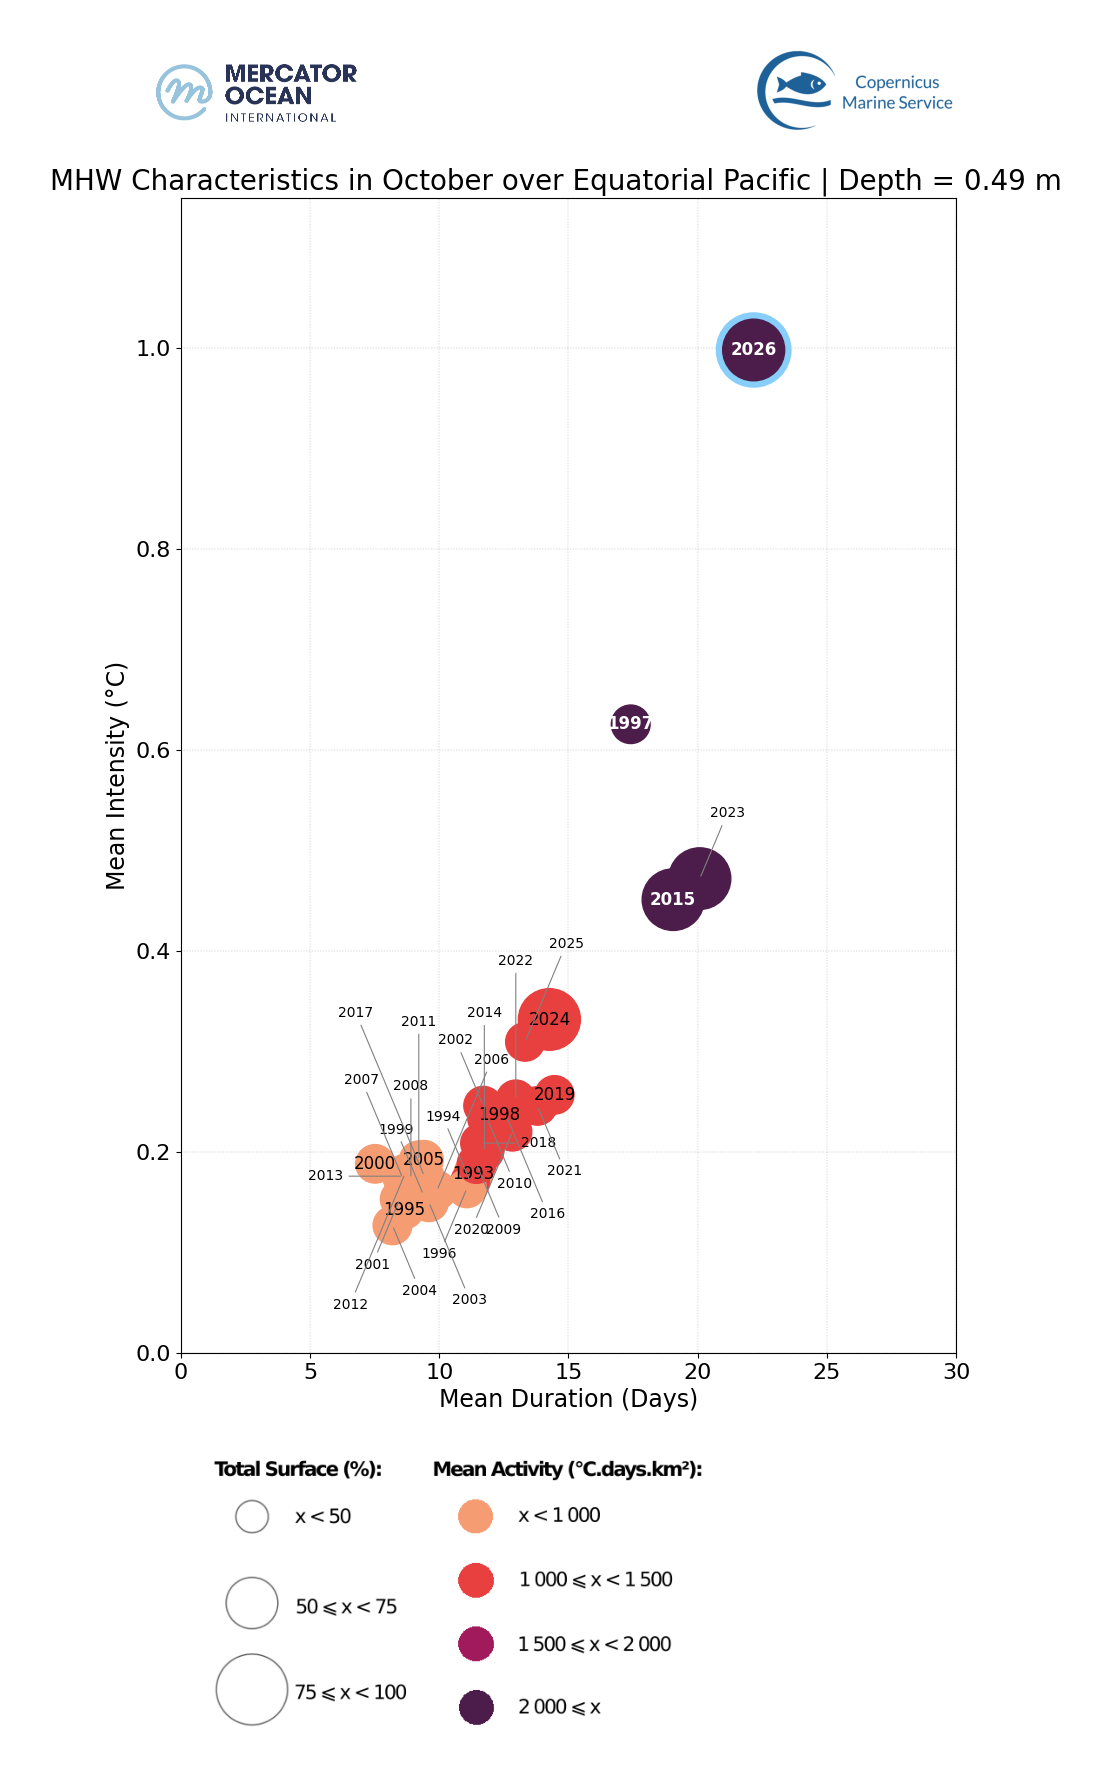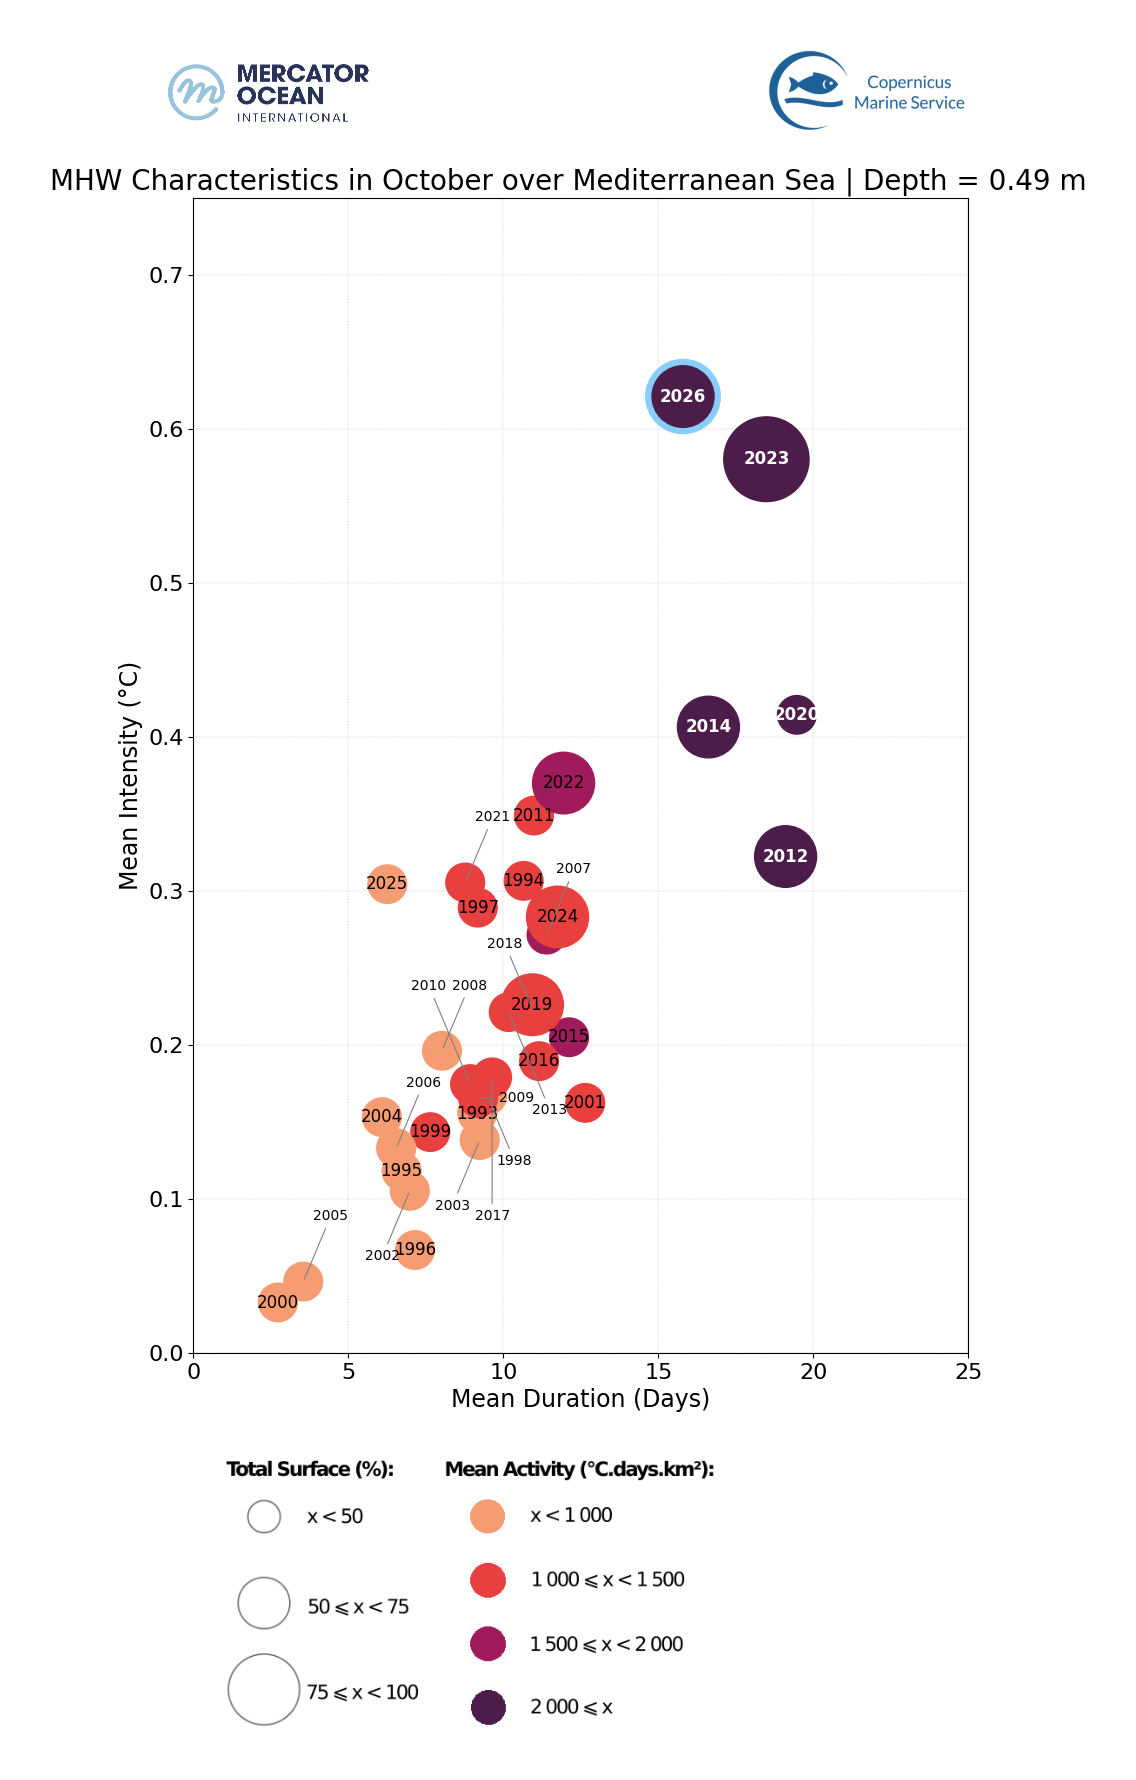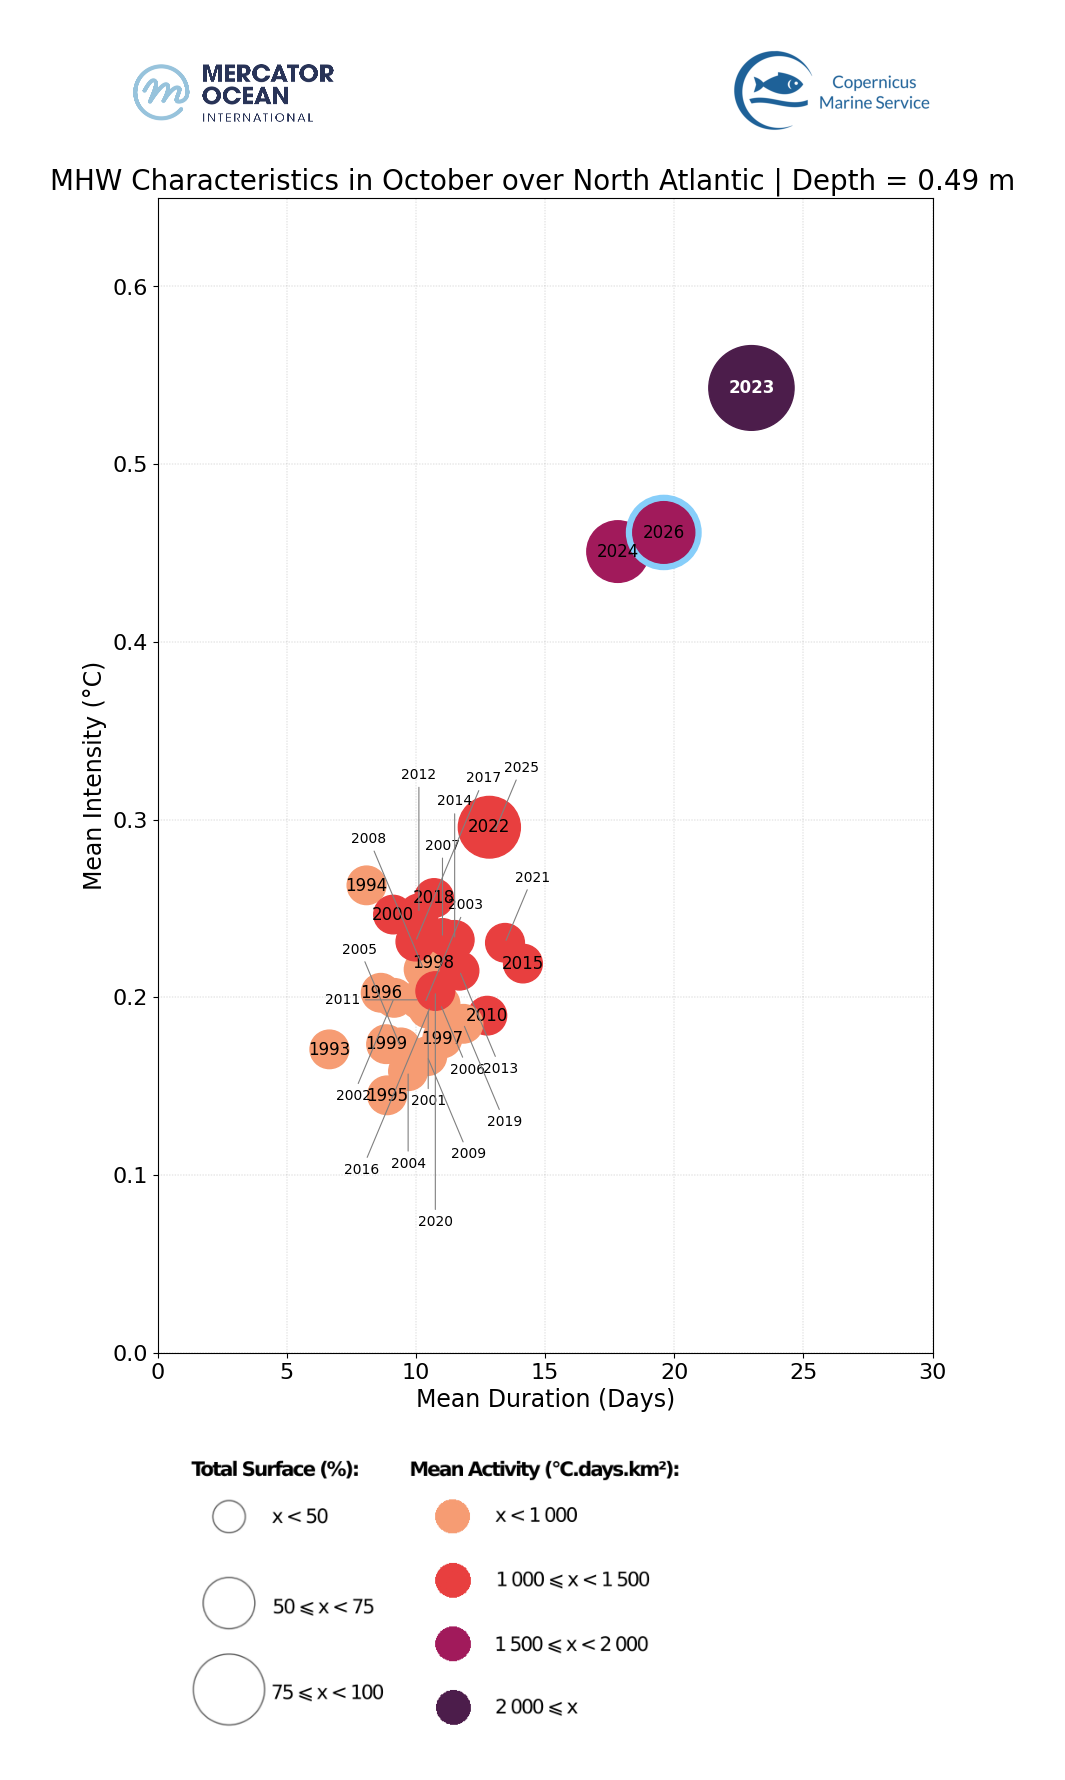
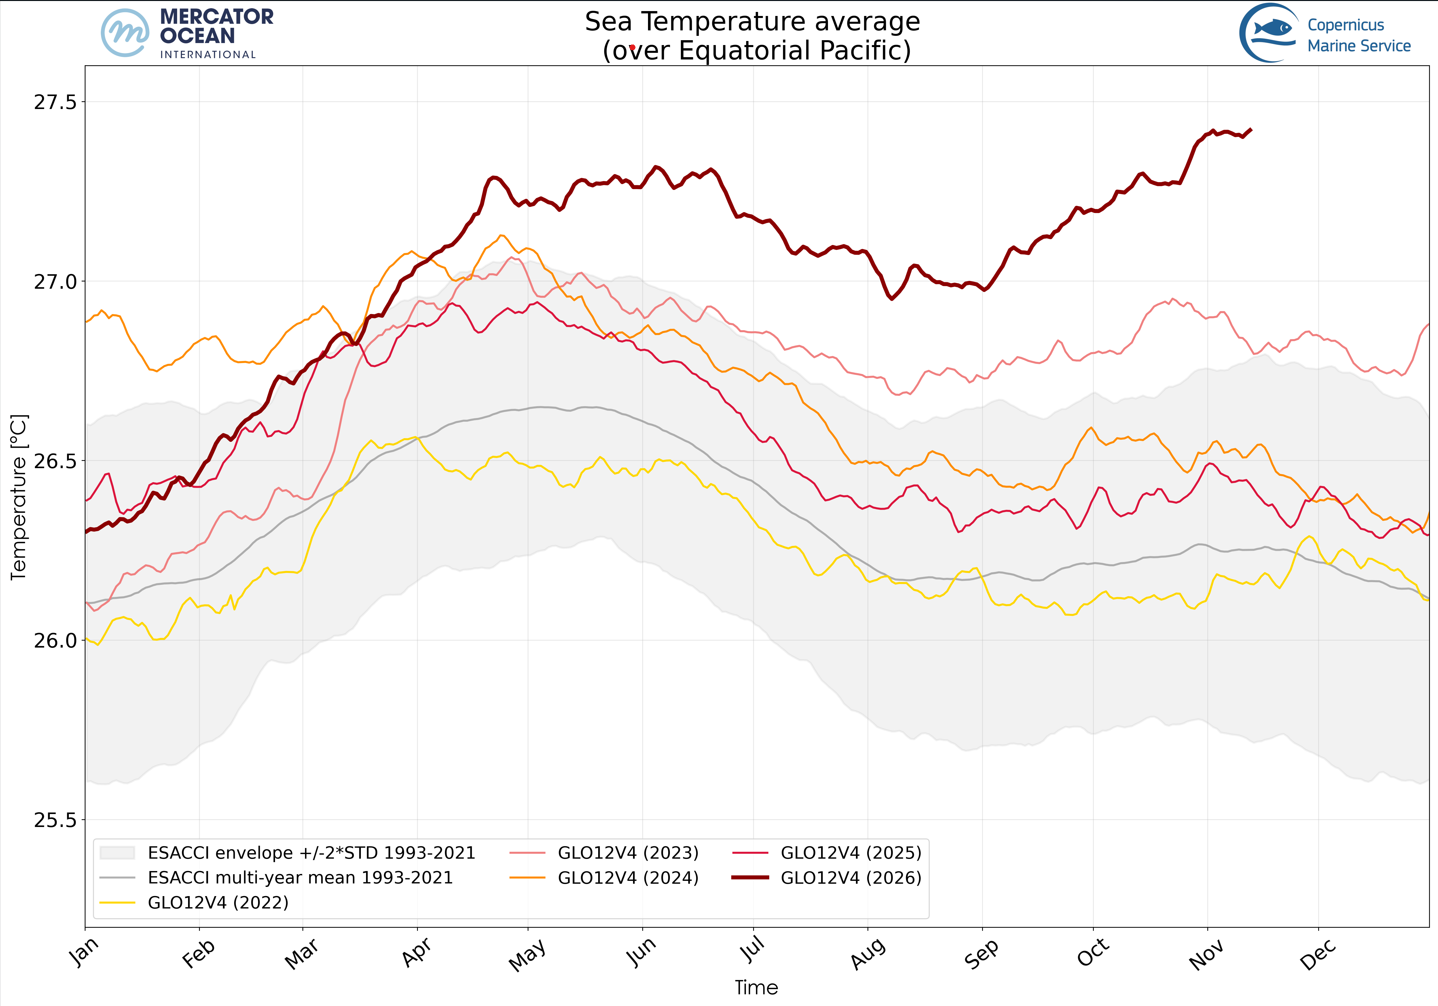
Mercator Ocean International (MOi) oceanographers examine marine heatwaves across the global ocean. They analyse a variety of datasets from observation analyses
(satellite sea surface temperature maps) to model analyses
(assimilating satellite and in situ observations) and model forecasts.¹


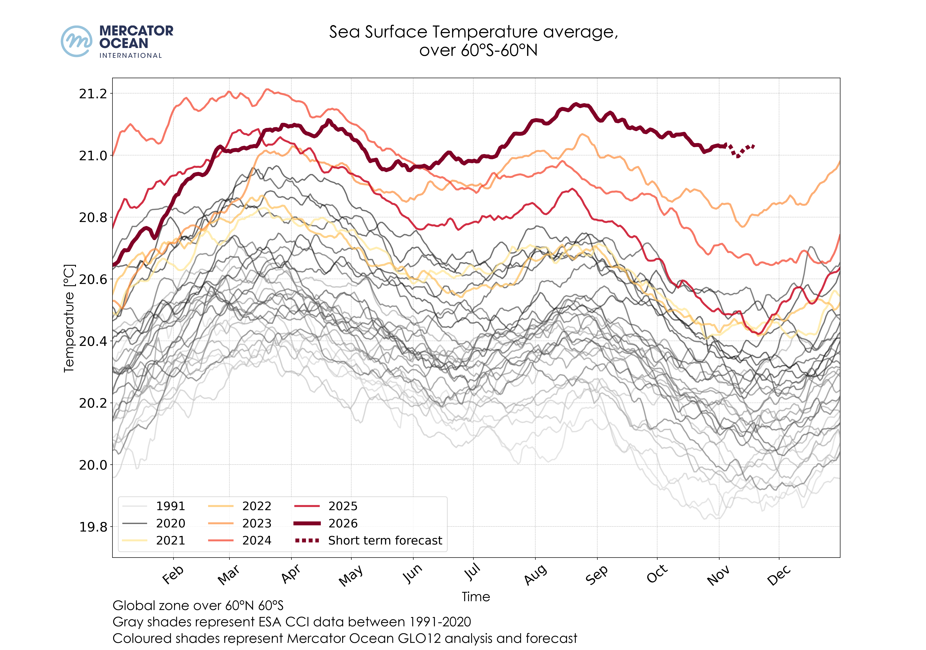
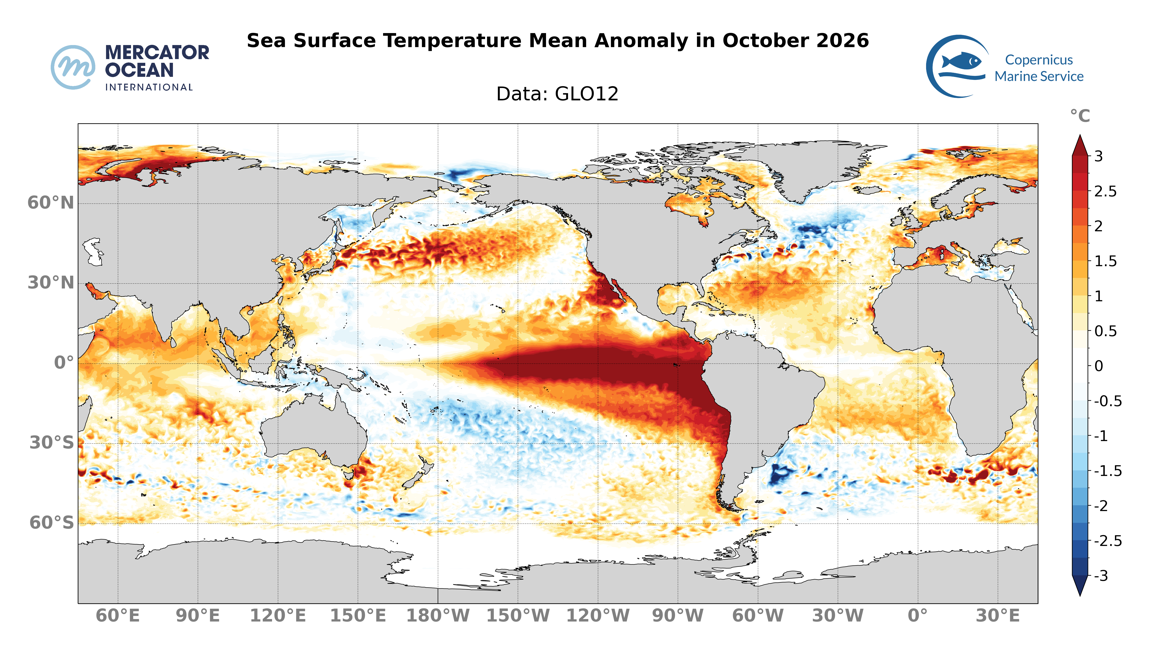
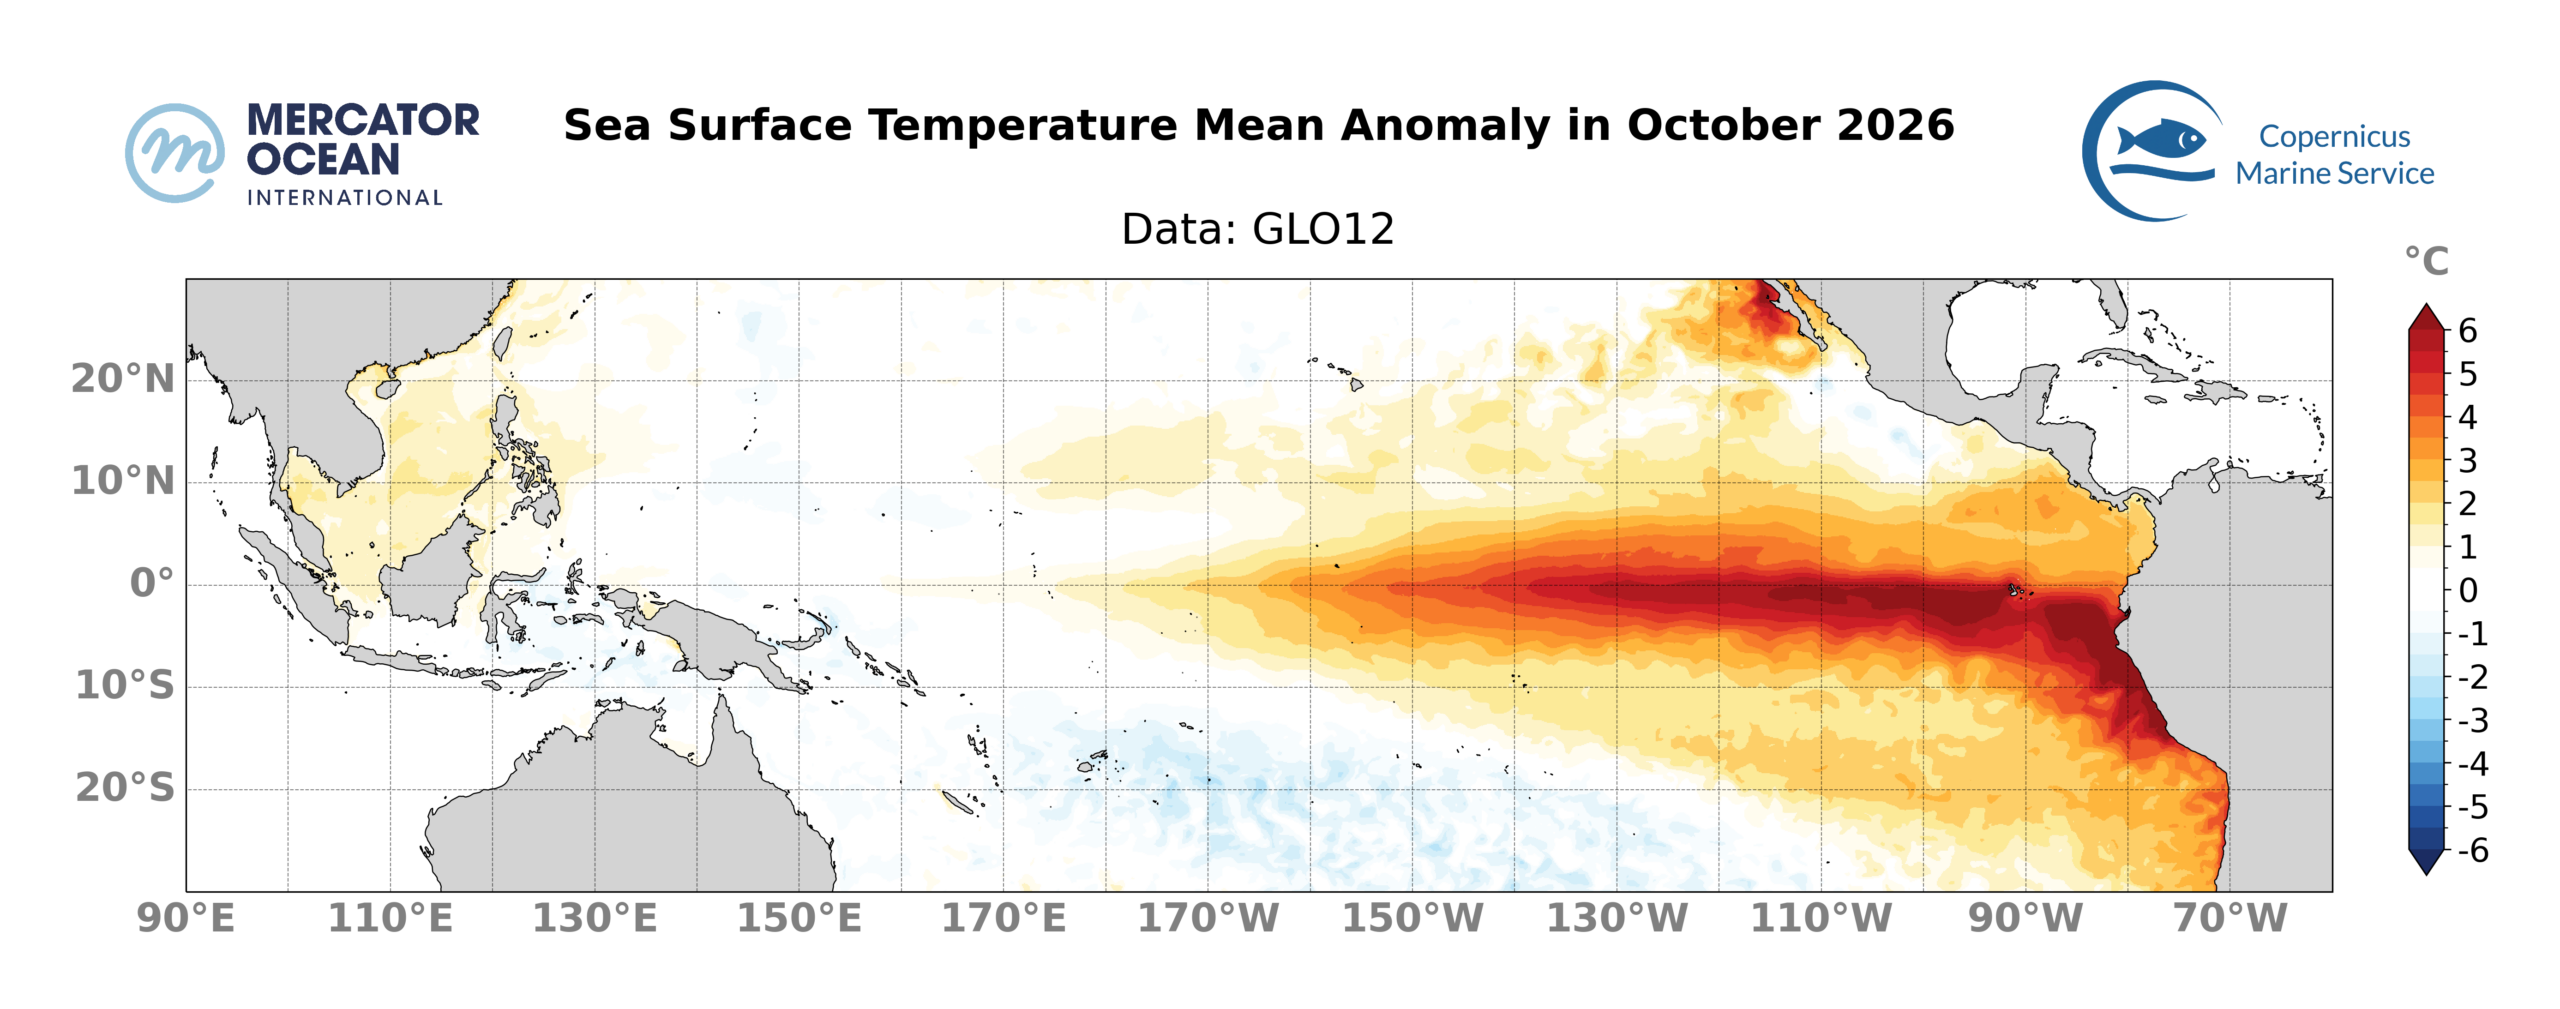
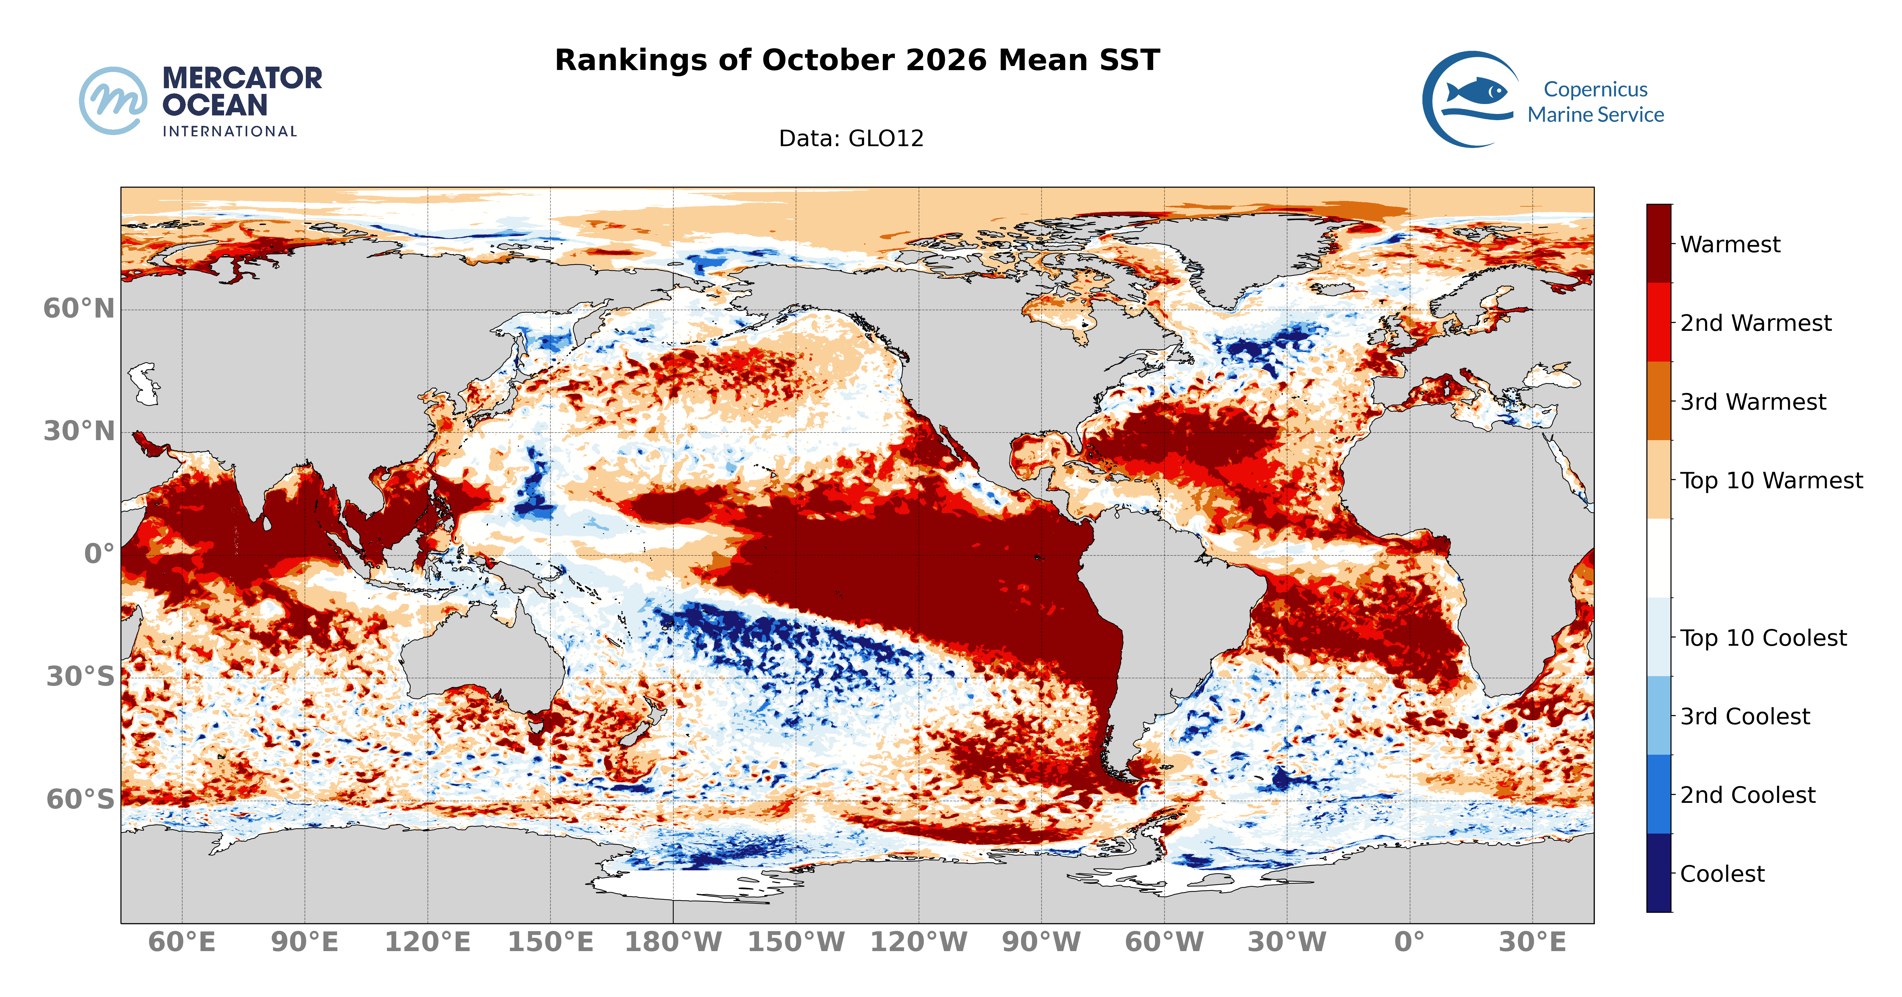
75% of the global ocean (between 60°S and 60°N) showed above average mean SSTs in October 2026, and 31% of the ocean was above average by at least 1°C.
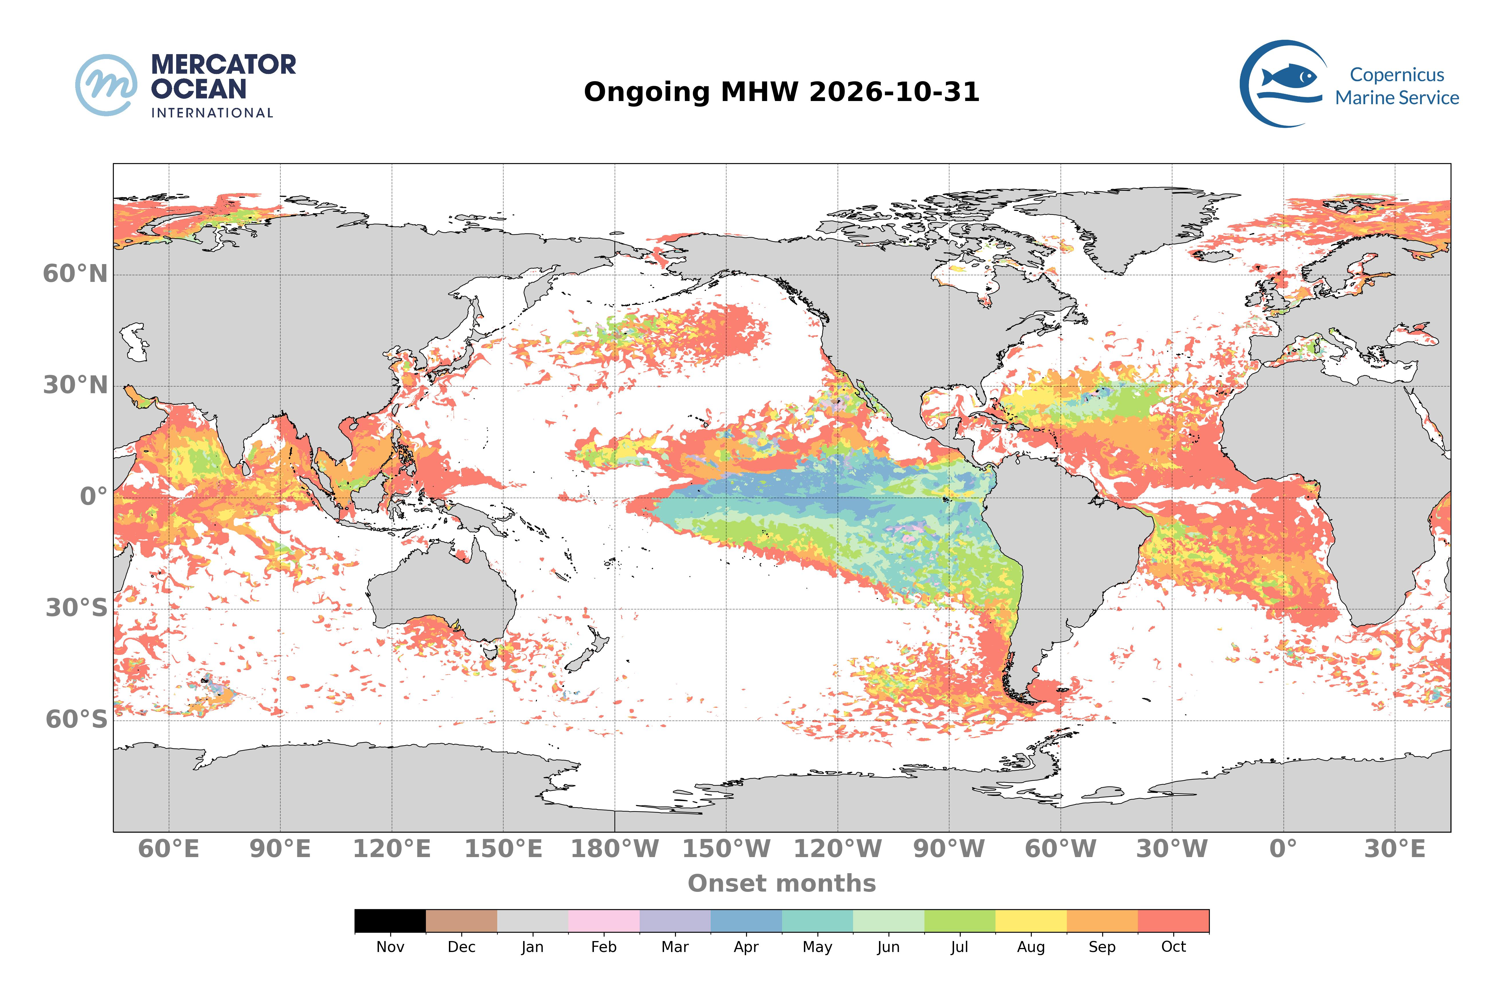
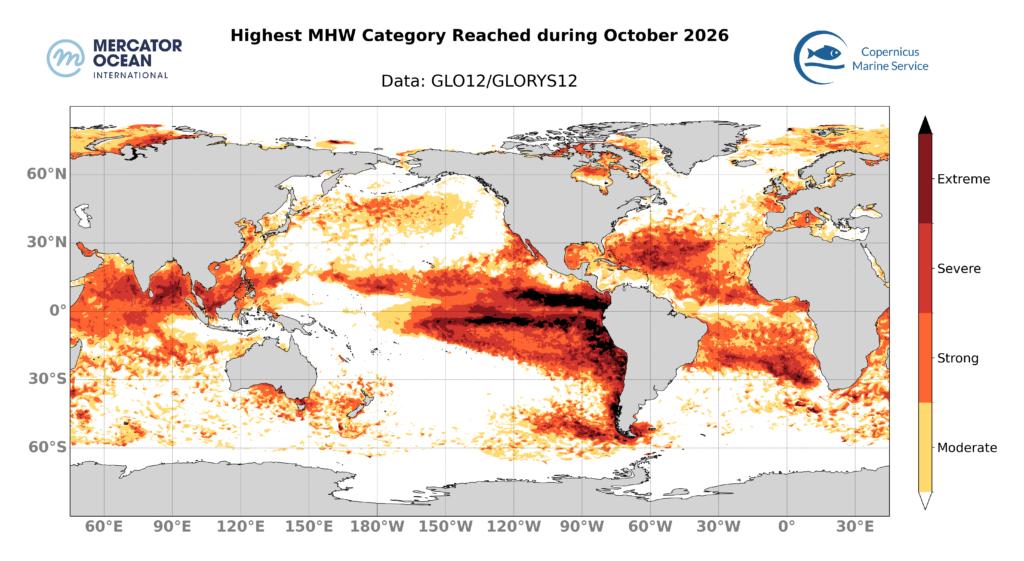
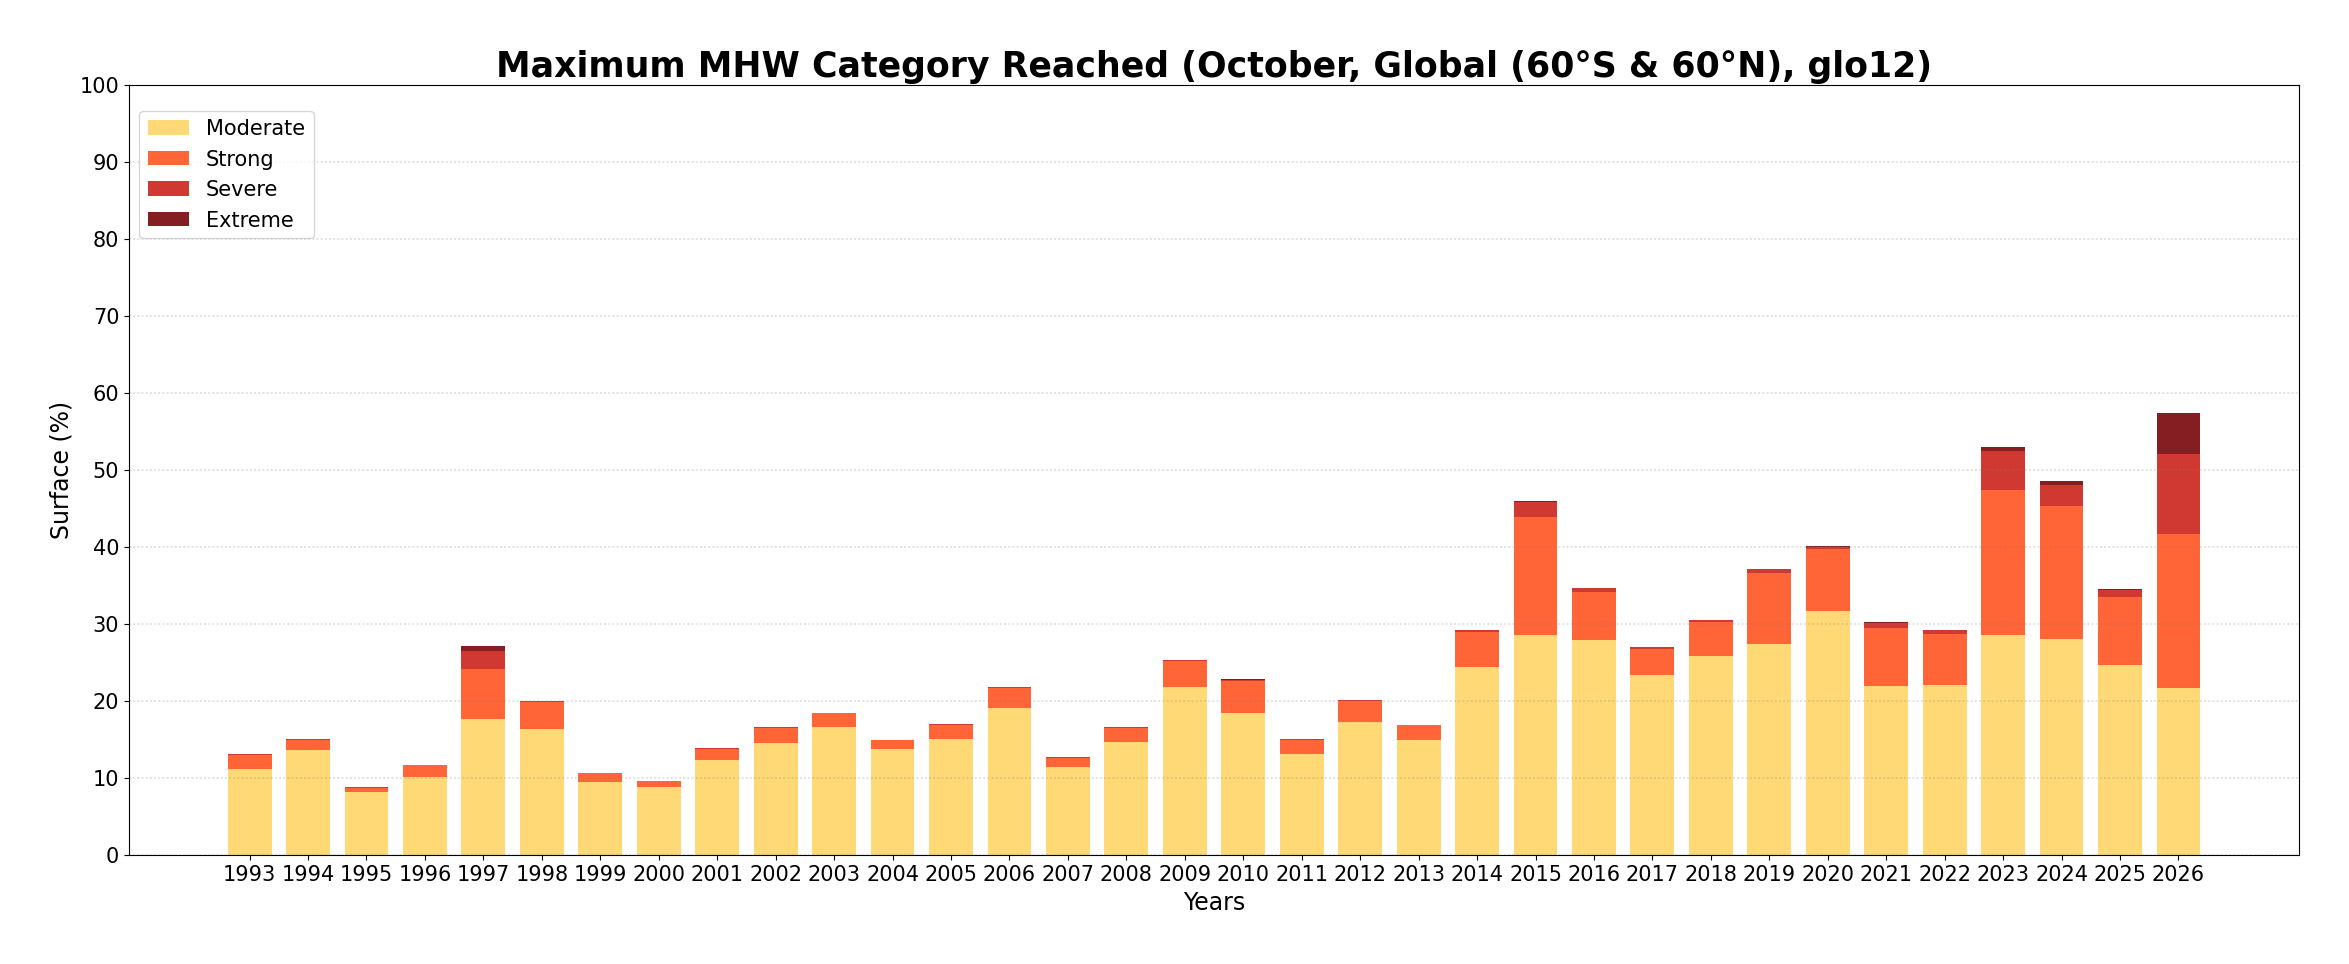
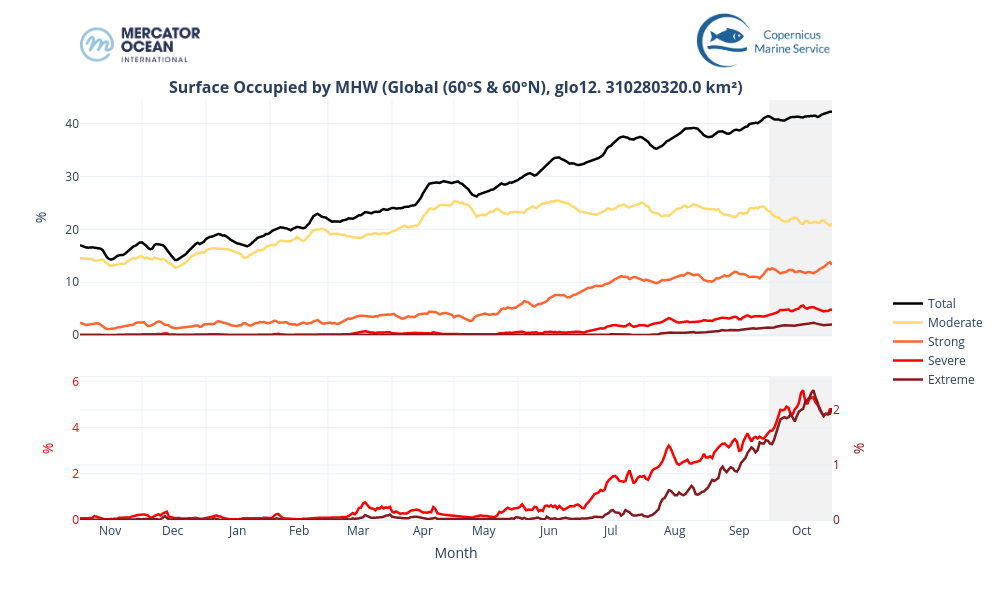
In October 2026, the total surface area of MHW (black line) slowly increased from 41% to 42% of the global ocean (between 60°S and 60°N. The majority of MHWs events were of moderate categories (between 20-23% of the global ocean) and strong category that reached around 12-13% of the global ocean. Severe MHWs were between 4% and more than 5% of the global ocean during October 2026. There has been a decline in the moderate categories, which have been replaced by higher MHW categories
Despite slower growth this month, MHW’s surface has been steadily increasing for nearly a year.
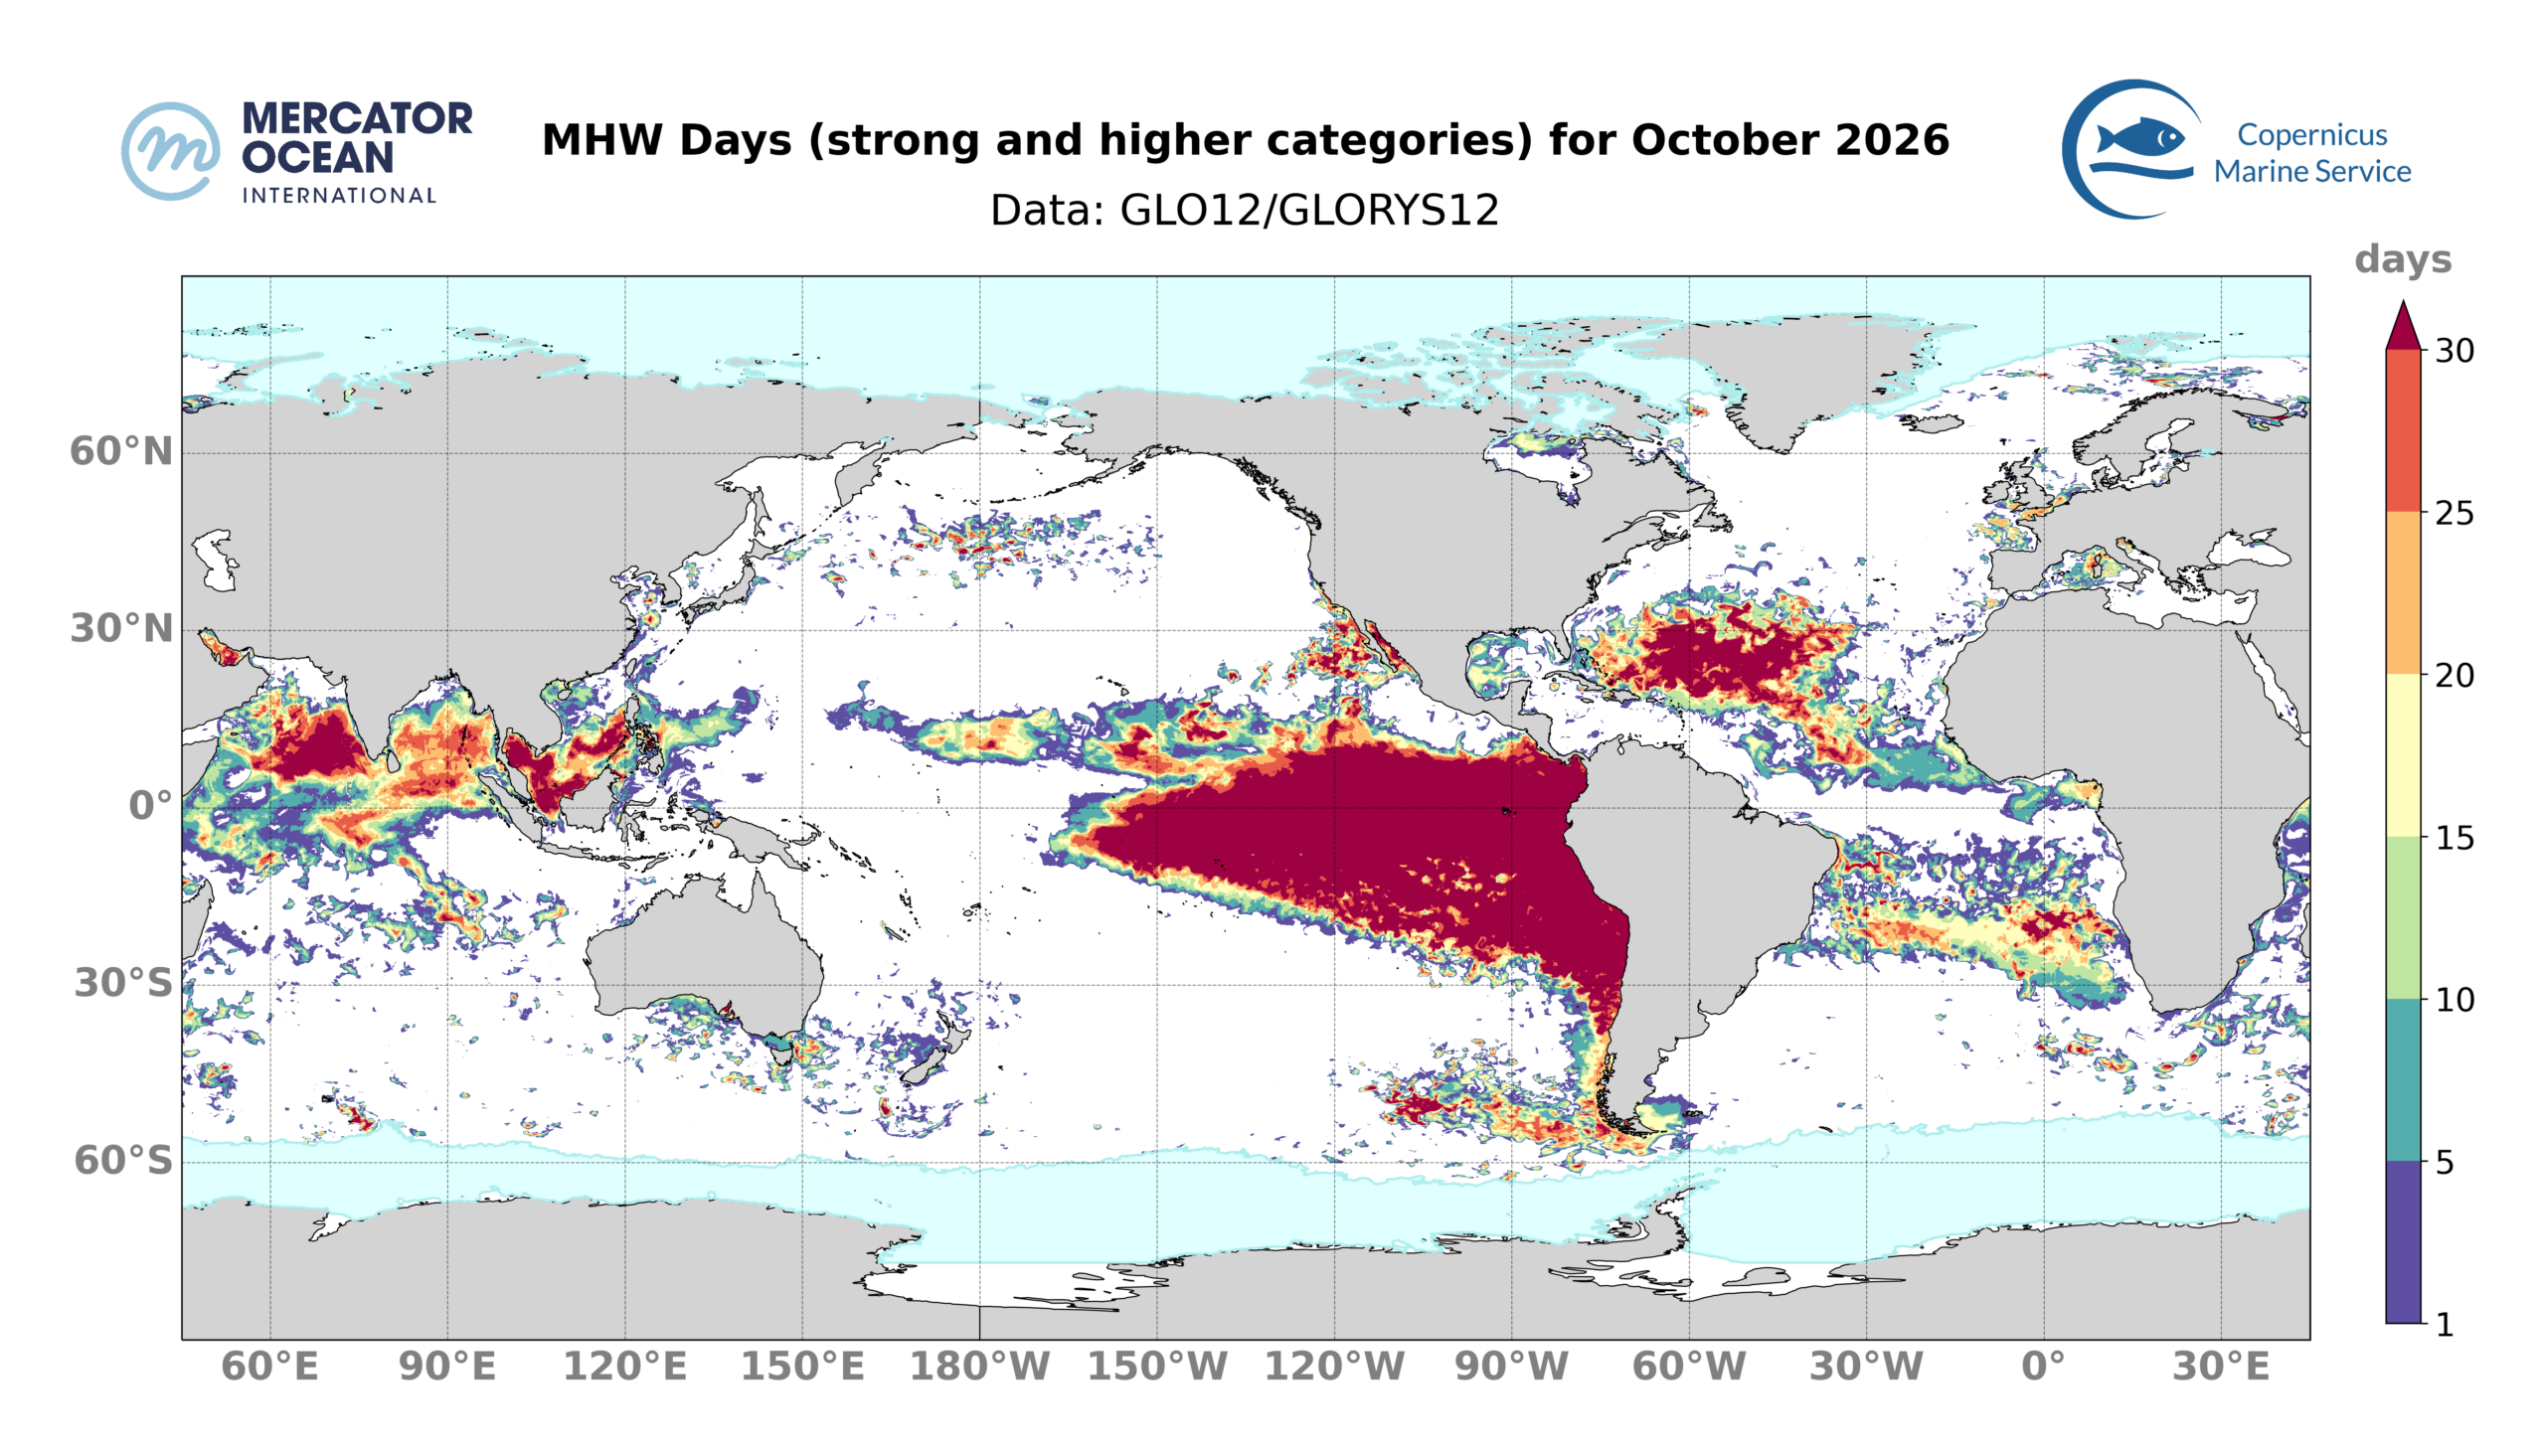
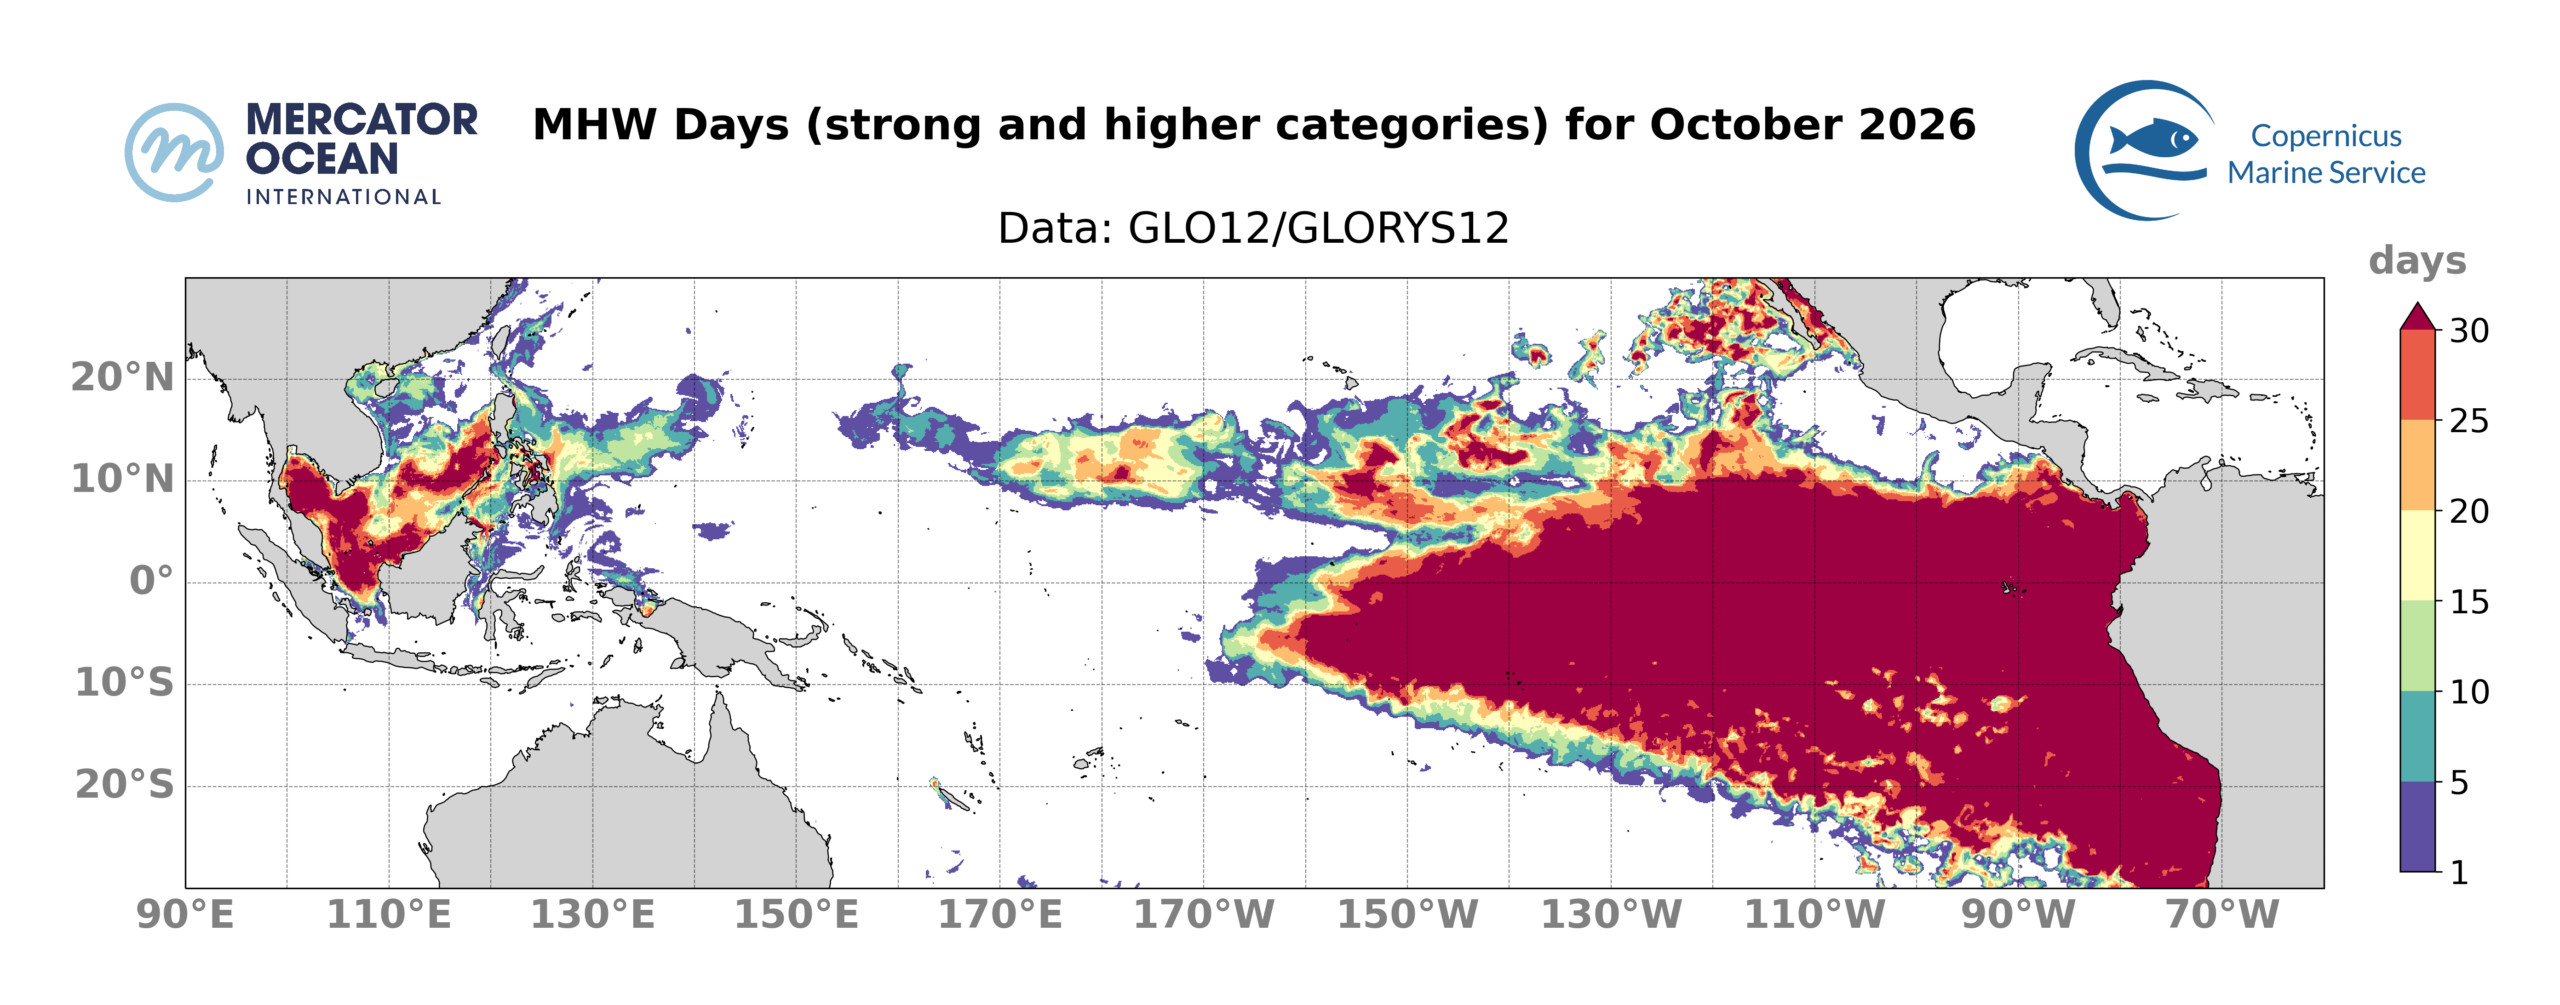
Mercator Ocean International publishes a monthly sea surface temperature bulletin reporting on mean temperature and marine heatwave conditions for the month or season just passed. It includes:
Sea Surface Temperature
The results are obtained using the Copernicus Marine Service global analysis and forecasting system together with observation-based products.
Notes: The global analysis system was used to study the ocean surface temperature from 2021 and 2025. To study surface temperature for previous years (1991 to 2020), it was used the ESA CCI data. The other observation-based sea surface temperature products (OSTIA, OI SST and Odyssea) were used for calculating monthly mean and uncertainty values for October 2026.
Marine Heatwaves
The results are obtained using the Copernicus Marine Service global systems including the analysis and forecasting system together with the reanalysis product.
Notes: The global analysis system was used to study MHWs for 2024 and 2025. To study MHWs for previous June, July and August months (1993 to 2025), it was used the reanalysis system. The reanalysis product was used for generating a daily climatology using the 30-year period from 1993 to 2022.