Ocean Temperature Bulletin
September 2026

Mercator Ocean International (MOi) oceanographers examine marine heatwaves across the global ocean. They analyse a variety of datasets from observation analyses
(satellite sea surface temperature maps) to model analyses
(assimilating satellite and in situ observations) and model forecasts.¹

All images in this article can be used freely and should be credited with the following information :
Image source: European Union, Copernicus Marine Service Data 2025 © Mercator Ocean .

Key takeaway

  • September 2026, was the warmest September on record, for the global ocean (between 60°S and 60°N), with a mean Sea Surface Temperature (SST) of 21.09 ± 0.08°C, exceeding the previous record set in 2023 (20.95±0.07°C).
  • The Mediterranean Sea experienced also the warmest September since 1993 with a mean SST of 27.34 ± 0.17°C, whereas the North Atlantic (between 0°N and 60°N), experienced the 2nd warmest September month with a mean SST of 25.29 ± 0.06°C.
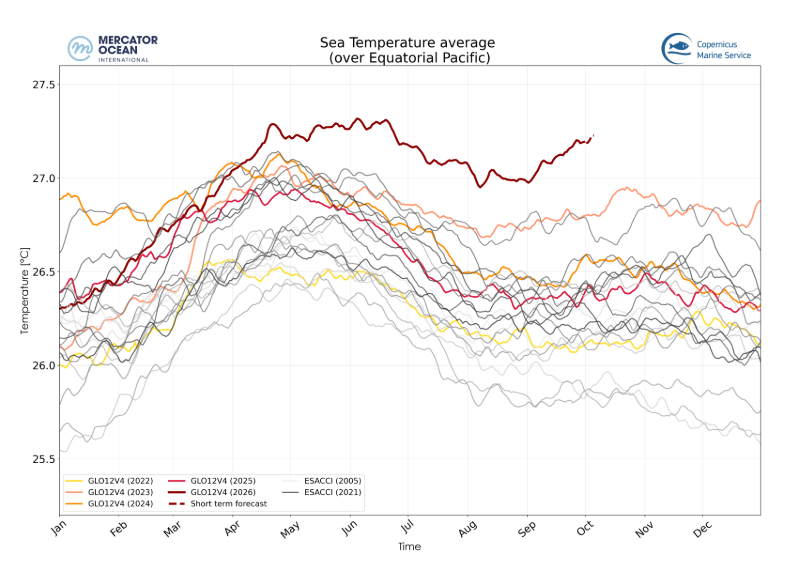
  • The Equatorial Pacific continued to experience high SSTs, with the coasts all the way from Central America to the Peru with anomaly values exceeding 4°C and potentially rising above 6°C the average for this time of the year – caused by the intensification of the current El Niño phase impacting the region
  • By the end of September 2026, the most persistent marine heatwaves were occurring in the central Pacific, where they had lasted for nearly 9 months.
  • Marine heatwaves lasting up to 3–4 months were also observed in the Mediterranean Sea, the Bay of Biscay and the equatorial Pacific.

sea Surface Temperature


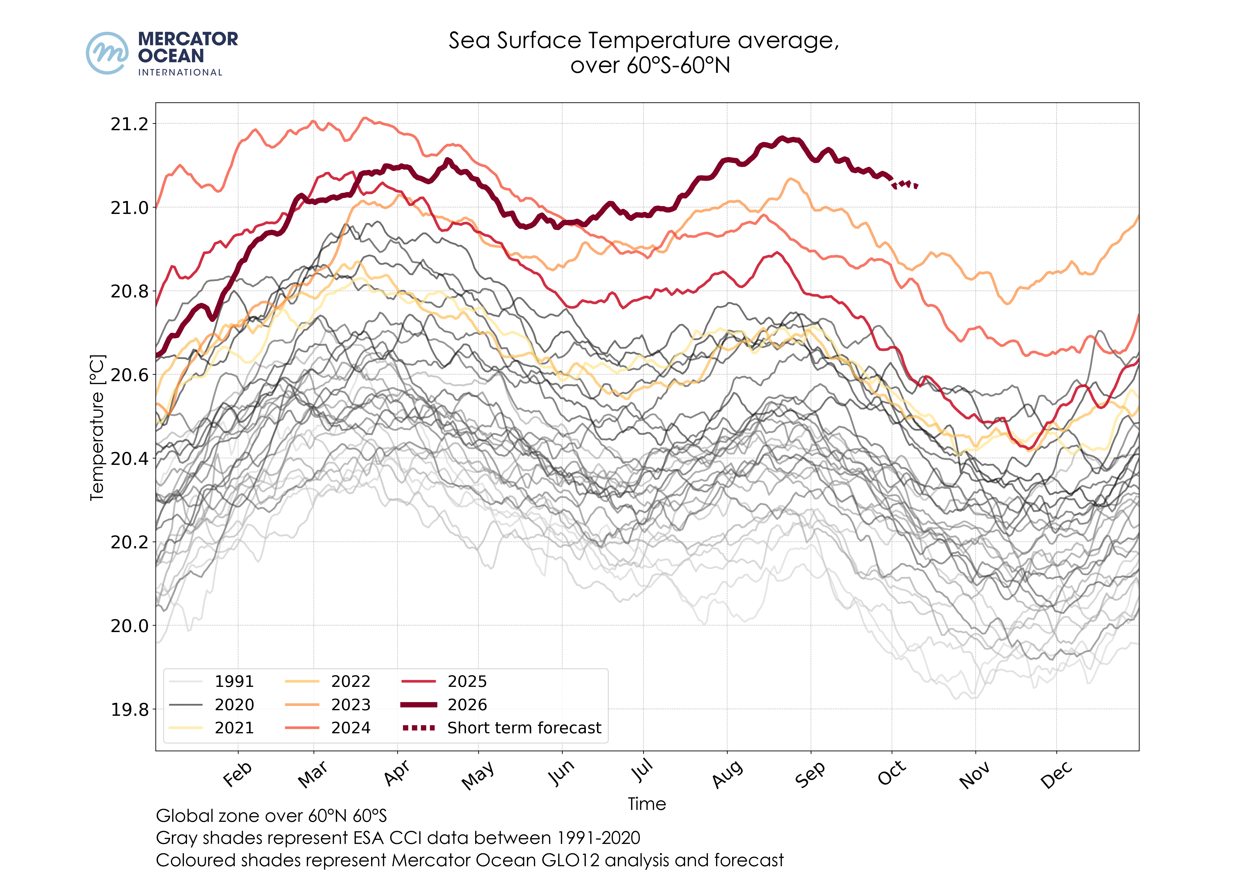
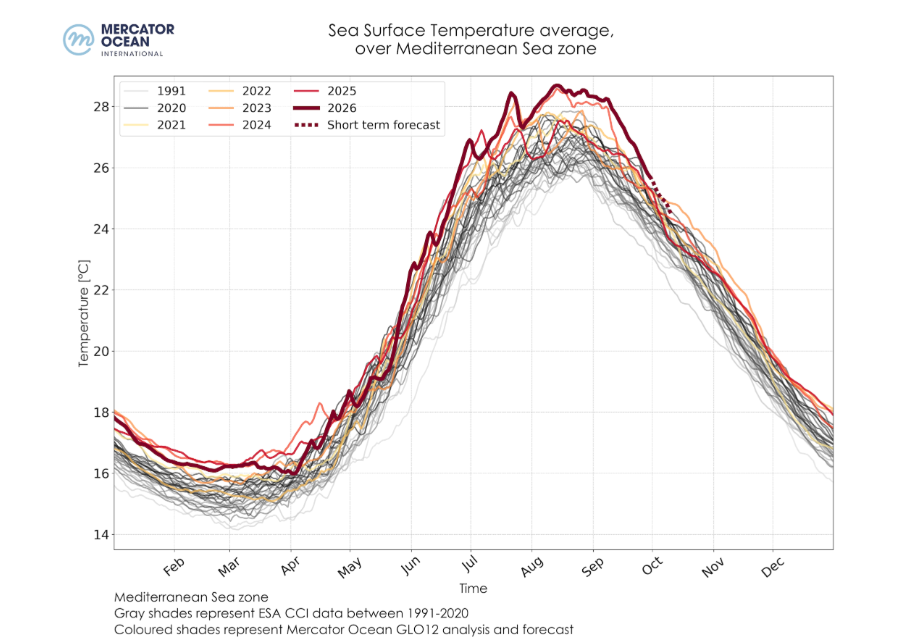
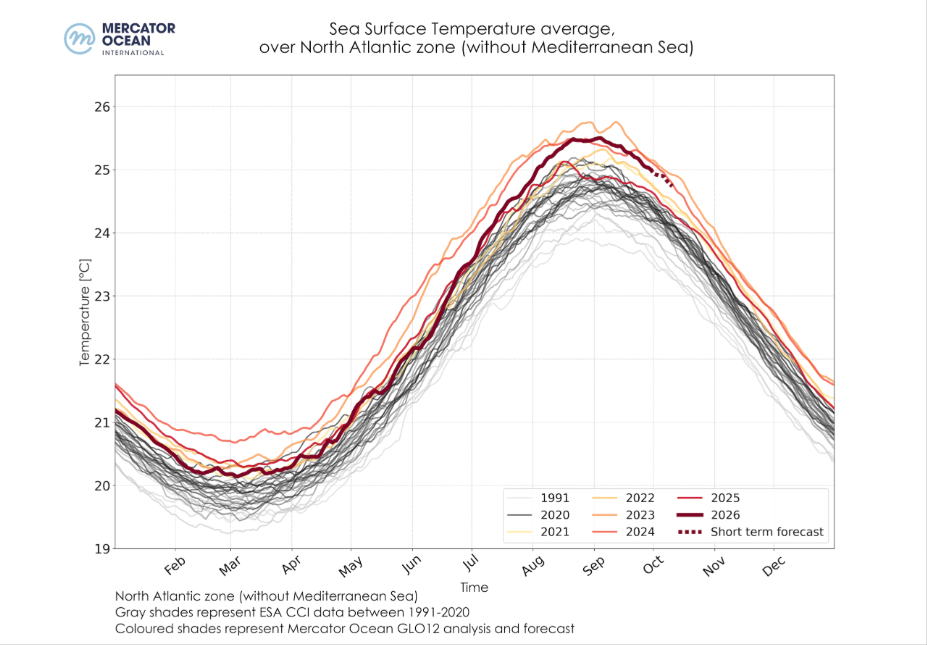
Daily sea surface temperatures averaged for the global ocean (left), the Mediterranean Sea (middle) and the North Atlantic Ocean (right) between 1991-2020 using ESA’s Climate Change Initiative (grey shades), and between 2021-2026 (coloured shades) using Mercator Ocean International’s GLO12 analysis and forecast.
  • September 2026, was the warmest September on record, for the global ocean (between 60°S and 60°N), with a mean Sea Surface Temperature (SST) of 21.09 ± 0.08°C, exceeding the previous record set in 2023 (20.95±0.07°C).
  • In the Mediterranean Sea, September 2026 was also the warmest September on record, with a mean SST of 27.34 ± 0.17°C , which is almost 1°C higher than the previous record set in September 2024 (26.43 ± 0.28 °C).
  • In the North Atlantic (between 0°N and 60°N), September 2026 was the 2nd warmest September month with a mean SST of 25.29 ± 0.06°C, only behind September 2023 (25.47 ± 0.06°C).


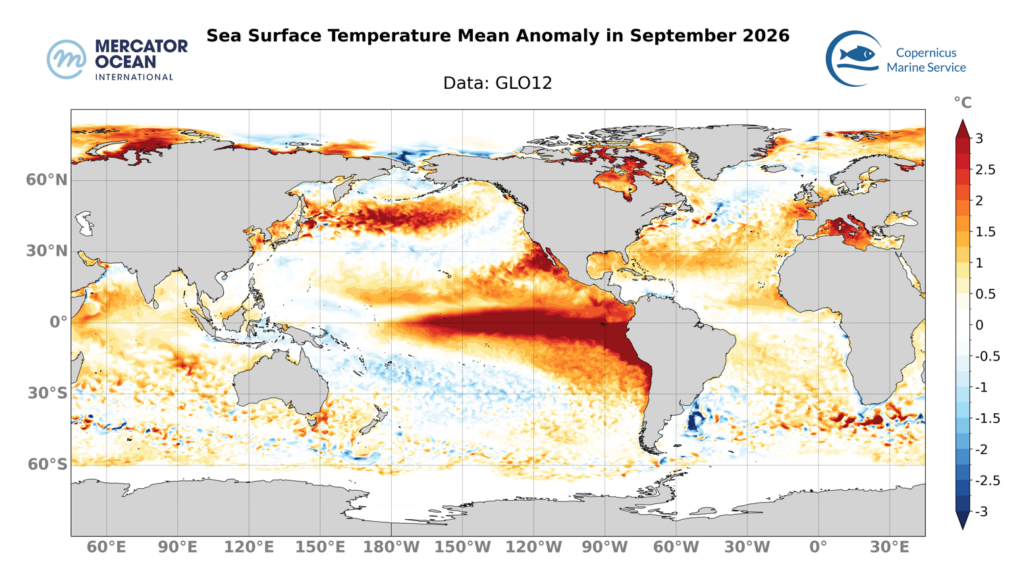
Mean sea surface temperature anomaly in September 2026 relative to a 30-year climatology (1993-2022), calculated using daily data from Mercator Ocean International’s GLO12 analysis and forecasting system for 2026 and from the GLORYS12 reanalysis for the climatological mean.


During the past month, 76% of the global ocean (between 60°S and 60°N) showed above average mean SSTs, and 27% of the global ocean is above average by at least 1°C (Figure 2).  
  • Most of the Mediterranean Sea (95%) showed above-average SSTs, with stronger SSTs in the western part, reaching more than 3°C in the Adriatic Sea and along the French and Italian coast. 70% of the Mediterranean Sea is above average by at least 1°C 
  • The North Pacific Ocean has seen sea surface temperatures (SSTs) that were mostly above average, covering a band in the Sea of Japan and in the central North Pacific, reaching or even exceeding 3 °C above average. In the subtropical region, between 160°E and Mexico and along the coasts, sea surface temperatures (SSTs) reached values between 2 and 3 °C above average, even exceeding 3 °C along the coasts. In the South Pacific, SSTs are between 1 and 2°C above average around New Zealand and may locally reach 2.5 °C in south-eastern Australia. Along a diagonal stretching from Papua New Guinea to the southern part of the basin, around 120°W, the basin is covered with SSTs between 1 and 2°C below average. 
  • 70% of the Equatorial Pacific showed above-average SSTs, with 41% exceeding 1°C or more. The entire band between 180°W and the coast of South America is characterised by high SSTs, with large areas exceeding 3°C above average. Near the coasts, these above-average SSTs extend from Central America to the Peruvian coast, with values exceeding 4°C and potentially rising above 6°C. This development marks the intensification of the El Niño.  
  • 85% of the North Atlantic show above average mean SST, with 27% above average by at least 1°C. A broad band of above-average sea surface temperatures (SST) extends across the basin, from the Gulf of Mexico to the west and north of Europe, where SSTs are approaching 2 °C above average and have locally reached 3 °C, particularly in the Bay of Biscay and the North Sea. Off the coast of Guinea, sea surface temperatures are 1 to 2°C above average, even exceeding 2°C along the coast. Mid-latitudes showed below-average SSTs, between the Canadian coast and 30°W (“cold blob” region) 
  • The South Atlantic showed patchy above-average SSTs across the entire width of the basin, between 30°S and 50°S. SSTs reached more than 3°C above average off the coast of South Africa.
  • In the Indian Ocean, above-average sea surface temperatures (SSTs) are being observed to the east and north of Madagascar, as well as to the south of the Arabian Sea and in the south- west of Indonesia (around 90°E), where they are locally close to 2.5 °C above average. 

Ranking September 2026 record SST


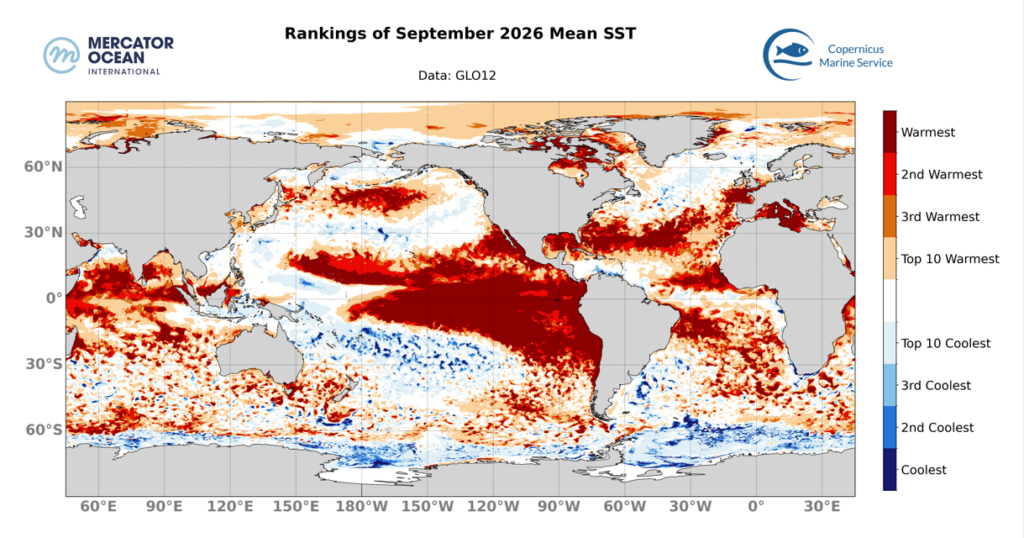
Ranking of monthly August 2026 SSTs against previous August months of the historical period (since 1993). 

The ranking of average monthly SSTs is monitored in order to contextualise the current situation relative to previous Septembers. This ranking is based on September monthly SST averages from 1993 to 2026. Here, we look at the ranking of September 2026 among all September months since 1993. 
  • Around 20% of the global ocean (between 60°S and 60°N) ranked as the warmest September month on record, with regions in the tropical Pacific, subtropical North Atlantic and surrounding western Europe most affected.
  • Regions such as the subtropical north of the Pacific, the mid-latitudes of the North Pacific and the Indian Ocean are also characterised by vast areas where September 2026 was the warmest on record. 40% of the Global ocean was among the four warmest Septembers on record.
  • 53% of the Mediterranean Sea ranked as the warmest September month on record and 71% of its area was among the four warmest Septembers on record.
  • In the Equatorial Pacific, 35% of its area was ranked as the warmest September month on record.


Ongoing Marine Heatwaves

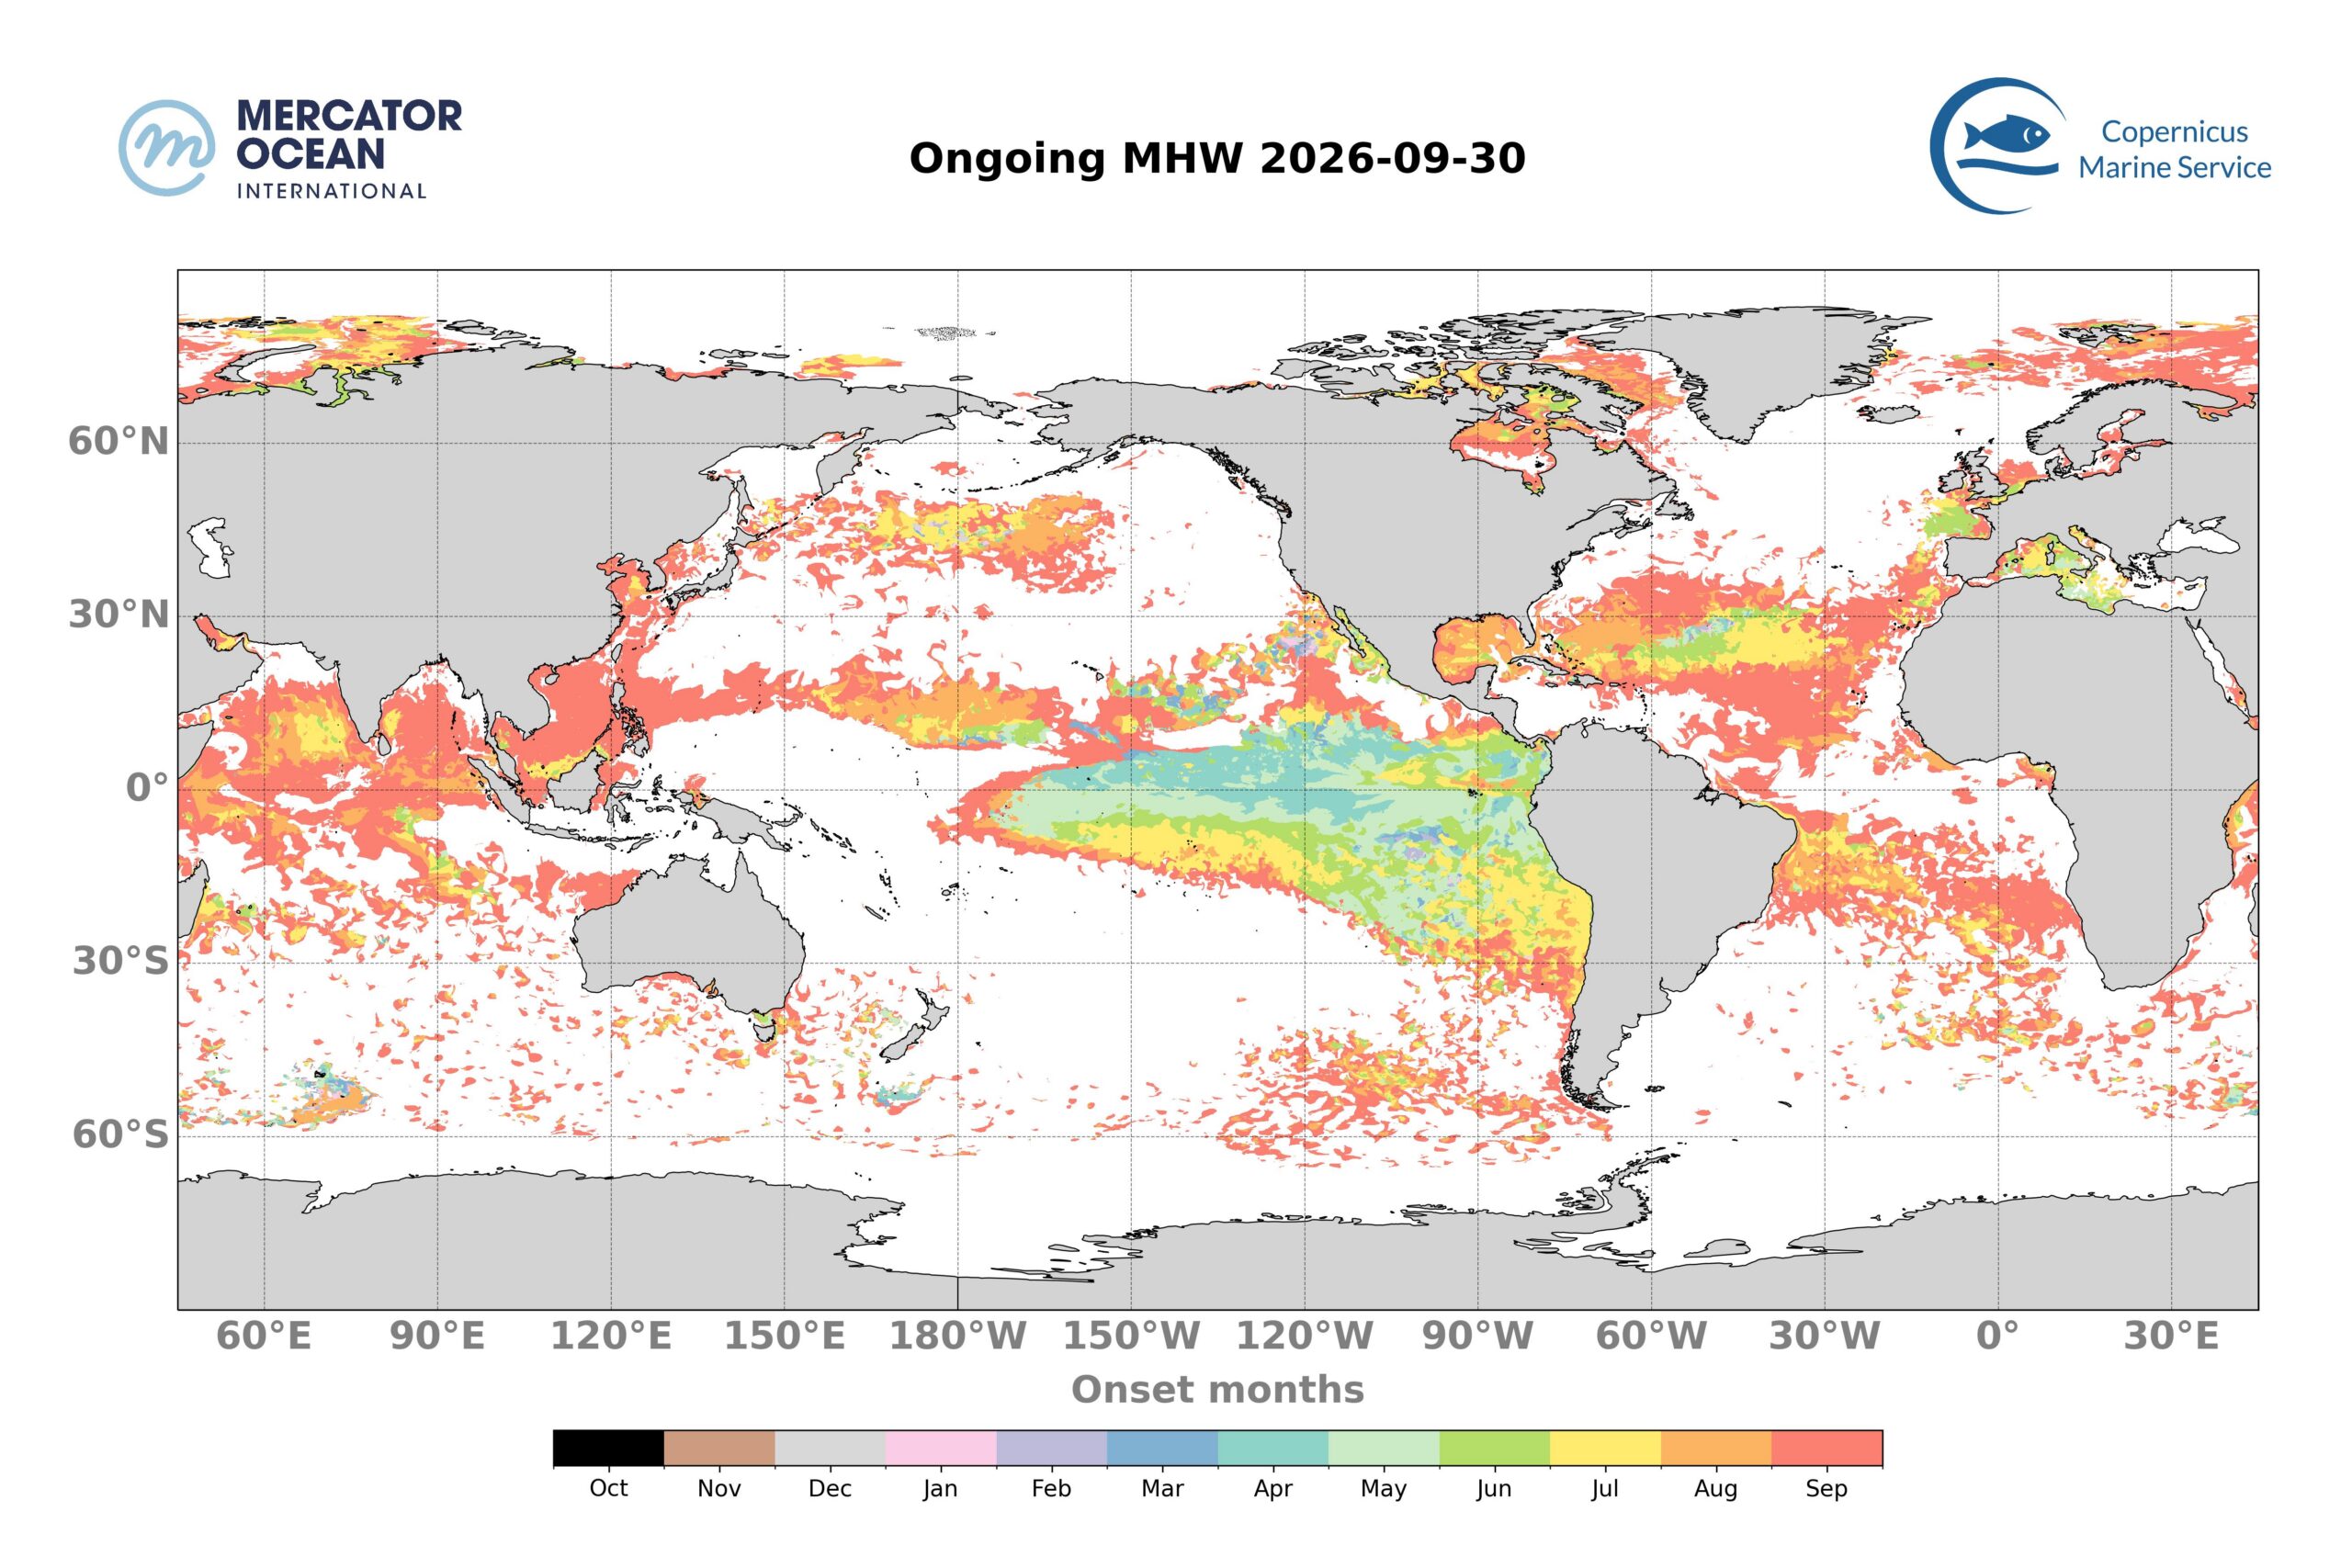
Month of onset for the ongoing MHWs on the 30th of September 2026. The colours indicate the month during which the MHW started. For instance, ocean pixels in red correspond to an MHW that developed during September 2026 and are less than one month old, in orange MHW between 1 and 2 months old, etc.


  • On the 30th of September, 41% of the global ocean (between 60°S and 60°N) was affected by MHWs.
  • The majority of these MHWs developed recently, with 21% of the global Ocean (between 60°S and 60°N) affected by MHWs less than 1 month old and 12% by events between 1 and 3 month old.
  • 8% of the global Ocean is affected by events more than 3 month old. These persistent events are mainly found in the Equatorial Pacific, in connection with the ongoing El Niño episode.
  • Oldest MHW are developed since January in the south of California.   
  • In the subtropical Atlantic, in the Bay of Biscay and the Mediterranean Sea, MHWs have been present for 3 to 4 months.

Total Surface Marine Heatwaves

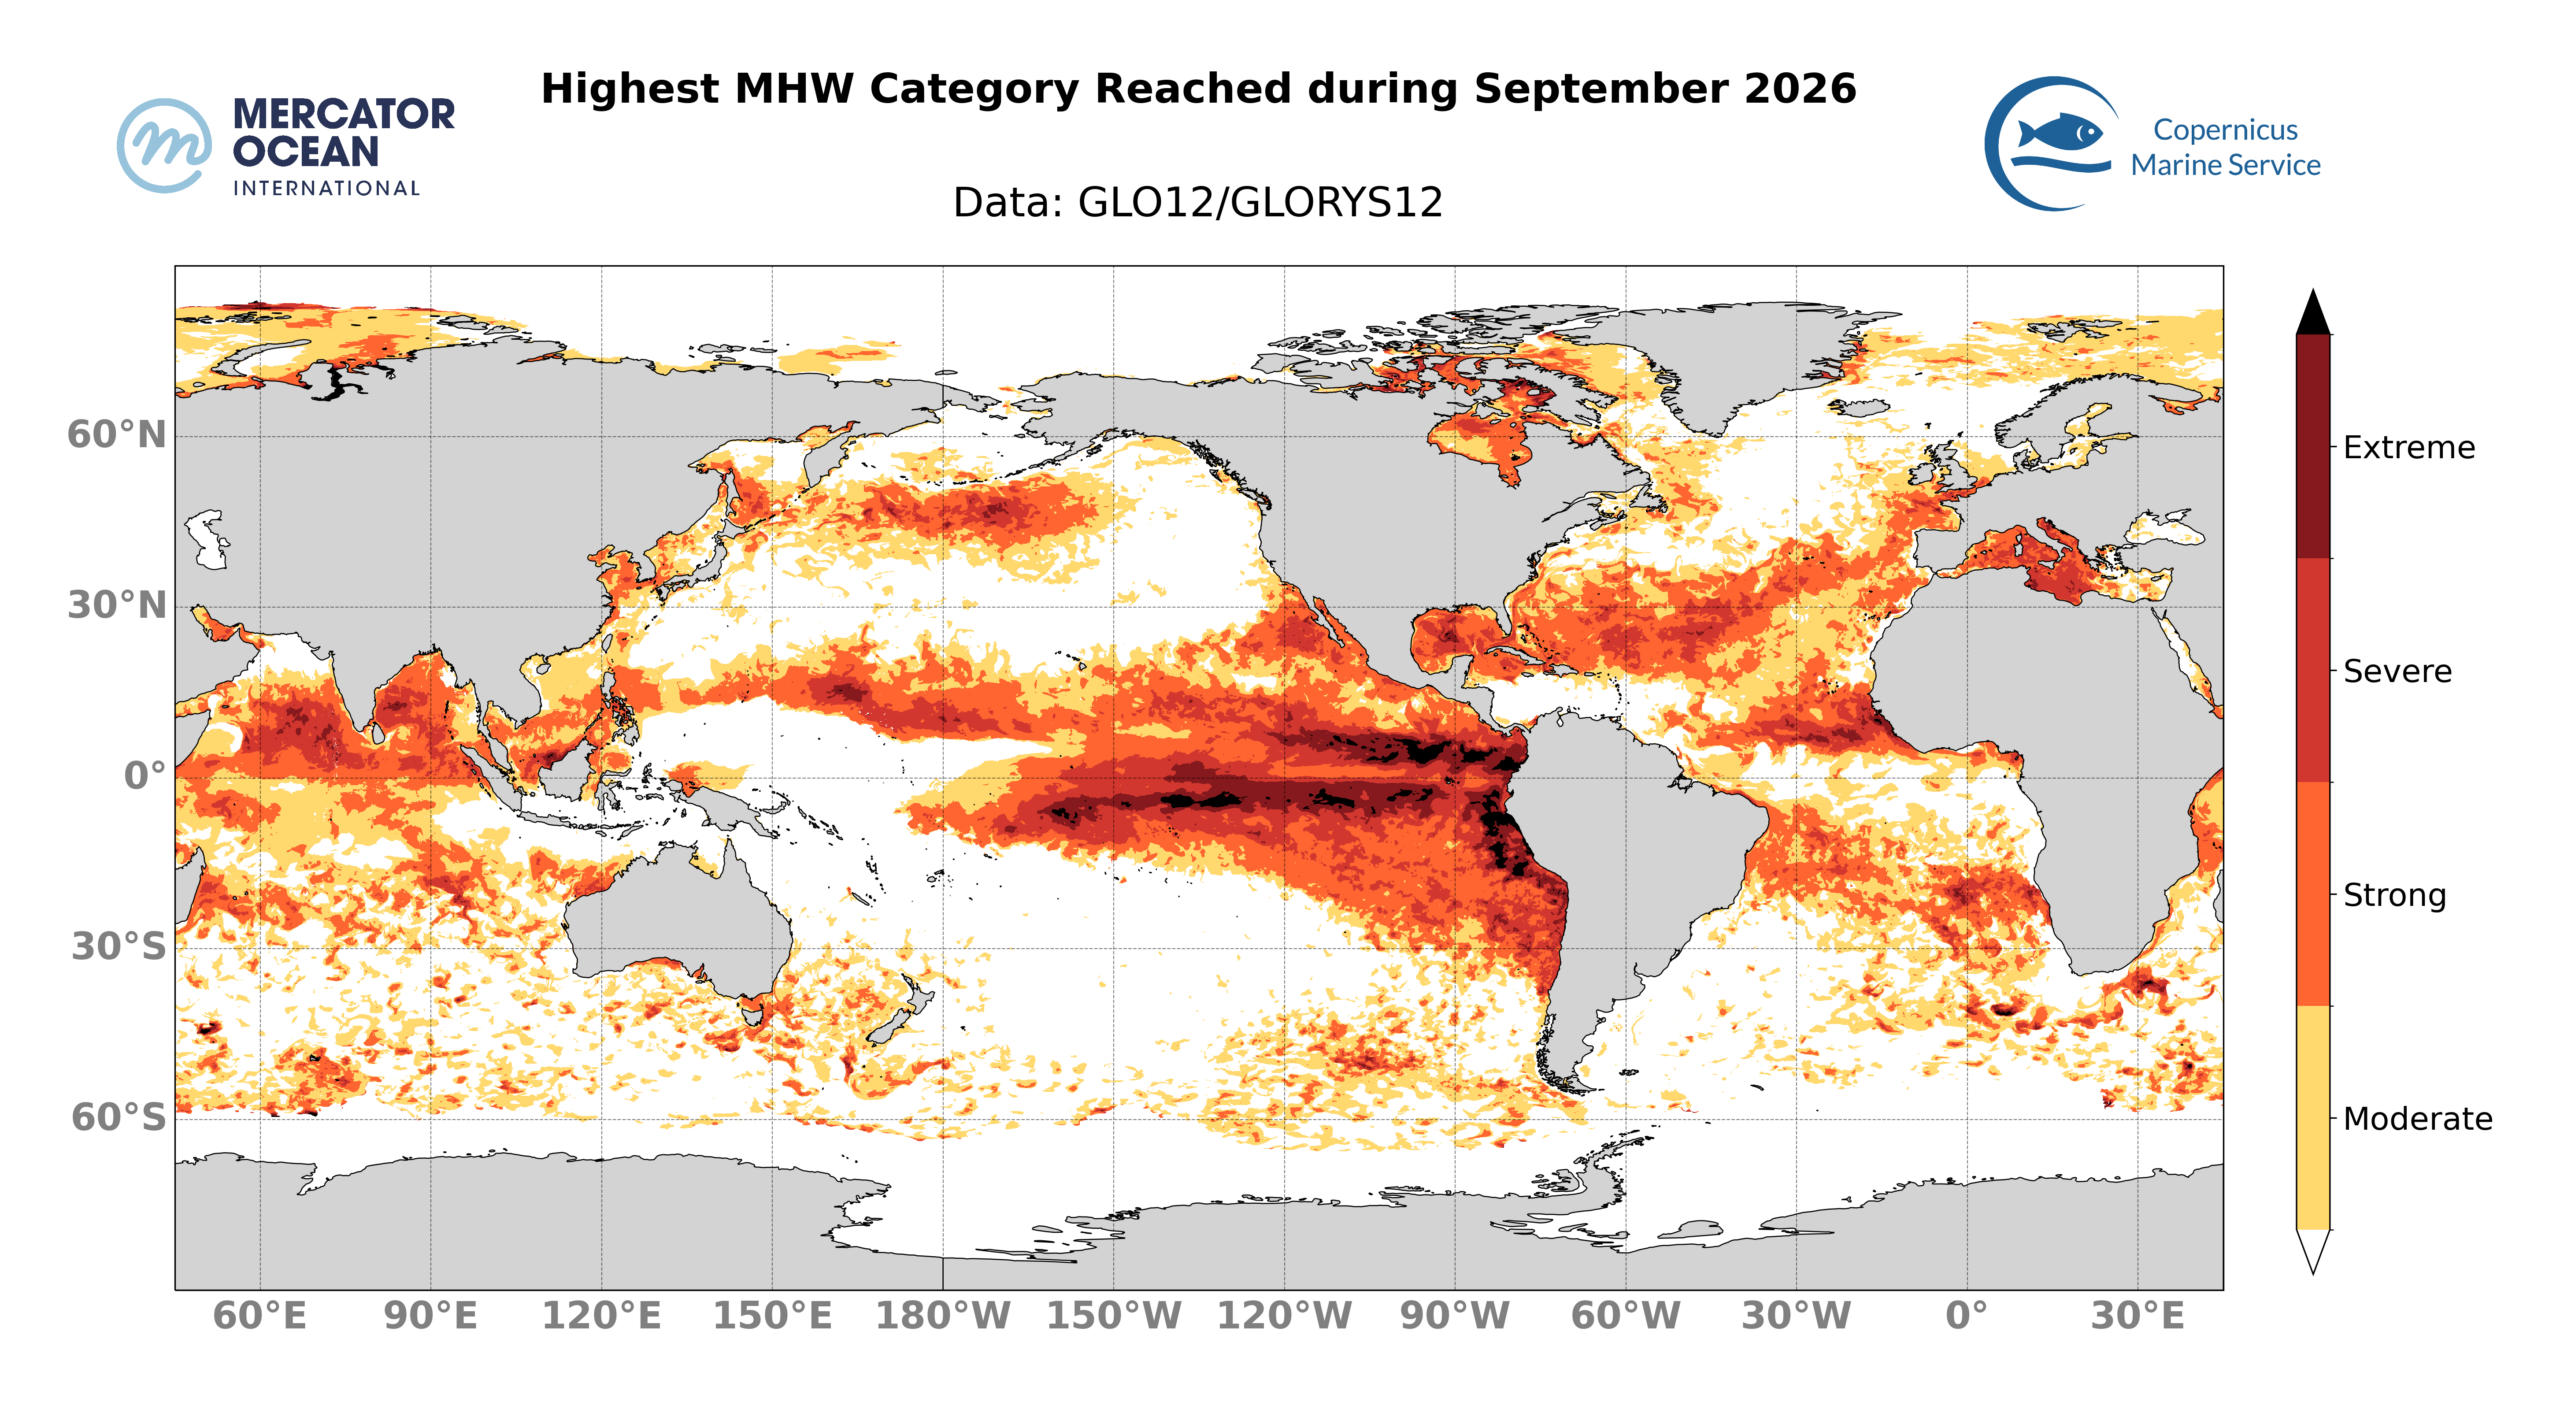
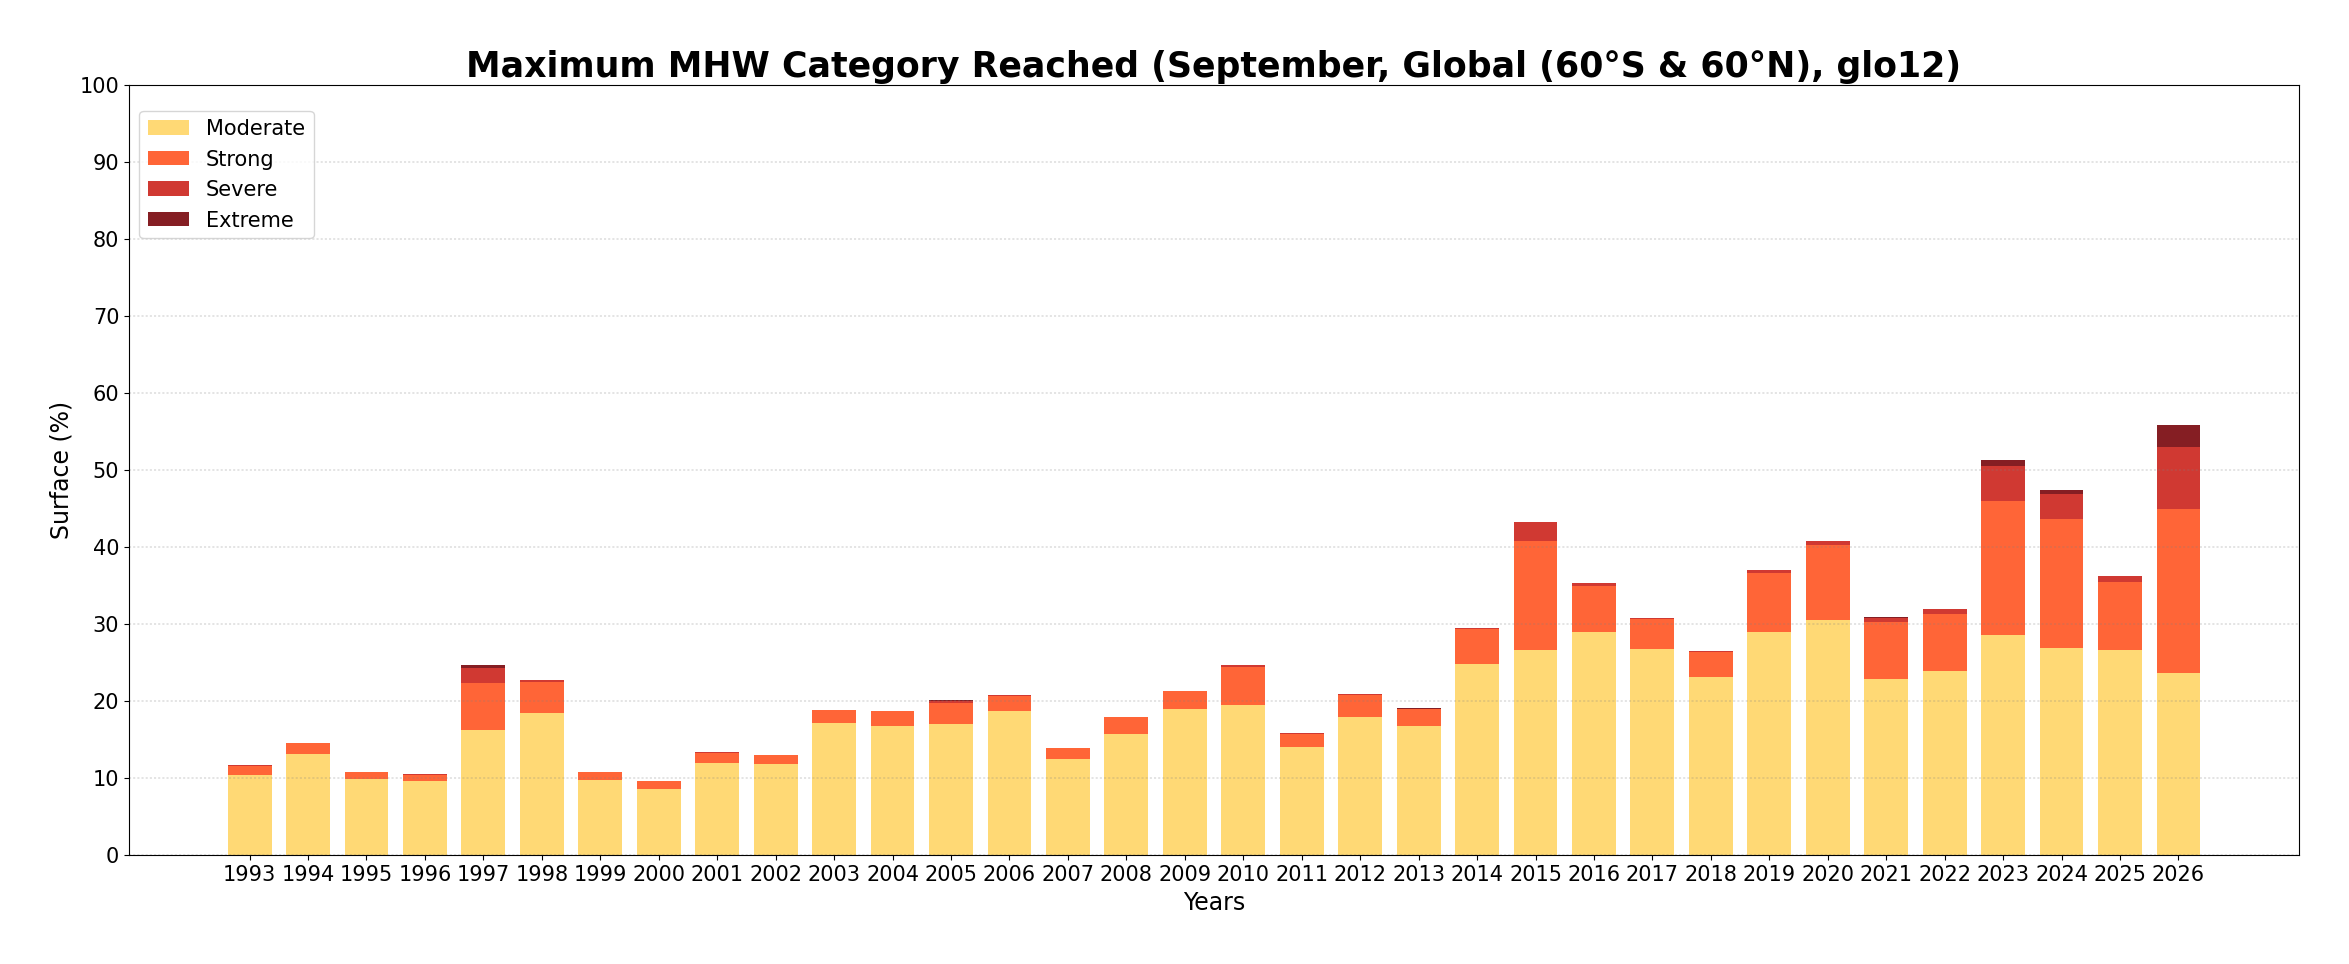
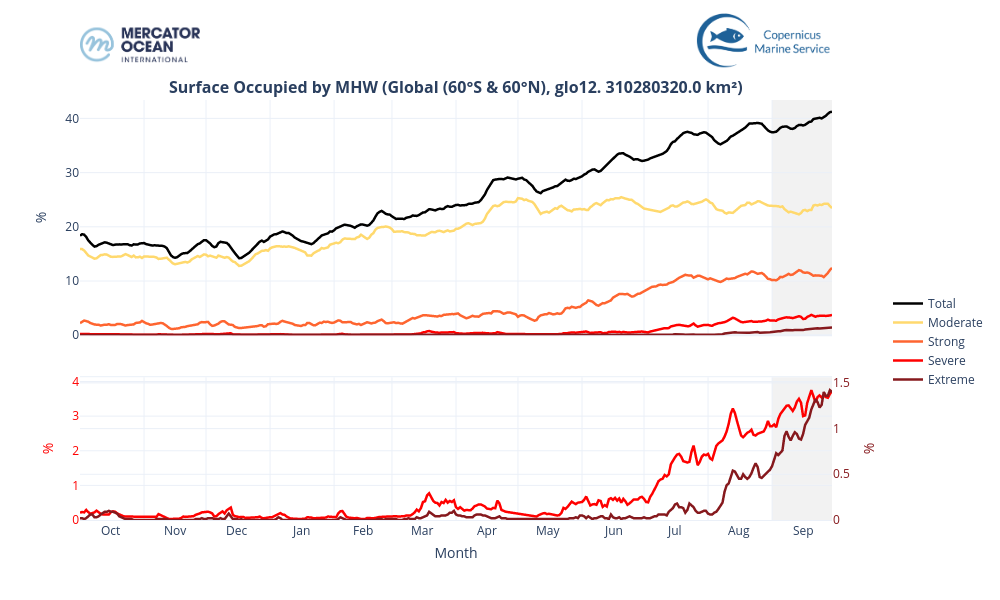
Top: Highest marine heatwave category reached in September 2026. Below: Maximum surface (%) occupied by MHW by each category (moderate, strong, severe and extreme) since 1993.


  • In September 2026, the total surface area of MHW (black line) increased from 37% and 41% of the global ocean (between 60°S and 60°N.
  • The majority of MHWs events were of moderate categories (between 22-24% of the global ocean) and strong category that reached around 10-12% of the global ocean.
  • Severe MHWs were between 2% and 4% of the global ocean during September 2026. For comparison, the total surface occupied by MHWs at the end of September 2025 was notably lower (~18% by the end of the month).  

Looking at the last 12 months, the total area of MHW has been growing regularly since December 2025.


Total Number Marine Heatwaves

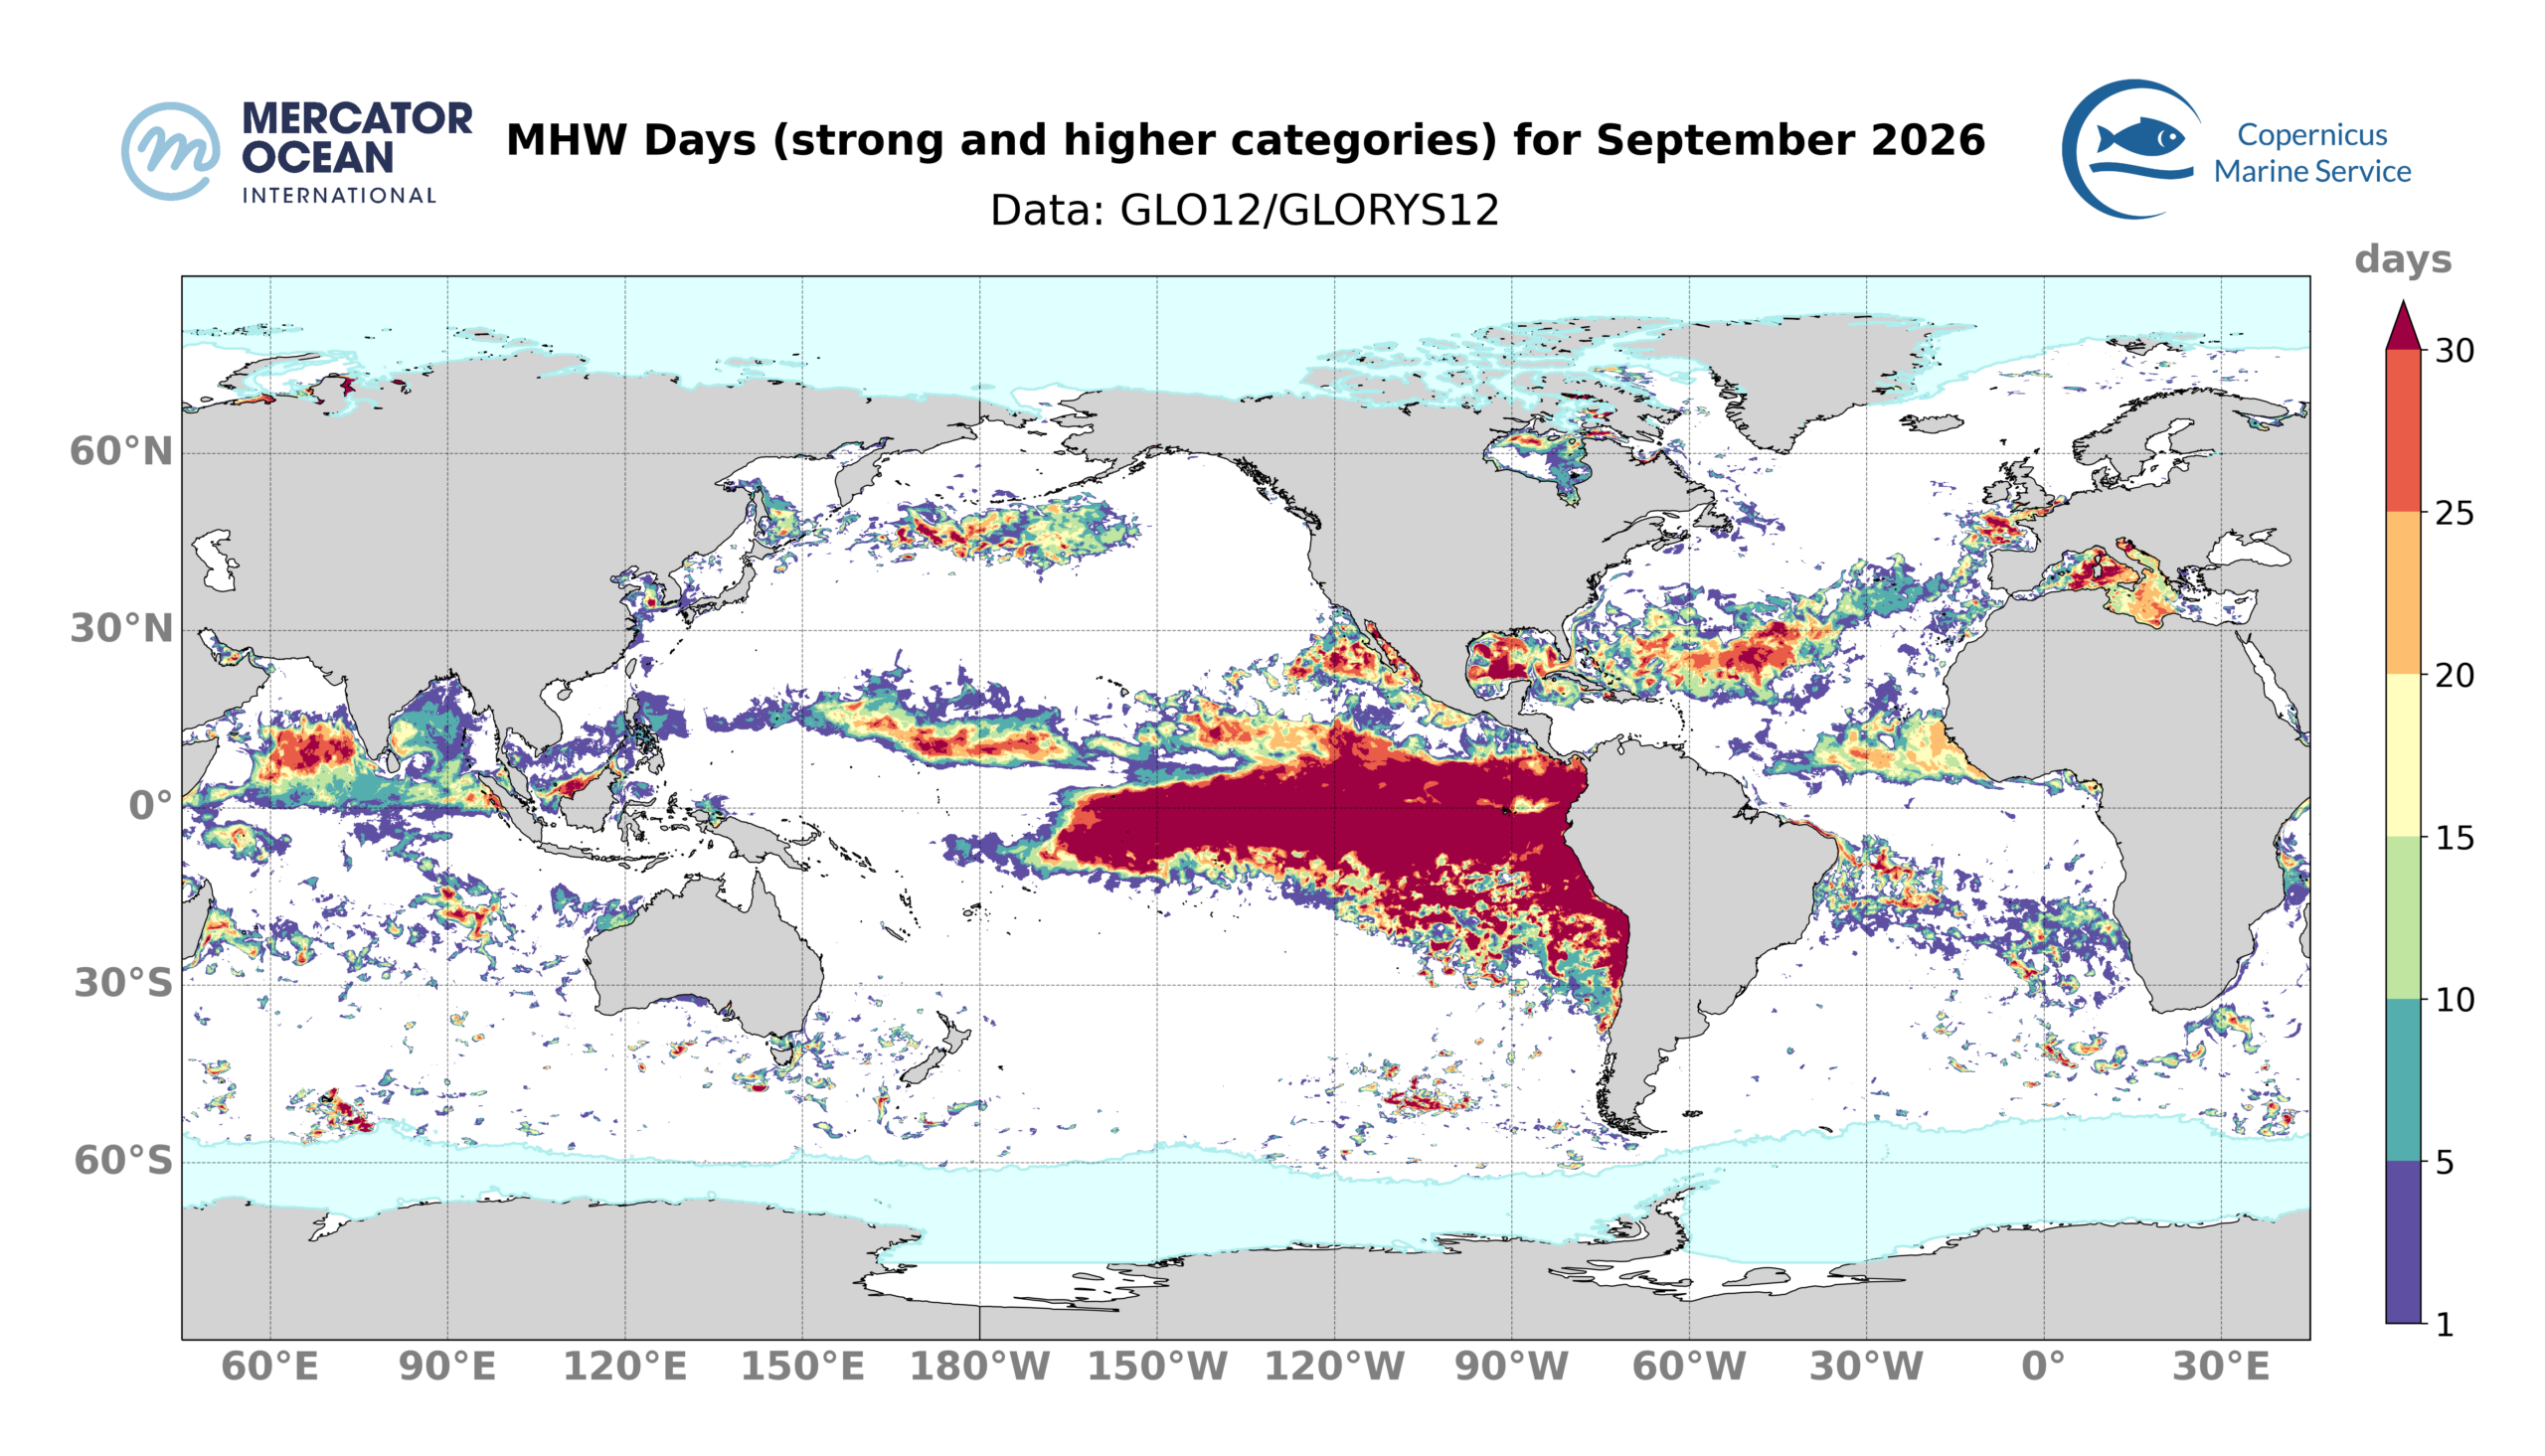
September 2026 MHW days of strong and higher category. Number of days during which a MHW of category strong, severe or extreme occurred in September 2026. Blank areas mean that no MHW of strong or higher category happened during the month. Blue shaded areas in the polar regions represent the sea ice maximum from the climatological period (1993-2022). Monitoring SST extremes with the MHW categorization approach as used here is not best suited for such regions.


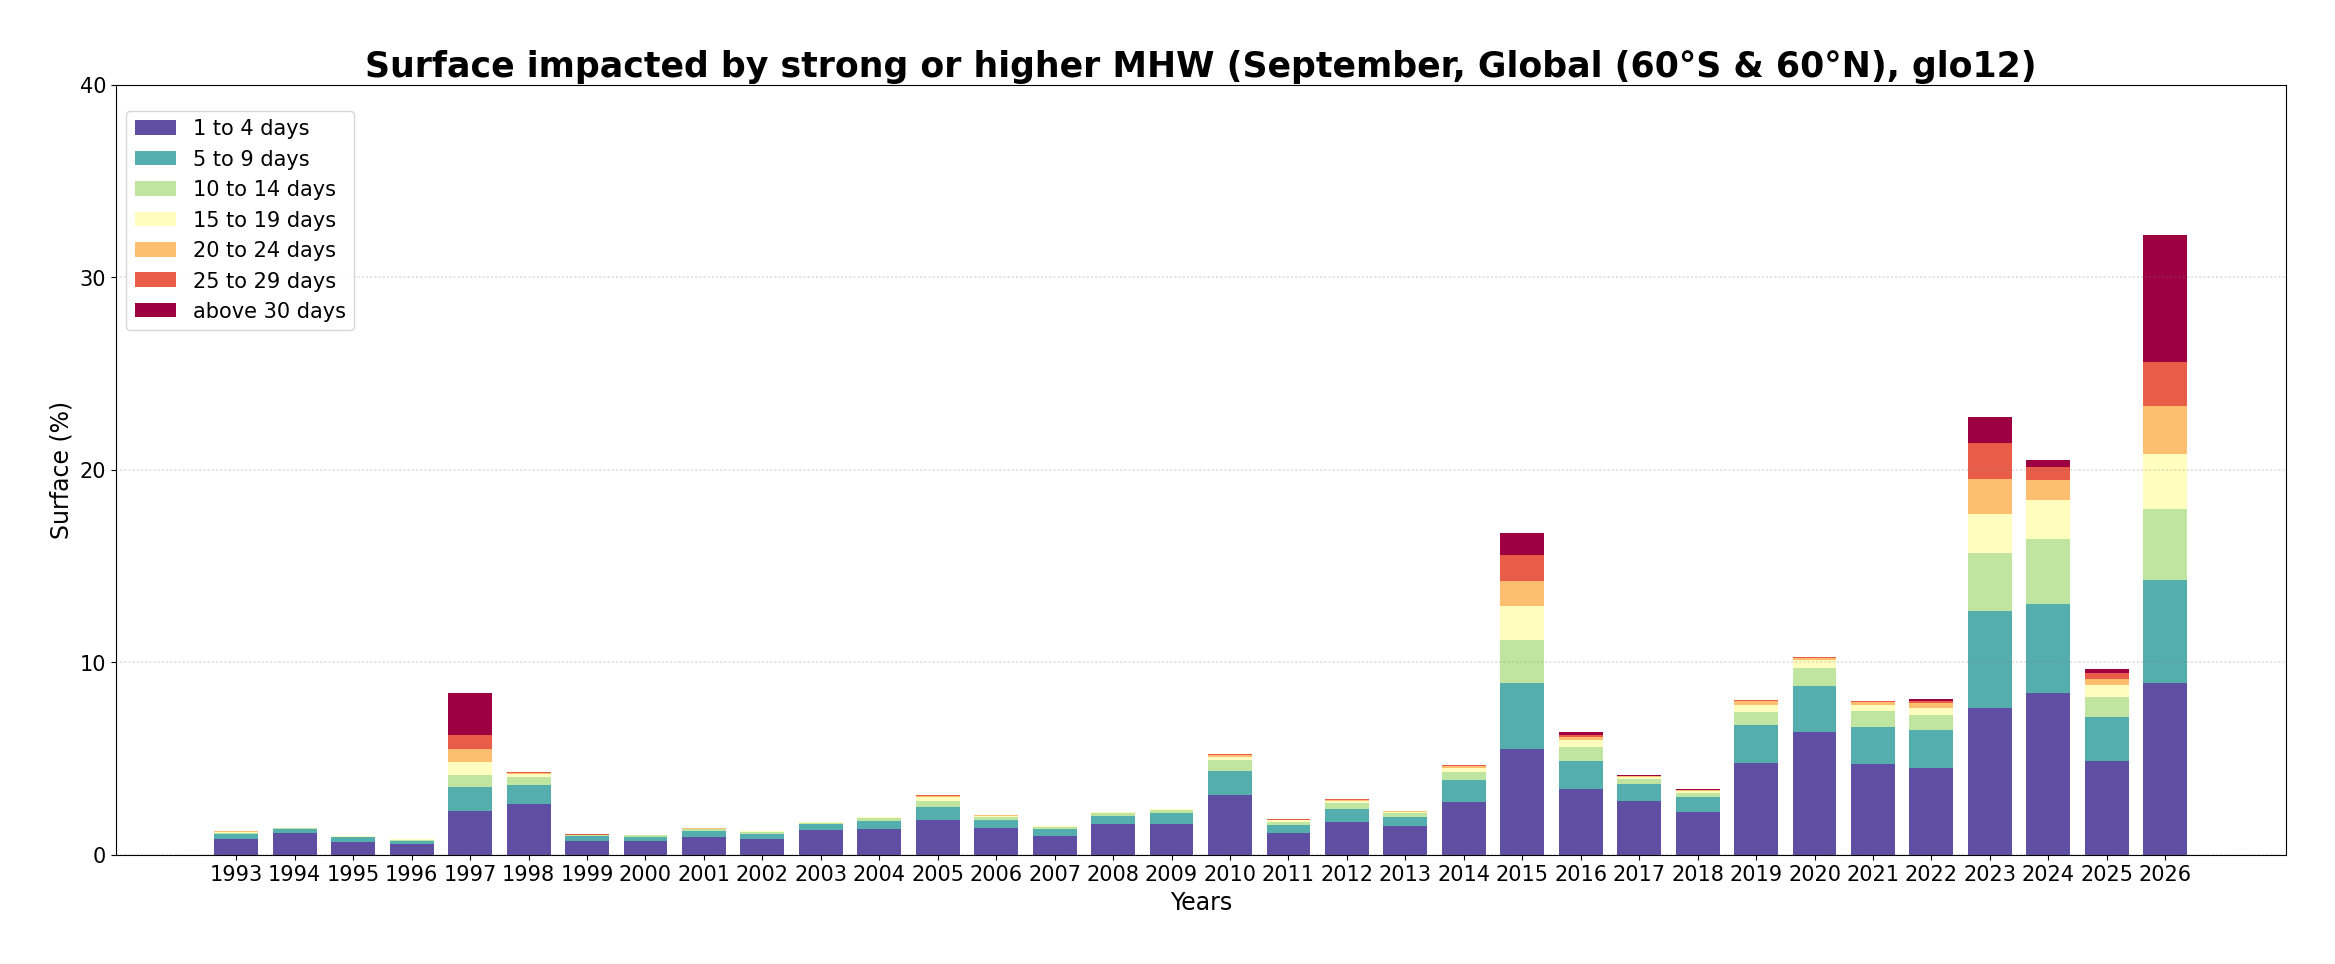
Year by year evolution of the surface impacted by strong and higher MHW during months of September. The size of the bar represents the proportion of the global ocean (between 60°S and 60°N) exposed to a strong or higher MHW during the month. As indicated by the colours, the proportion exposed to such MHWs is categorized according to the number of days impacted during the month.


  • 32% of the surface of the ocean was impacted by strong-or-higher MHW conditions for at least 1 day during September 2026. This is the 1st widest extent of the last 34 years, far exceeding the previous record set in 2023 (23 %). The central Pacific and the Southern Ocean, between 40°E and 80°E are the most affected, with areas where MHWs persisted the entire month (Figure 8). Nearly 7% of the surface of the ocean was impacted by strong-or-higher MHW conditions the entire month. This is mainly linked to the current El Niño event, with persistent MHW in the Equatorial Pacific. 
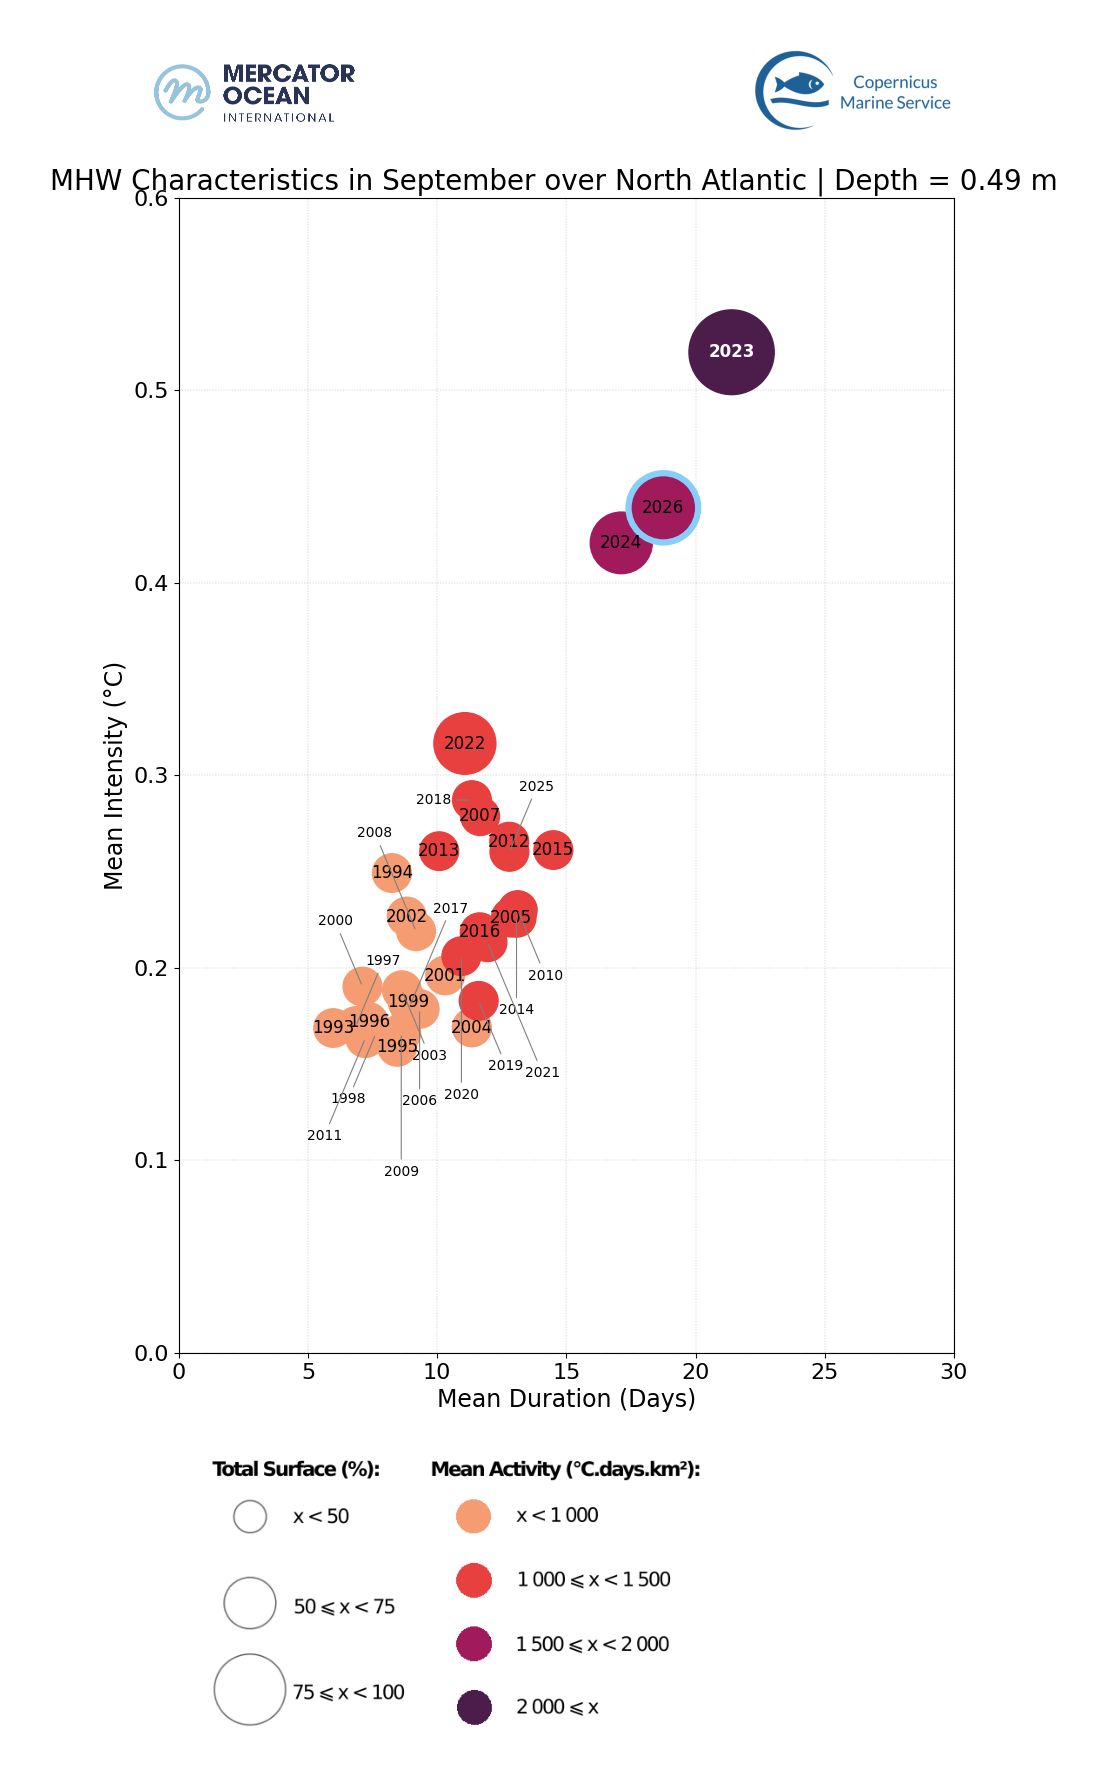
  • Regionally, more than 40% of the North Atlantic (between 0°N and 60°N) was impacted by strong, or higher, MHW conditions for at least 1 day. This corresponds to the 3rd largest extent of the last 34 years for a September month, behind 2024 (41%) and 2023 (55%). Western Europe and the band between 25°N and 35°N are the regions that have been affected by strong MHWs or higher for the longest period of time. 
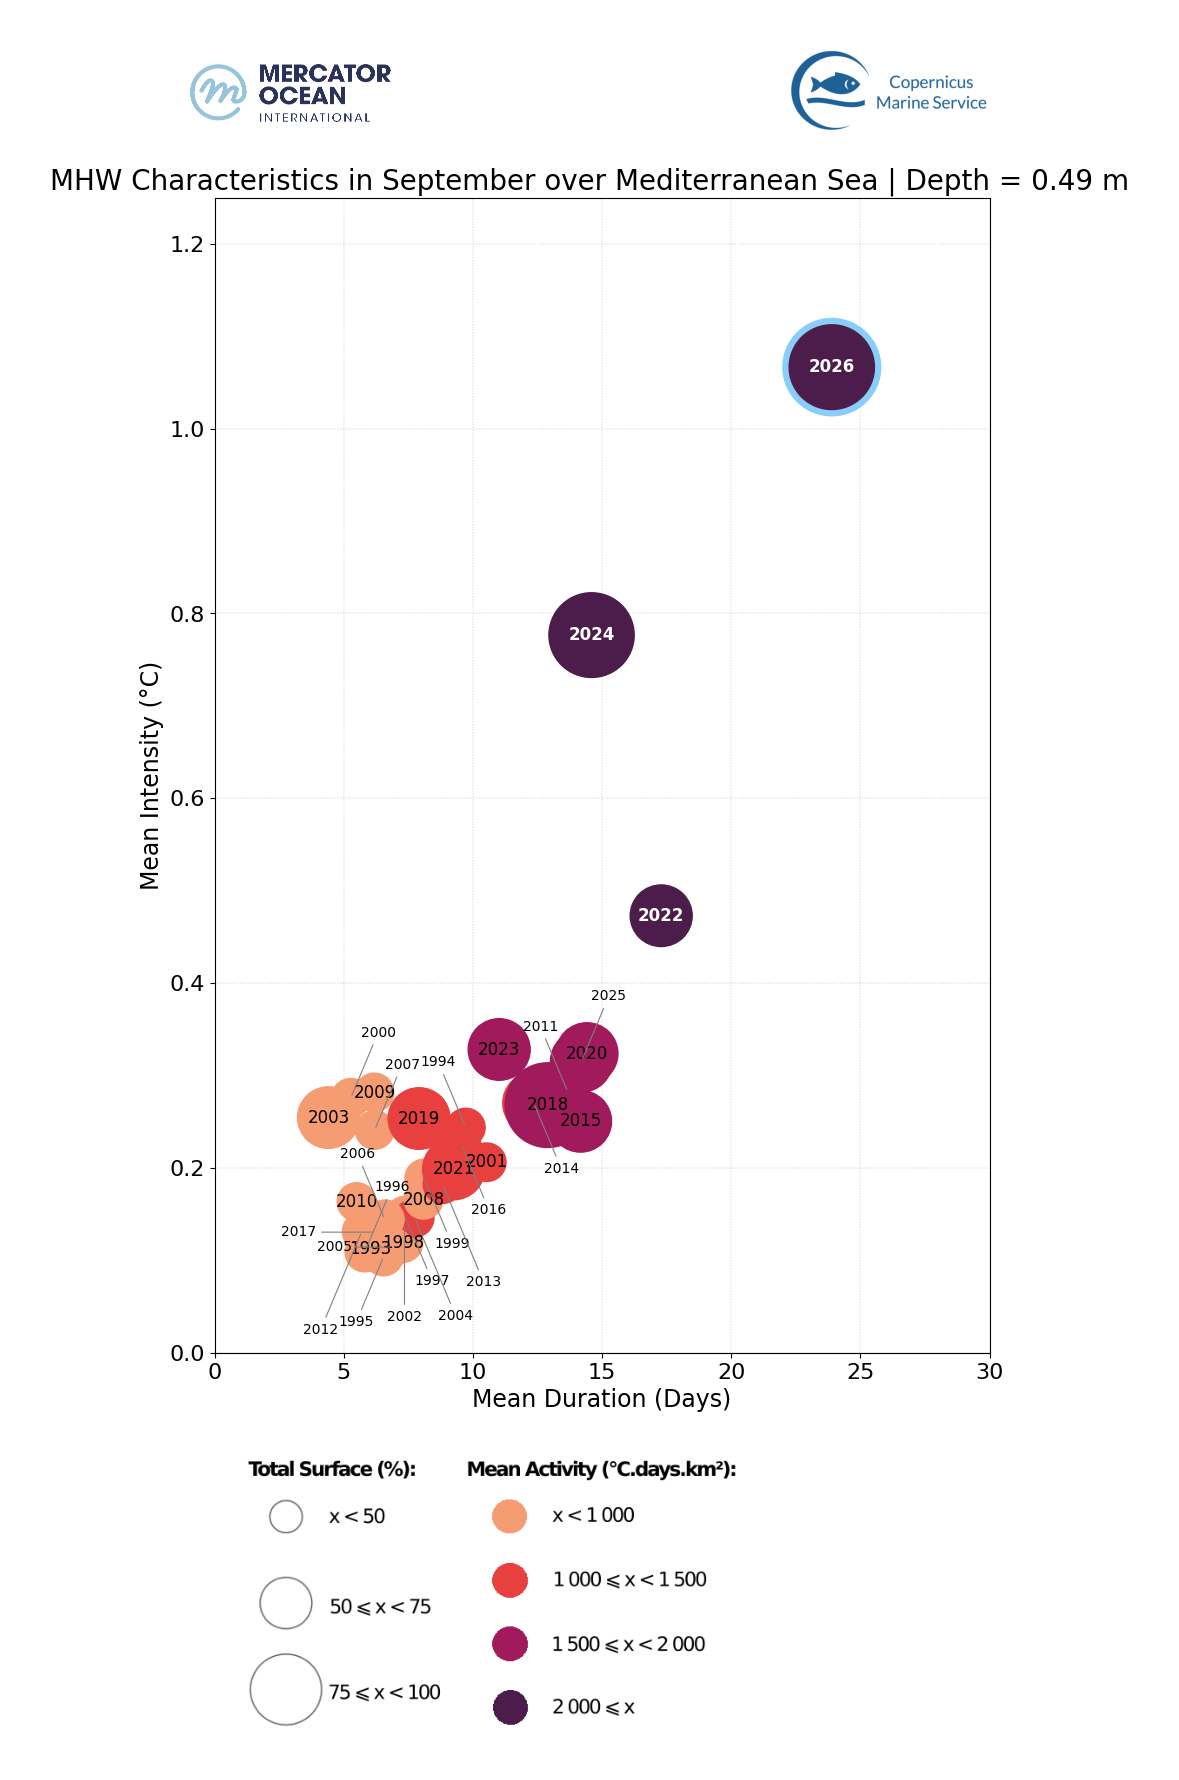
  • For the Mediterranean Sea, 68% of the basin was affected by strong-or-higher MHW conditions for at least 1 day, which is a record for the month of September, far ahead of September 2024 with 61% 
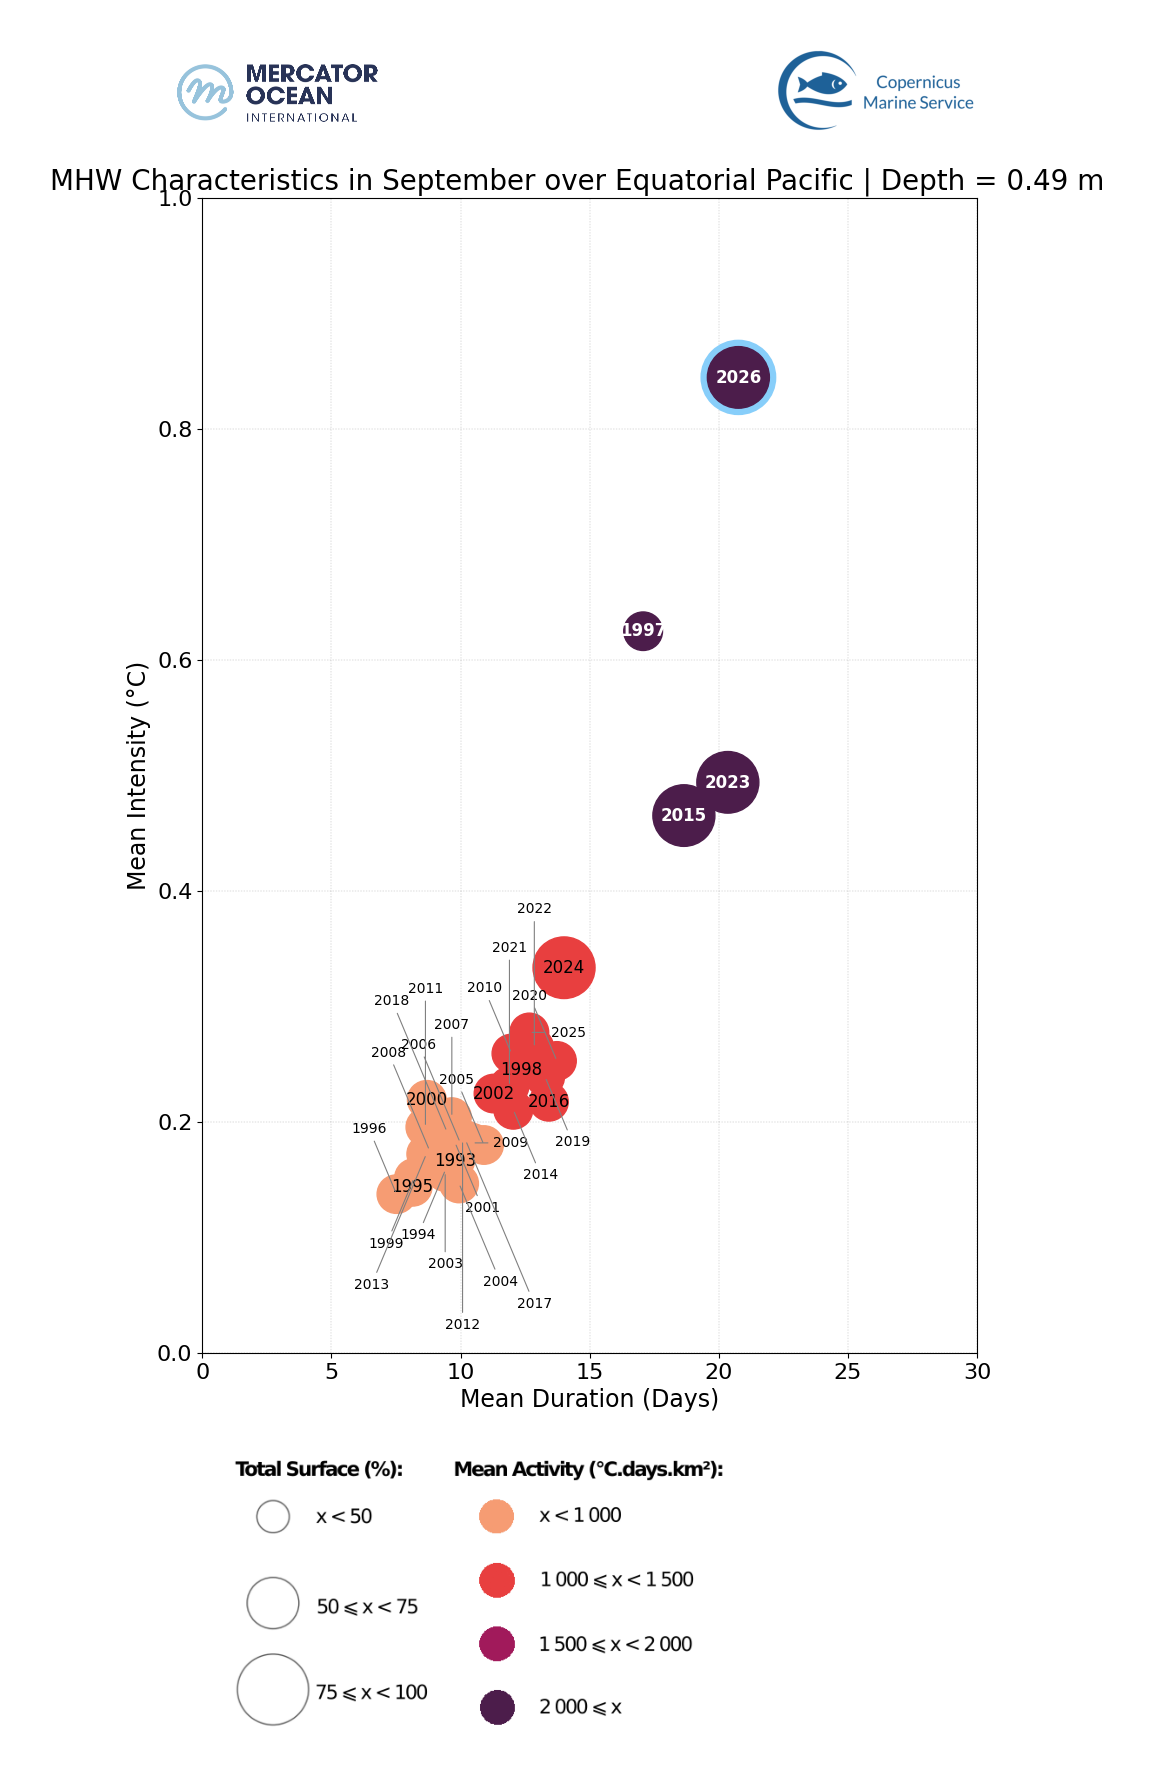
  • For the Equatorial Pacific, 46% of the region was affected by strong-or-higher MHW conditions for at least 1 day, which is the 1st widest extent, far ahead of 2015 (30%). 18% of the surface of the Equatorial Pacific Ocean was impacted by strong-or-higher MHW conditions the entire month. It is a record, well ahead of 1997 (6%), which was also a year with an intense El Niño event 

Statistics


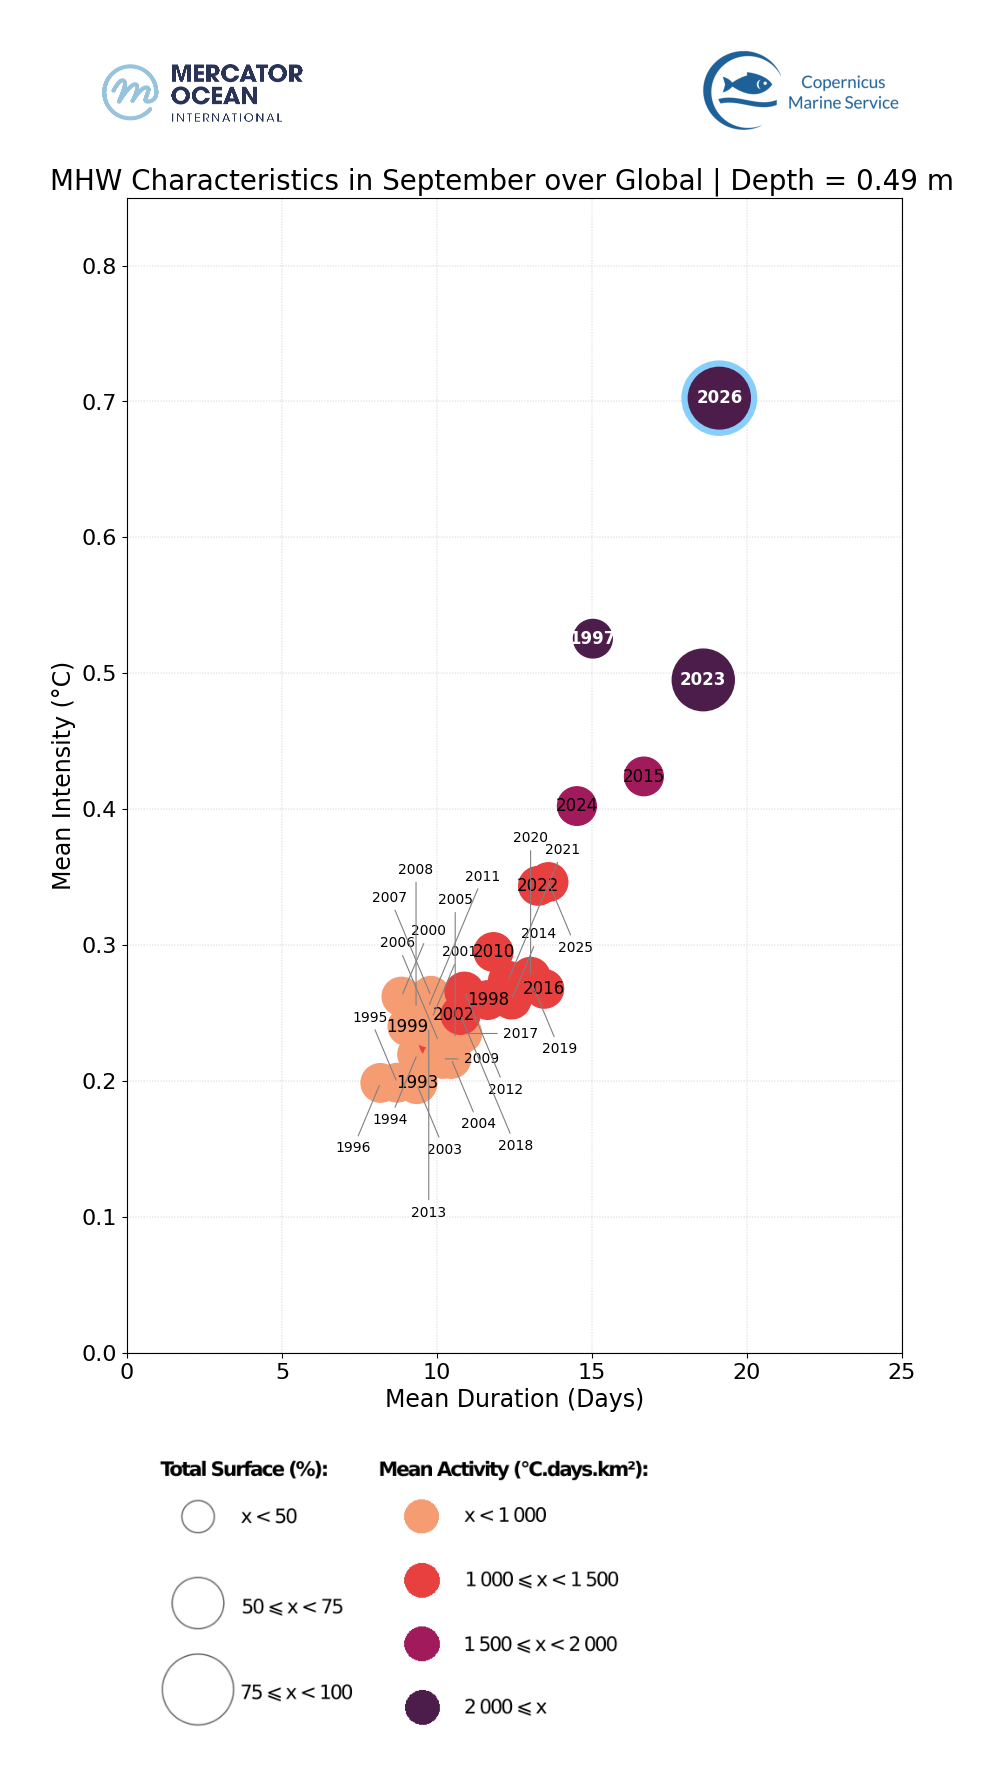
  • On a global scale, September 2026 was the most extreme September in terms of MHW, well ahead of 2023 and 1997. 
  • In the Mediterranean Sea, September 2026 was the most extreme September far ahead 2024. 
  • In the North Atlantic, September 2026 was the 2nd most extreme September month in terms of MHW from the last 34 years, behind 2023. 
  • In the Equatorial Pacific, September 2026 was the most extreme September in terms of MHW intensity, far ahead 1993 and 2023. It was also the most extreme September in terms of MHW duration, but close to September 2023.  This highlights the extreme nature of the current El Niño event 

About the Bulletin

Mercator Ocean International publishes a monthly sea surface temperature bulletin reporting on mean temperature and marine heatwave conditions for the month just passed. It includes:

  • Regions where MHWs are present and the time these events started,
  • Timeseries showing the total surface occupied by MHWs globally and for the European region,
  • The total number of days of exposure to MHW during the month (including only strong and higher intensity categories).

Data sets and products

Sea Surface Temperature

The results are obtained using the Copernicus Marine Service global analysis and forecasting system together with observation-based products.

  • GLOBAL_ANALYSISFORECAST_PHY_001_024 Global Ocean Physics Analysis and Forecast sea surface temperature. U. Copernicus Marine Service Information (CMEMS). Marine Data Store (MDS). DOI: https://doi.org/10.48670/moi-00016
  • ESA SST CCI reprocessed sea surface temperature analyses. E.U. Copernicus Marine Service Information (CMEMS). Marine Data Store (MDS). DOI: https://doi.org/10.48670/moi-00169
  • NOAA OI SST V2 High Resolution Dataset data provided by the NOAA PSL, Boulder, Colorado, USA, from their website at https://psl.noaa.gov, Huang, B., C. Liu, V. Banzon, E. Freeman, G. Graham, B. Hankins, T. Smith, and H.-M. Zhang, 2021: Improvements of the Daily Optimum Interpolation Sea Surface Temperature (DOISST) Version 2.1, Journal of Climate, 34, 2923-2939. doi: 10.1175/JCLI-D-20-0166.1
  • Global Ocean OSTIA Sea Surface Temperature and Sea Ice Analysis. E.U. Copernicus Marine Service Information (CMEMS). Marine Data Store (MDS). DOI: https://doi.org/10.48670/moi-00165
  • ODYSSEA Global Sea Surface Temperature Gridded Level 4 Daily Multi-Sensor Observations. E.U. Copernicus Marine Service Information (CMEMS). Marine Data Store (MDS). DOI: https://doi.org/10.48670/moi-00016

Notes: The global analysis system was used to study the ocean surface temperature from 2021 and 2025. To study surface temperature for previous years (1991 to 2020), it was used the ESA CCI data. The other observation-based sea surface temperature products (OSTIA, OI SST and Odyssea) were used for calculating monthly mean and uncertainty values for August 2026.

 Marine Heatwaves

The results are obtained using the Copernicus Marine Service global systems including the analysis and forecasting system together with the reanalysis product.

  • GLOBAL_ANALYSISFORECAST_PHY_001_024 Global Ocean Physics Analysis and Forecast sea surface temperature. U. Copernicus Marine Service Information (CMEMS). Marine Data Store (MDS). DOI: https://doi.org/10.48670/moi-00016
  • GLOBAL_MULTIYEAR_PHY_001_030 Global Ocean Physics Reanalysis sea surface temperature. U. Copernicus Marine Service Information (CMEMS). Marine Data Store (MDS). DOI: https://doi.org/10.48670/moi-00021

Notes: The global analysis system was used to study MHWs for 2024 and 2025. To study MHWs for previous August months (1993 to 2025), it was used the reanalysis system. The reanalysis product was used for generating a daily climatology using the 30-year period from 1993 to 2022