Ocean Temperature Bulletin
Summer 2026

Mercator Ocean International (MOi) oceanographers examine marine heatwaves across the global ocean. They analyse a variety of datasets from observation analyses
(satellite sea surface temperature maps) to model analyses
(assimilating satellite and in situ observations) and model forecasts.¹

All images in this article can be used freely and should be credited with the following information :
Image source: European Union, Copernicus Marine Service Data 2025 © Mercator Ocean .

Key takeaway

  • The global ocean experienced its warmest summer in 2026, with a mean SST of 21.01 ± 0.09°C, surpassing the previous record set in 2023 (20.93 ± 0.06°C).
  • Daily MHW extent has been increasing during 2026 summer.
  • Most of the Mediterranean Sea has experienced above average SST for 2026 summer, with a mean SST reaching 50 ± 0.30°C, which is the 1st warmest summer, ahead of 2024 (26.10 ± 0.25°C).
  • 95% of the Mediterranean Sea was affected by strong or higher Marine Heatwaves (MHWs), the 3rd widest extent after 2023 (97%) and 2024 (98%)
  • SSTs were above average for 85% of the Equatorial Pacific. 34% of the region has experienced its 1st warmest  summer in 2026, with 53% ranking in the top 4.
  • In the Equatorial Pacific, 2026 summer MHW extent exceeded those in 2016, which was the largest extent for this period
  • 60% of the Equatorial Pacific was affected by strong or higher Marine heatwaves (MHWs), the first widest extent, surpassing 2015 previous record (33%).

sea Surface Temperature

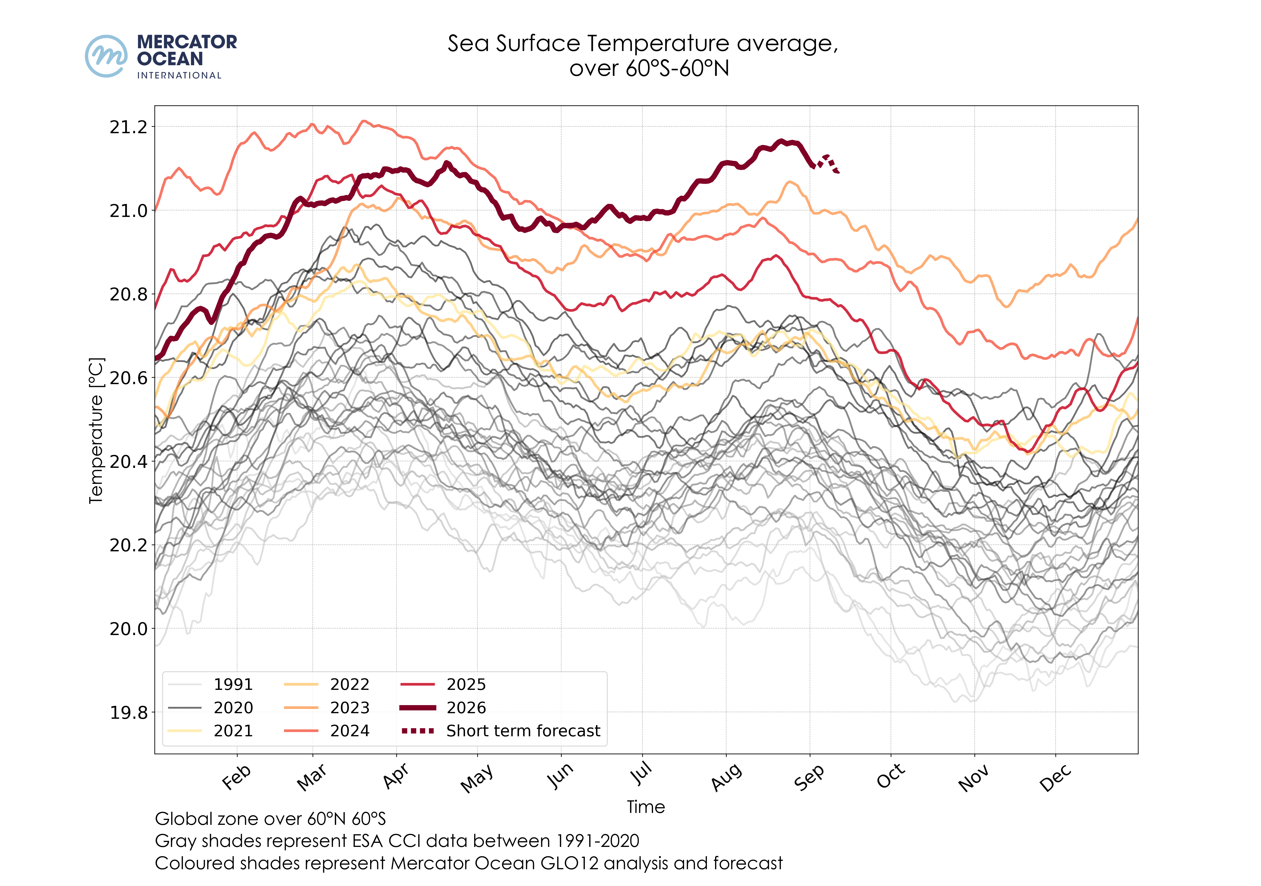
Daily sea surface temperatures averaged for the global ocean between 1991-2020 using ESA’s Climate Change Initiative (gray shades), and between 2021-2026 (colored shades) using Mercator Ocean International’s GLO12 analysis. Credit: European Union, Copernicus Marine Service/Mercator Ocean International
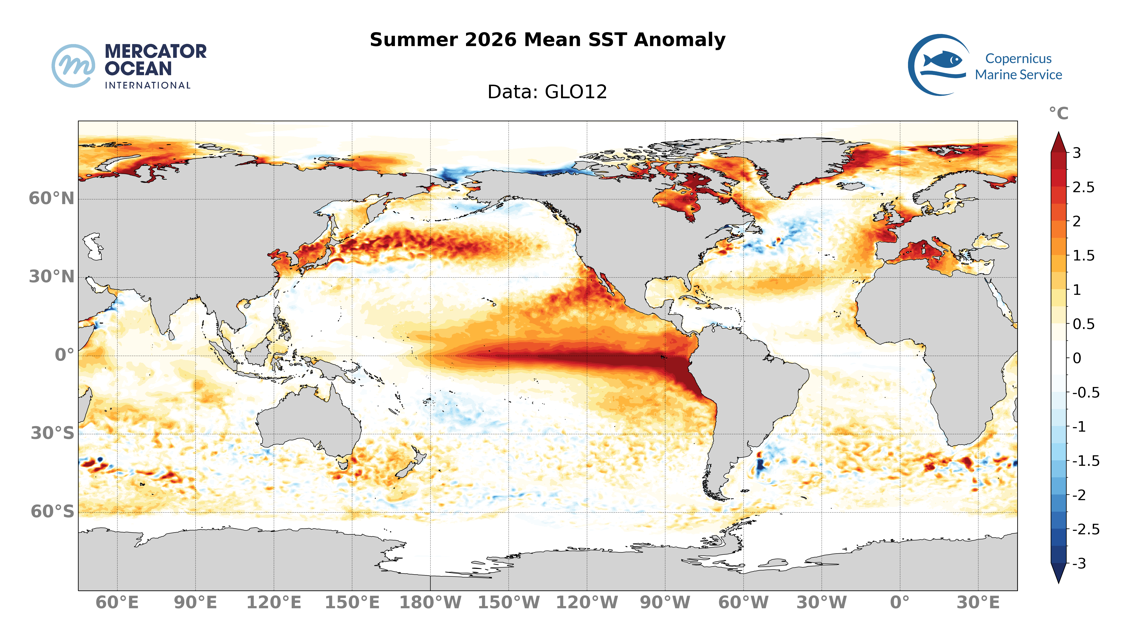
 

June to August 2026 Mean SST Anomaly relative to a 30-year climatology (1993-2022), calculated using daily data from Mercator Ocean International’s GLO12 analysis for 2026 and from GLORYS12 reanalysis for the climatological mean. Credit: European Union, Copernicus Marine Service/Mercator Ocean International


The summer of 2026, from June to August, was the warmest summer on record with a mean SST of 21.01 ± 0.09°C, surpassing the previous record set in 2023 (20.93 ± 0.06°C). This summer has been characterised by a particularly strong El Niño event, resulting in high sea surface temperatures (SSTs) in the central and eastern equatorial Pacific. For this period, mean SSTs were above average for 82% of the global ocean (between 60°S and 60°N) (figure 2), with 22% above average by at least 1°C.
  • The European region shows strong SSTs reaching more than 2 or 3°C above the long-term average (from 1993 to 2022), particularly in the western part of the Mediterranean Sea and in Western Europe
  • The Pacific Ocean shows high SSTs at midlatitude in both hemispheres, with large regions with SSTs reaching more than 3°C above average, particularly in the eastern and central equatorial Pacific and in the North Pacific (between the Sea of Japan and 150° W).


Highest summer mean SST for Europe and the Equatorial Pacific


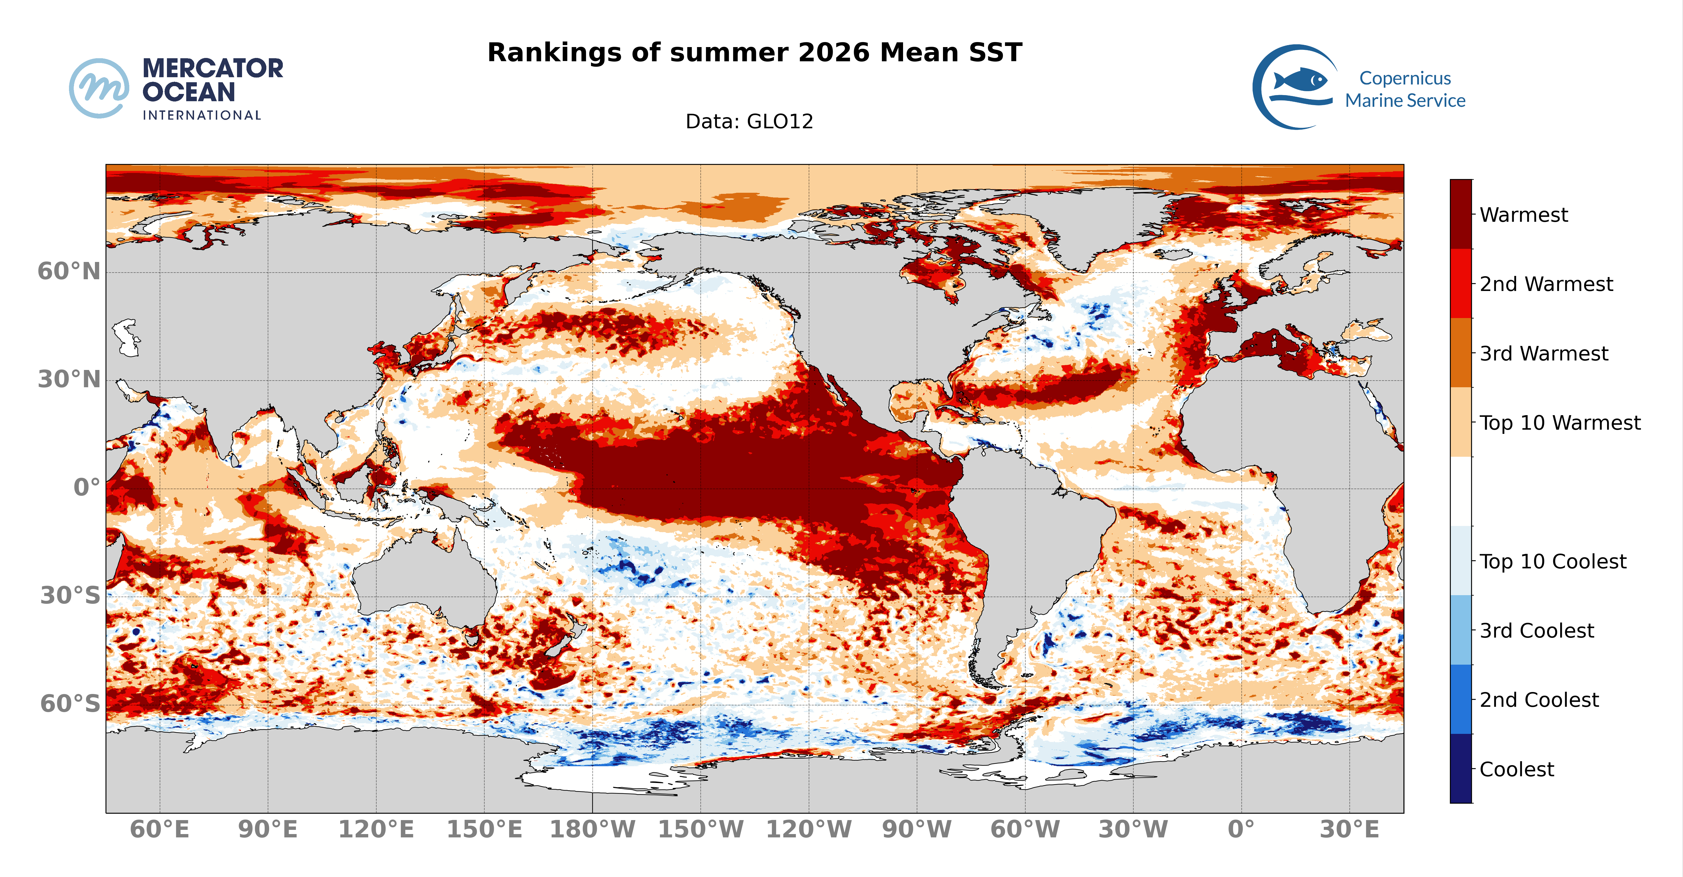
Rankings of 2026 summer mean SST since 1993 using daily data from Mercator Ocean International’s GLO12 analysis from 2021 to 2026 and from GLORYS12 reanalysis from 1993 to 2020. Blank areas mean that 2026 mean SST doesn’t rank in the 4 warmest or 4 coolest mean SST since 1993. Credit: European Union, Copernicus Marine Service/Mercator Ocean International
 

  • The summer of 2026 was the warmest since 1993 for 17% of the global ocean with the Equatorial and North Pacific, the Subtropical North Atlantic and the Europe most affected (figure 3). More generally, the summer of 2026 was ranked among the warmest 4 years for 37% of the global ocean (between 60°S and 60°N). In contrast, less than 2% of the global ocean ranked among the 4 coldest years.

Ongoing Marine Heatwaves

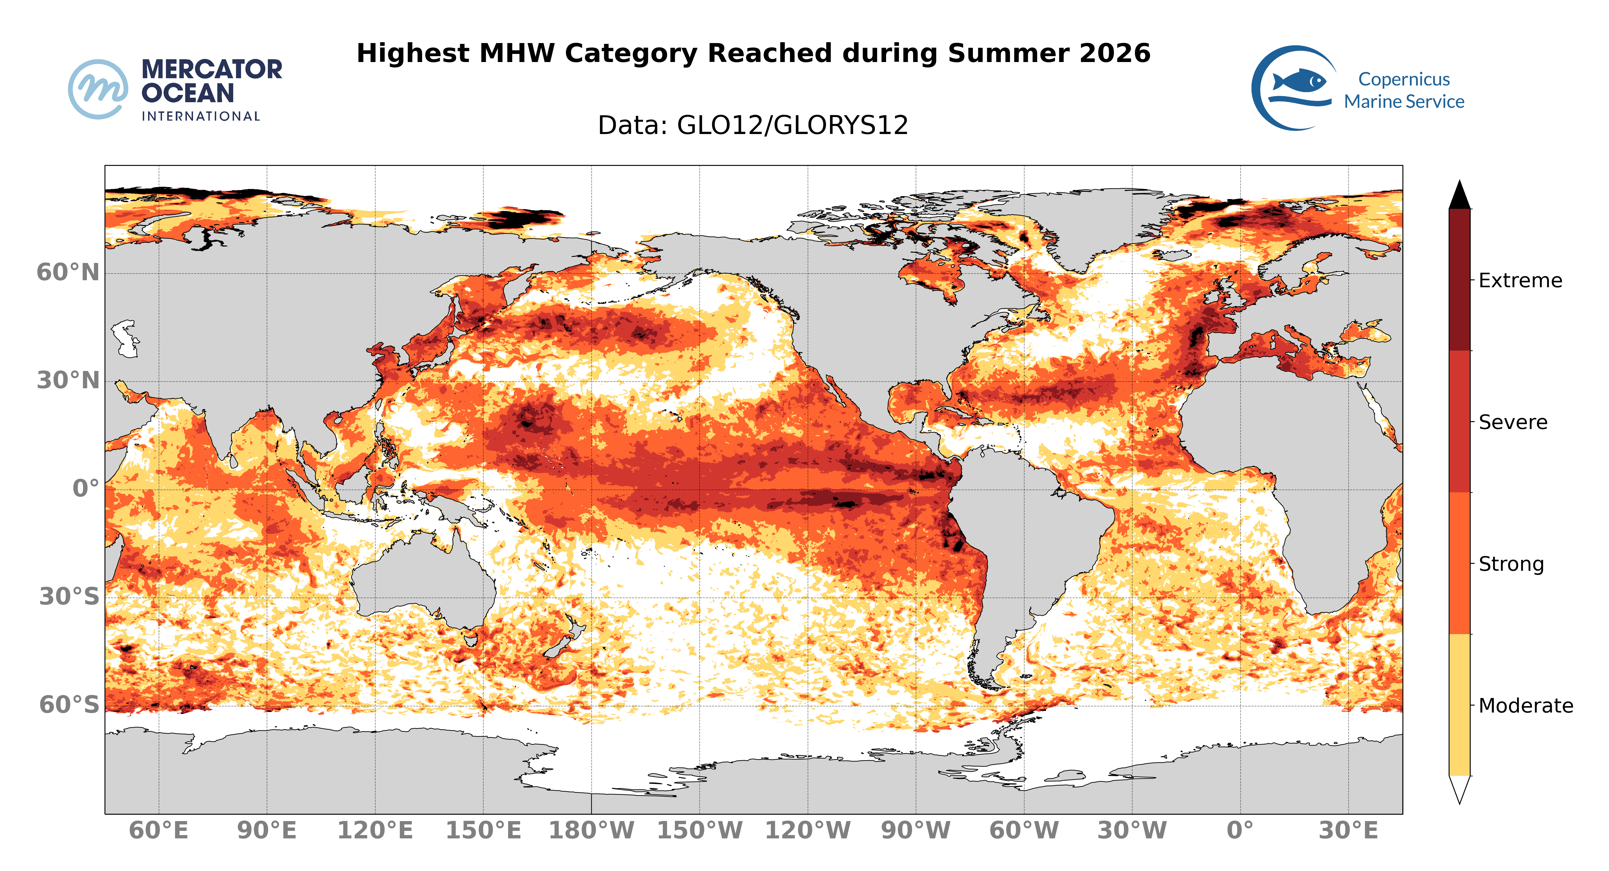
Highest marine heatwave categories reached during summer 2026


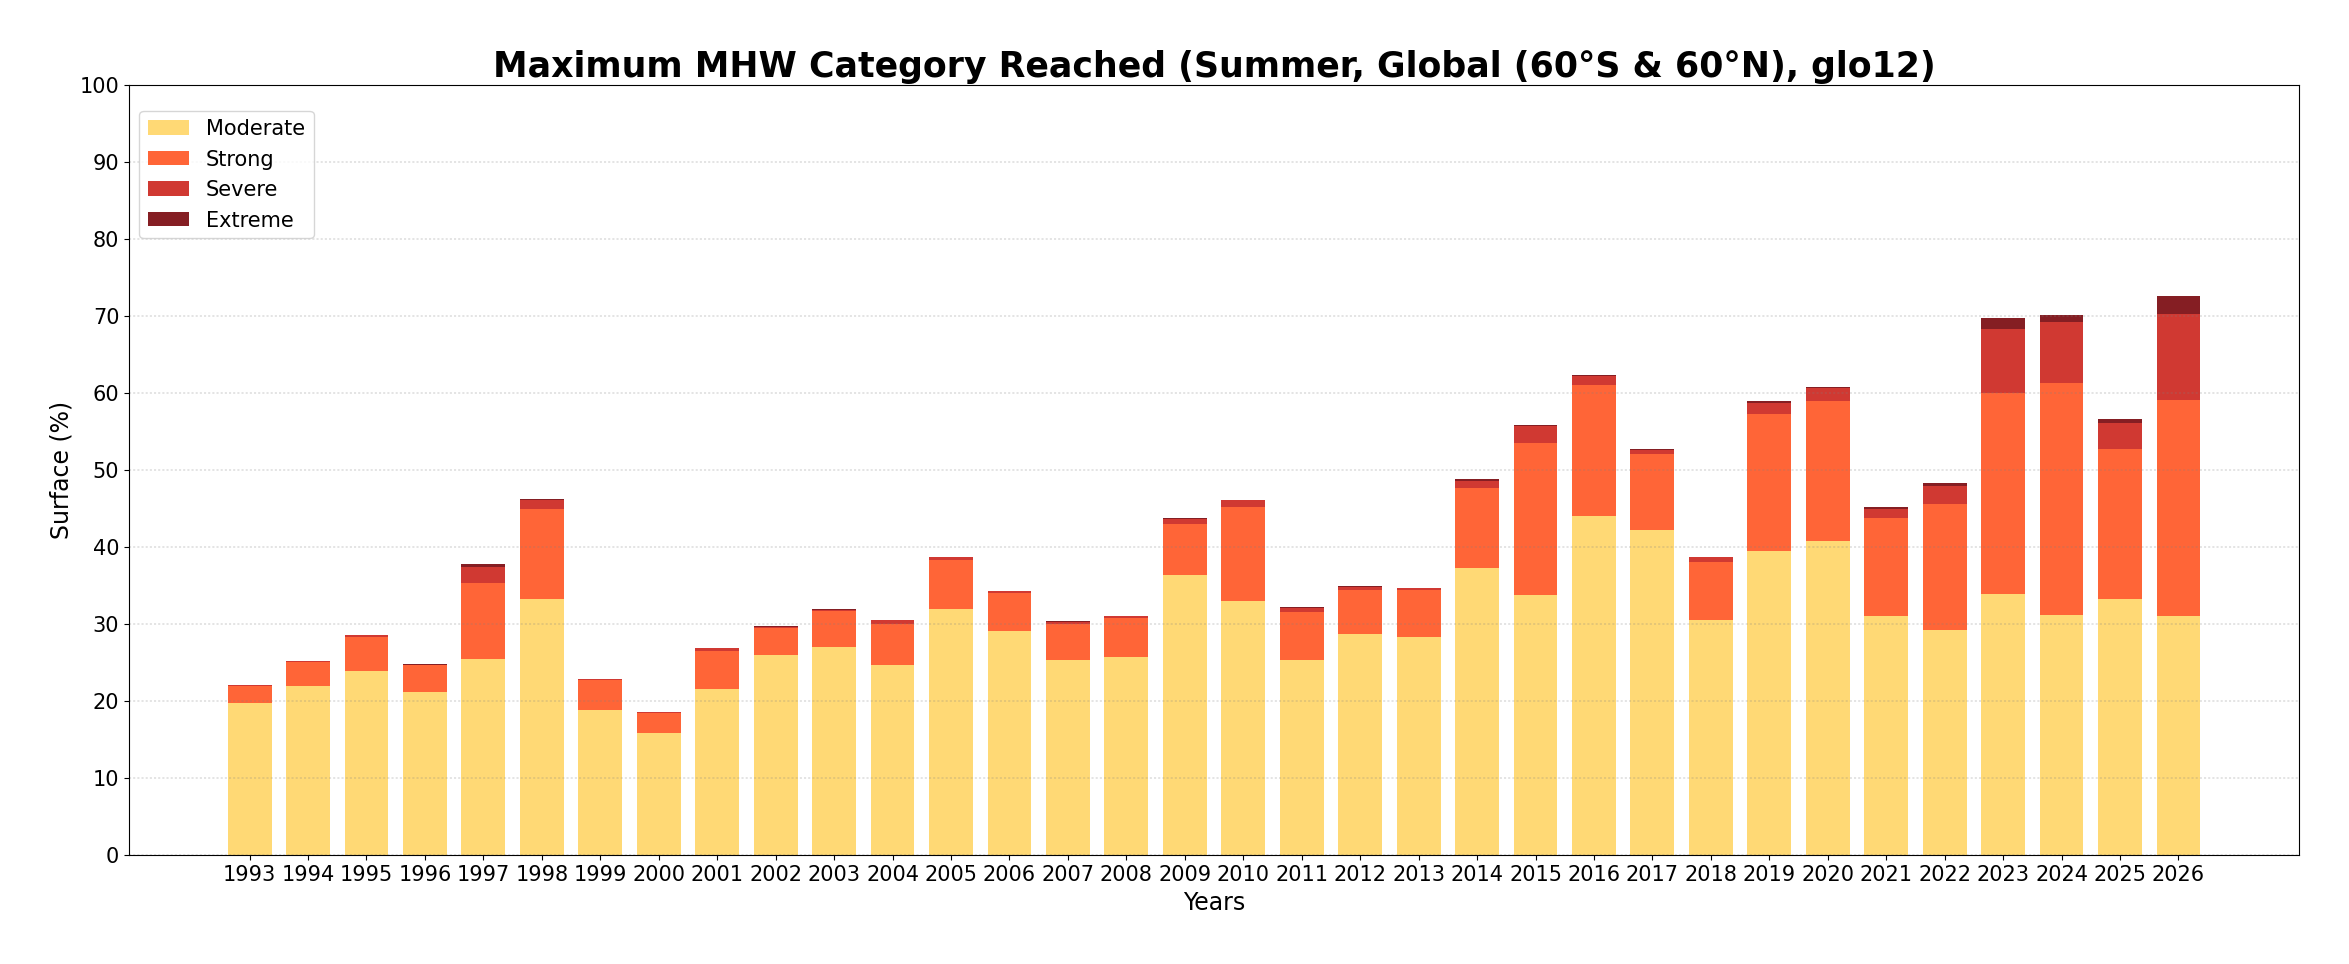
Top: Highest marine heatwave category detected in the global ocean (60°S-60°N) between June and August 2026. Blank areas mean that no marine heatwave occured in these reagions during this period. Bottom: Evolution of the extent of the highest MHW category. For each year, the length of the bar represents the percentage of the region impacted by MHW, while the colors indicate the proportion of the highest categories reached within that region. The horizontal dotted line represents the average surface of the region impacted by MHW during the summer between 1993 and 2026 in the global ocean. Credit: European Union, Copernicus Marine Service/Mercator Ocean International
  • 73% of the global ocean was affected by MHW during the summer of 2026. It is the 1st largest extent impacted by MHW, ahead of 2024 (70%).
  • Focusing on strong or higher category MHW events, 42% of the global ocean was affected by such MHWs, the widest extent ahead of 2024 (39%).

Total Surface Marine Heatwaves


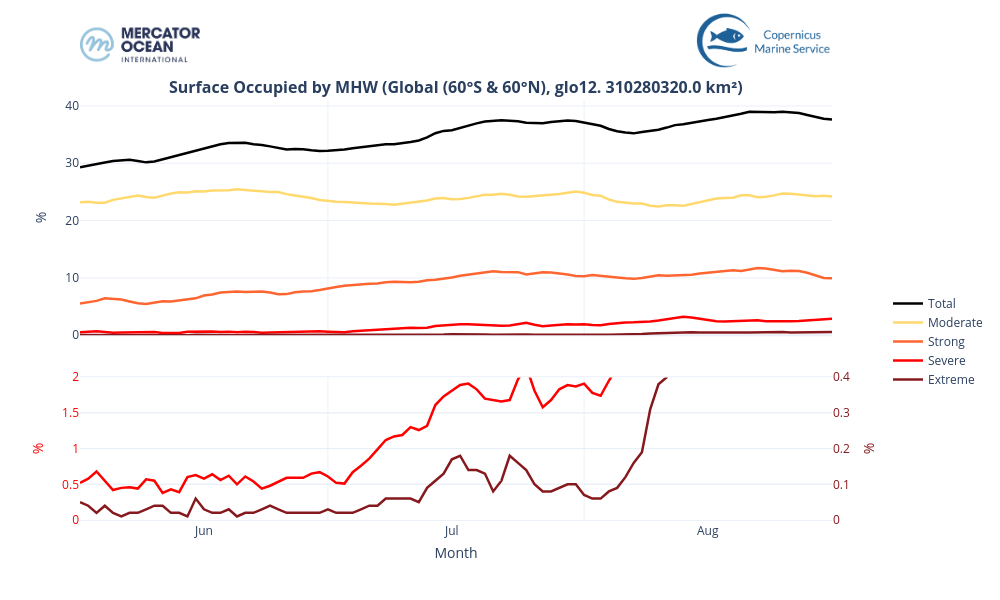
Surface occupied by MHWs in the global ocean (between 60°S and 60°N) between June 2026 and August 2026 based on daily monitoring from GLO12 system. The black solid line represents the total surface of MHW, while the coloured lines represent the surface of each MHW category.
 

  • During the summer of 2026, the total surface increased from 29% to 38% between June and August 2026 with a peak at 39% late August. It concerns mainly moderate and strong categories (~23-24% and 5% to 12%). From mid-July onwards, there was an increase in the ‘severe’ and ‘extreme’ categories, which accounted for 3% and 0.5% respectively of the total area 

Total Number Marine Heatwaves

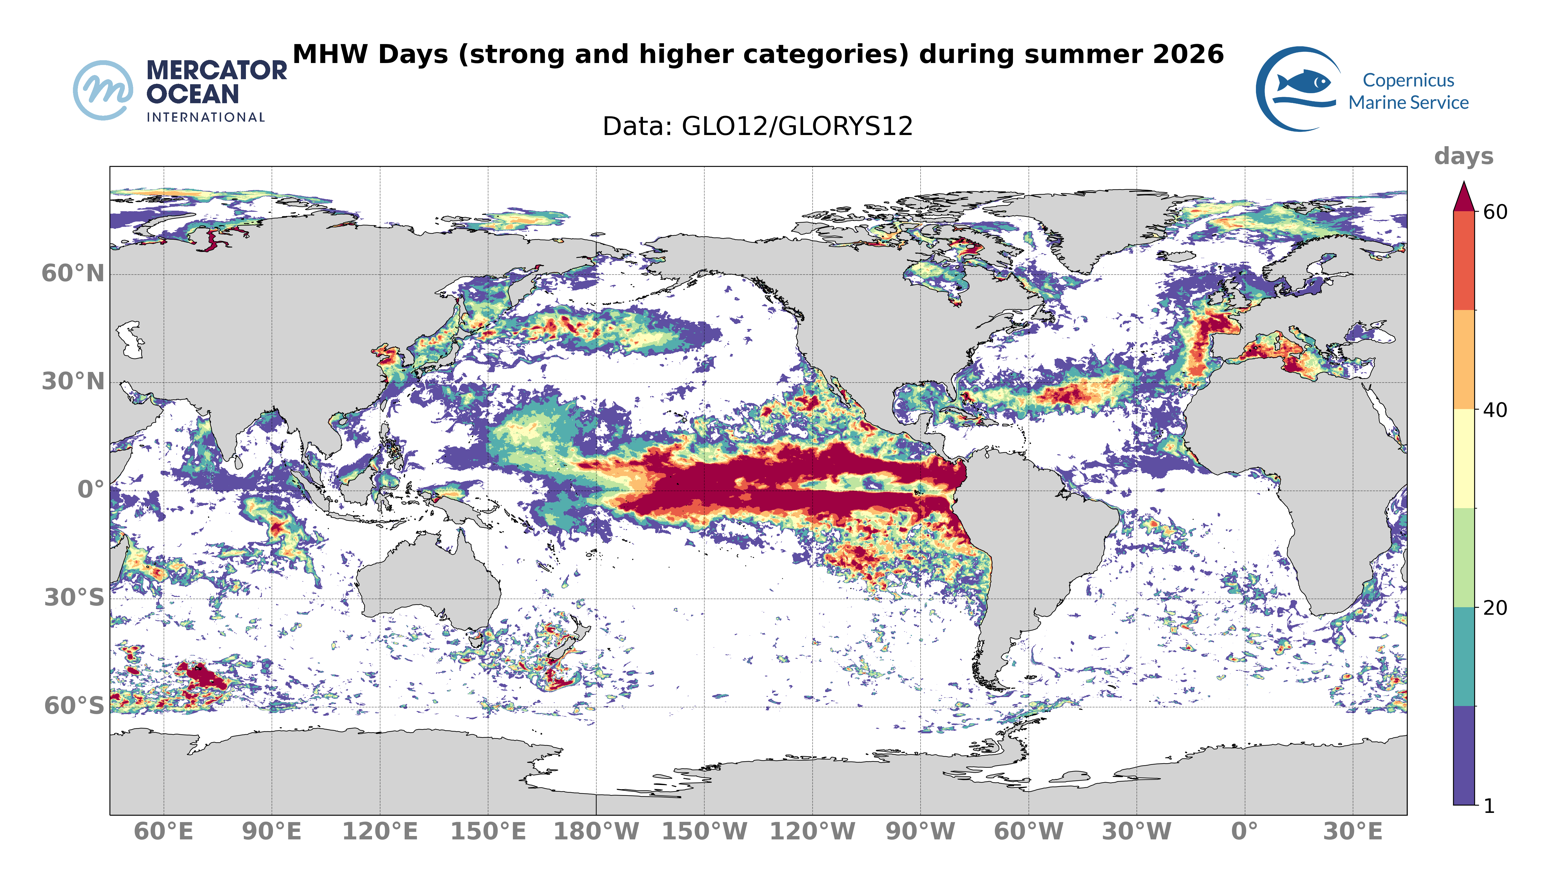
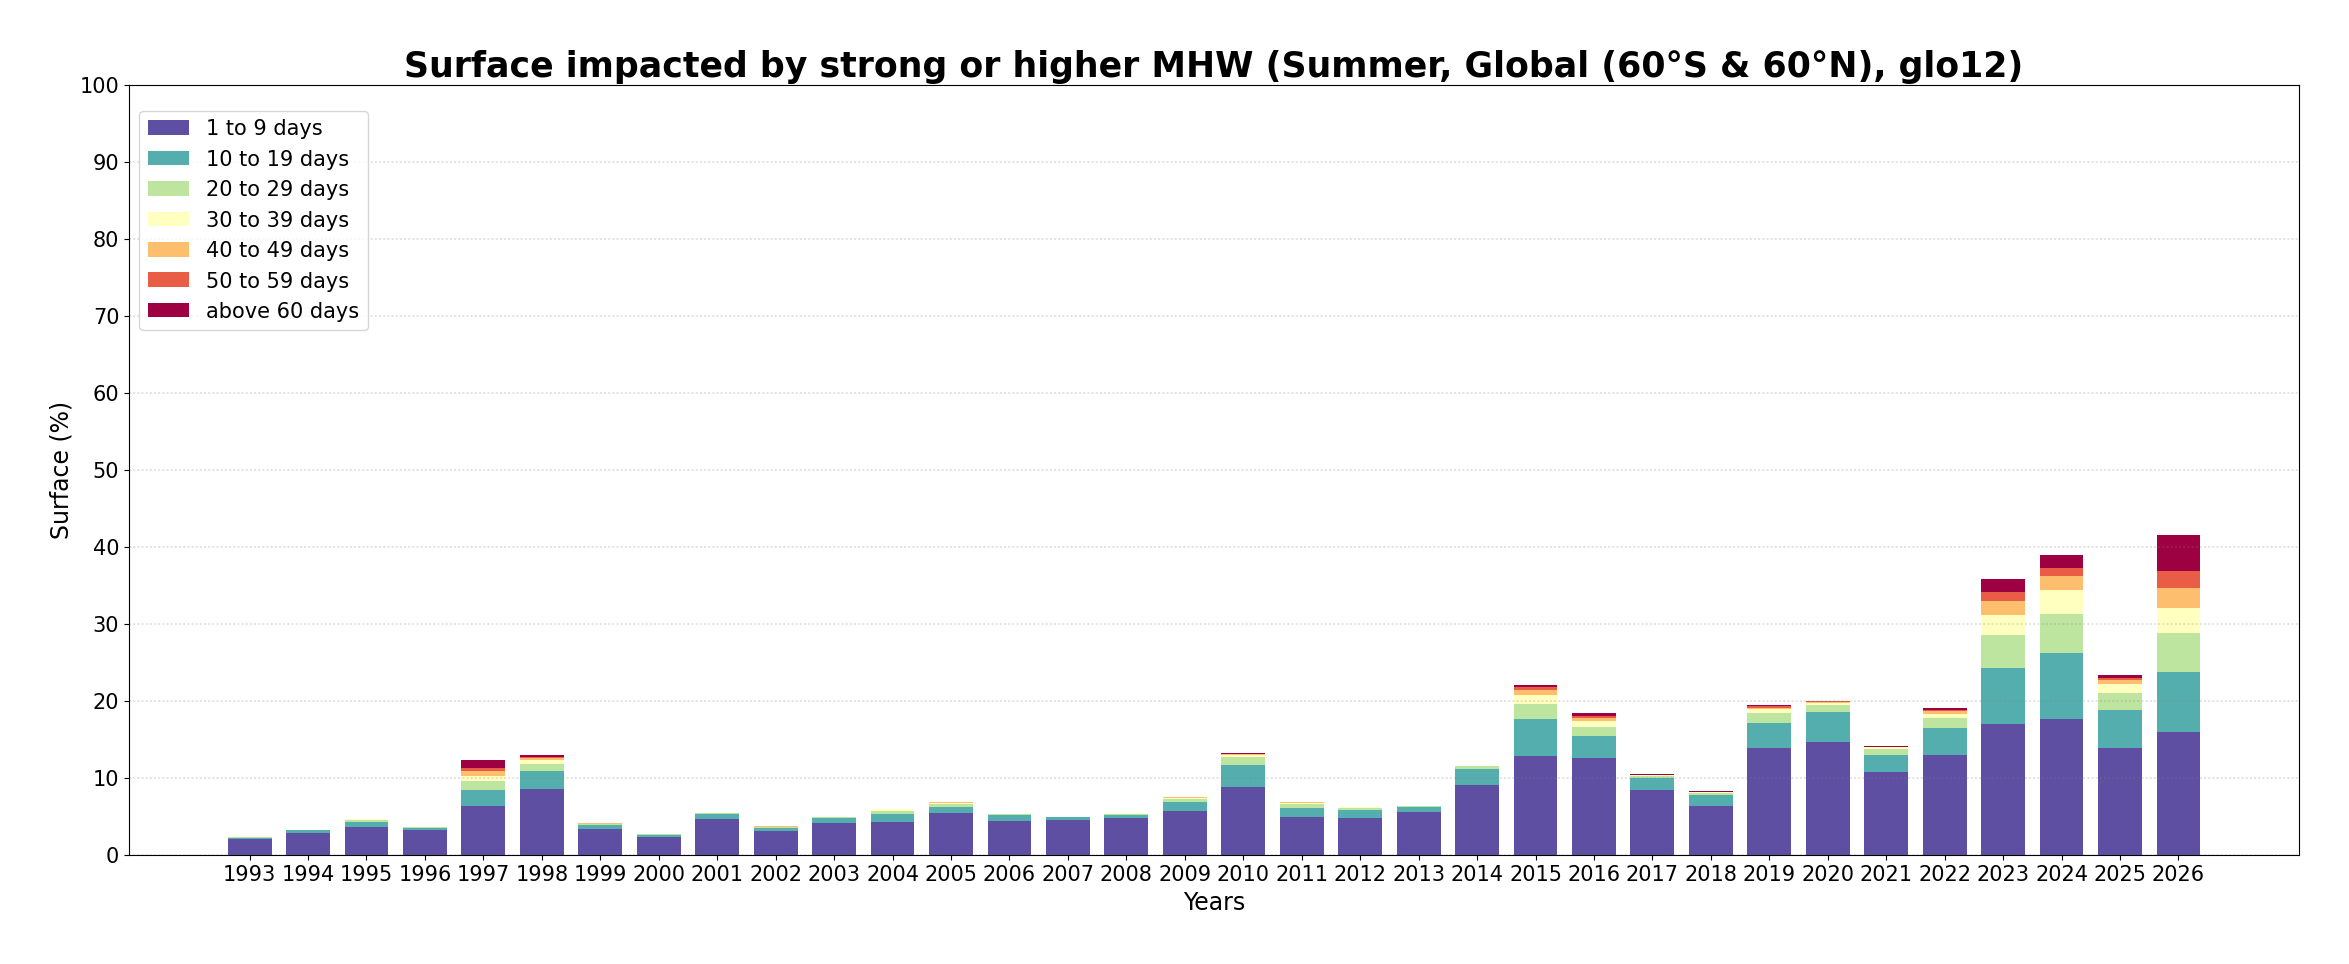
Top: 2026 summer MHW days of strong and higher category. Number of days during which a MHW of category strong, severe or extreme occurred during the summer of 2026. Blank areas mean that no MHW of strong or higher category happened in summer 2026. Bottom: Year by year evolution of the surface impacted by strong and higher MHW for the period June to August. The size of the bar represents the proportion of the global ocean (60°S to 60°N) exposed to a strong or higher MHW. The colours indicate the number of days impacted by such MHW. Credit: European Union, Copernicus Marine Service/Mercator Ocean International


  • Between June and August 2026, 18% of the global ocean (between 60°S and 60°N) was exposed to intense MHW conditions (i.e. strong or higher categories) for more than 20 days (not necessarily consecutive days), which is the 1st   year, ahead of 2024 (13%). The regions most affected are the eastern equatorial Pacific and the North Pacific, the northern subtropical Atlantic, and Europe (the Atlantic and Mediterranean coasts). These regions were notably affected by intense MHW for more than 60 days.


Statistics


The main MHW mean statistics for a given year – MHW duration, intensity, surface occupied and activity– are combined together in a single-colored bubble on a graph to compare the MHW landscape for different years. The larger and the darker the bubble, and the more to the right and to the top, the more the year that the bubble represents is exposed to MHWs.  

At global level, the summer of 2026 was the most extreme summer in terms of MHW duration and intensity. 
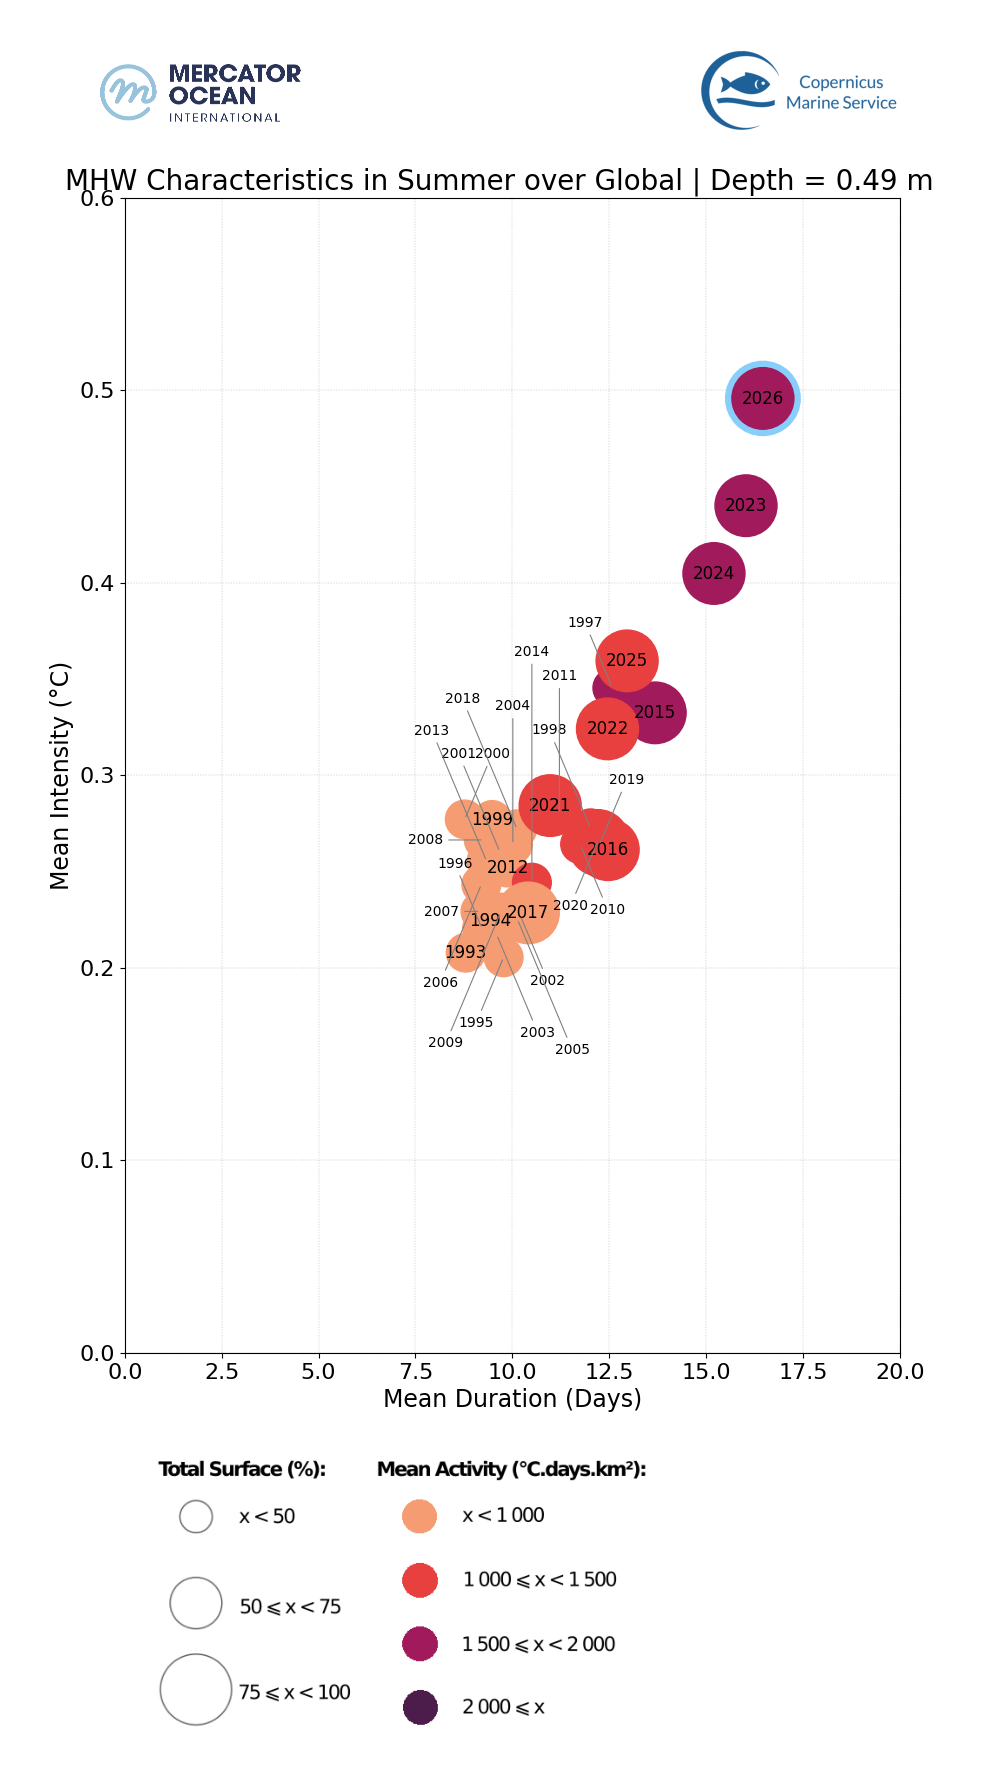
 

Summer MHW Characteristics from 1993 to 2026. Duration, intensity, extent and activity averaged for June –August period between 1993 and 2026 for the global ocean. 2026 is highlighted with a blue edge.

About the Bulletin

Mercator Ocean International publishes a monthly sea surface temperature bulletin reporting on mean temperature and marine heatwave conditions for the month or season just passed. It includes:

  • Regions where MHWs are present and the time these events started,
  • Timeseries showing the total surface occupied by MHWs globally and for the European region,
  • The total number of days of exposure to MHW during the month (including only strong and higher intensity categories).

Data sets and products

Sea Surface Temperature

The results are obtained using the Copernicus Marine Service global analysis and forecasting system together with observation-based products.

  • GLOBAL_ANALYSISFORECAST_PHY_001_024 Global Ocean Physics Analysis and Forecast sea surface temperature. U. Copernicus Marine Service Information (CMEMS). Marine Data Store (MDS). DOI: https://doi.org/10.48670/moi-00016
  • ESA SST CCI reprocessed sea surface temperature analyses. E.U. Copernicus Marine Service Information (CMEMS). Marine Data Store (MDS). DOI: https://doi.org/10.48670/moi-00169
  • NOAA OI SST V2 High Resolution Dataset data provided by the NOAA PSL, Boulder, Colorado, USA, from their website at https://psl.noaa.gov, Huang, B., C. Liu, V. Banzon, E. Freeman, G. Graham, B. Hankins, T. Smith, and H.-M. Zhang, 2021: Improvements of the Daily Optimum Interpolation Sea Surface Temperature (DOISST) Version 2.1, Journal of Climate, 34, 2923-2939. doi: 10.1175/JCLI-D-20-0166.1
  • Global Ocean OSTIA Sea Surface Temperature and Sea Ice Analysis. E.U. Copernicus Marine Service Information (CMEMS). Marine Data Store (MDS). DOI: https://doi.org/10.48670/moi-00165
  • ODYSSEA Global Sea Surface Temperature Gridded Level 4 Daily Multi-Sensor Observations. E.U. Copernicus Marine Service Information (CMEMS). Marine Data Store (MDS). DOI: https://doi.org/10.48670/moi-00016

Notes: The global analysis system was used to study the ocean surface temperature from 2021 and 2025. To study surface temperature for previous years (1991 to 2020), it was used the ESA CCI data. The other observation-based sea surface temperature products (OSTIA, OI SST and Odyssea) were used for calculating monthly mean and uncertainty values for June, July and August 2026.

 Marine Heatwaves

The results are obtained using the Copernicus Marine Service global systems including the analysis and forecasting system together with the reanalysis product.

  • GLOBAL_ANALYSISFORECAST_PHY_001_024 Global Ocean Physics Analysis and Forecast sea surface temperature. U. Copernicus Marine Service Information (CMEMS). Marine Data Store (MDS). DOI: https://doi.org/10.48670/moi-00016
  • GLOBAL_MULTIYEAR_PHY_001_030 Global Ocean Physics Reanalysis sea surface temperature. U. Copernicus Marine Service Information (CMEMS). Marine Data Store (MDS). DOI: https://doi.org/10.48670/moi-00021

Notes: The global analysis system was used to study MHWs for 2024 and 2025. To study MHWs for previous June, July and August months (1993 to 2025), it was used the reanalysis system. The reanalysis product was used for generating a daily climatology using the 30-year period from 1993 to 2022.