The WMO marks World Meteorological Day by releasing its 2025 State of the Global Climate Report, with Mercator Ocean as a key contributor.
The World Meteorological Organization has released its annual flagship report on the State of the Global Climate. Mercator Ocean is honoured to have contributed to this landmark global effort, driven by the expertise of the world’s leading climate scientists.
The report covers key observed global climate indicators, major weather and climate events of 2025 and their impacts on food security, displacement, and socio-economic sectors, while providing data sources and methods employed.
Mercator Ocean’s Senior Advisor on Ocean Science for Policy Dr. Karina von Schuckmann lead-authored three of the global climate indicators sections: Ocean heat content, Ocean acidification and Earth’s energy imbalance. While past reports already featured sections on Ocean heat content and Ocean acidification, this report includes Earth’s energy imbalance as a key global climate indicator for the first time.
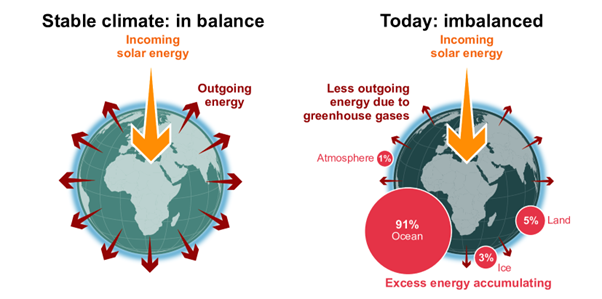
“The Earth’s energy imbalance is not simply a scientific equation or academic discussion. It is the reality facing our planet and our climate right now,” said WMO Secretary-General Celeste Saulo. “In the space of a few decades, human activities have disrupted the natural equilibrium and we will live with these consequences for hundreds and thousands of years.”
“Earth’s energy imbalance is a uniquely powerful climate indicator. It integrates accumulated heat across the entire Earth system, ocean, cryosphere, land, and atmosphere, and reveals both the speed at which heat is building up and where its impacts are being felt. Crucially, it is directly related to climate forcing, especially greenhouse gas emissions.“, said Dr. Karina von Schuckmann
Key findings of the 2025 State of the Global Climate Report
Ocean Heat content
- In 2025, ocean heat content reached the highest level in the 66-year observational record, exceeding the previous record high set in 2024.
- Over the past nine years, each year has set a new record for ocean heat content.
- The rate of ocean warming over the past two decades, 2005–2025, is more than twice that observed over the period 1960–2005.
Ocean pH
- Acidification of the ocean surface has continued over the past 41 years as measured by the steady decrease of global average ocean surface pH.
- Ocean acidification is not increasing uniformly across regions.
Earth’s Energy Imbalance
- In 2025, the observed Earth’s Energy Imbalance (EEI) reached the highest value since the observational record began in 1960
- As a result of the growing imbalance, the total amount of heat stored on Earth is not just increasing but accelerating.
Other key findings
- The past three years are the three warmest years in the 176-year combined land and ocean observational record. 2025 is the second or third warmest year depending on the dataset used, slightly cooler than the record warmth of 2024 due in part to the transition from El Niño at the start of 2024 to La Niña in 2025.
- Eight of the ten most negative annual glacier mass balances since 1950 have occurred since 2016. The ice sheets on Antarctica and Greenland have both lost significant mass since satellite records began.
- The extent of sea ice in the Arctic has decreased in all seasons since satellite measurements began in 1979 and the annual maximum extent in 2025 was the lowest or second lowest in the observed records. Sea-ice extent around Antarctica showed a small long-term increase until 2015, but since then, extents throughout the annual cycle have dropped considerably and the past four years have seen the four lowest Antarctic sea ice minima on record.
- The warming ocean and melting of ice on land from glaciers and ice sheets have both contributed to the long-term rise in global mean sea level. The rate of global sea level rise has increased since satellite measurements began in 1993.
- These rapid large-scale changes in the Earth System have cascading impacts on human and natural systems, contributing to food insecurity and displacement where hazards intersect with high vulnerability and limited adaptive capacity.
Mercator Ocean and the World Meteorological Organization
Mercator Ocean has been consistently supporting the WMO by providing oceanographic data and expertise, including for past State of the Global Climate Reports.
As we transition into an Intergovernmental Organization, Mercator Ocean remains steadfast in its commitment to advancing climate science and delivering the essential data that underpins global action on climate change.
Its contributions to the WMO report reflect a broader mission: equipping policymakers with the scientific knowledge needed to make informed, forward-looking decisions for the future of our planet.