Ocean Temperature Bulletin
May 2026

Mercator Ocean International (MOi) oceanographers examine marine heatwaves across the global ocean. They analyse a variety of datasets from observation analyses
(satellite sea surface temperature maps) to model analyses
(assimilating satellite and in situ observations) and model forecasts.¹

All images in this article can be used freely and should be credited with the following information :
Image source: European Union, Copernicus Marine Service Data 2025 © Mercator Ocean .

Key takeaway

  • May 2026 was the second-warmest May on record for the global ocean (60°S-60°N), with a mean sea surface temperature (SST) of 20.97 ± 0.06°C, surpassed only by May 2024 (20.99 ± 0.05°C).
  • For the Mediterranean Sea and the North Atlantic (0°N–60°N), , May 2026 registered within the ten-warmest May months, with SST of 19.44 ± 0.30°C  and 21.56 ± 0.11°C.
  • In the Equatorial Pacific, ENSO conditions are in a neutral phase with mean SST above average for the entire width of the basin, continuing the warming of the area initiated at the beginning of 2026.
  • Marine heatwave conditions for the global ocean were the third-most extreme May as well as for the Mediterranean Sea in terms of intensity.
  • During the second half of May 2026, large parts of oceanic waters surrounding western Europe of the Atlantic and Mediterranean Sea were exposed to fast developing marine heatwave reaching severe and locally extreme categories. 

sea Surface Temperature

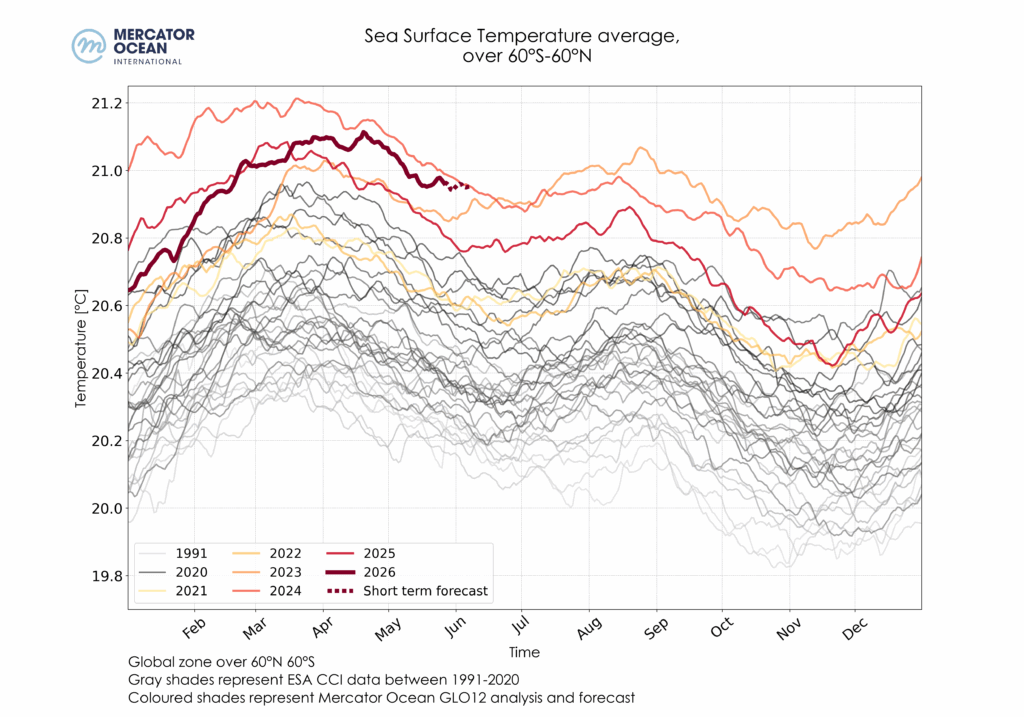
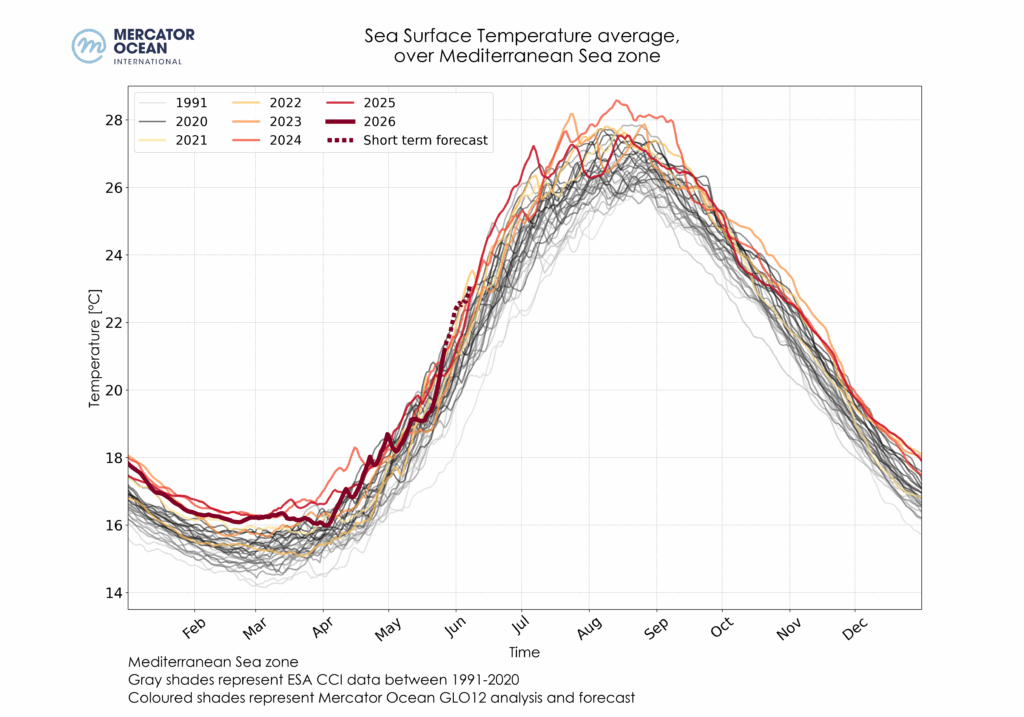
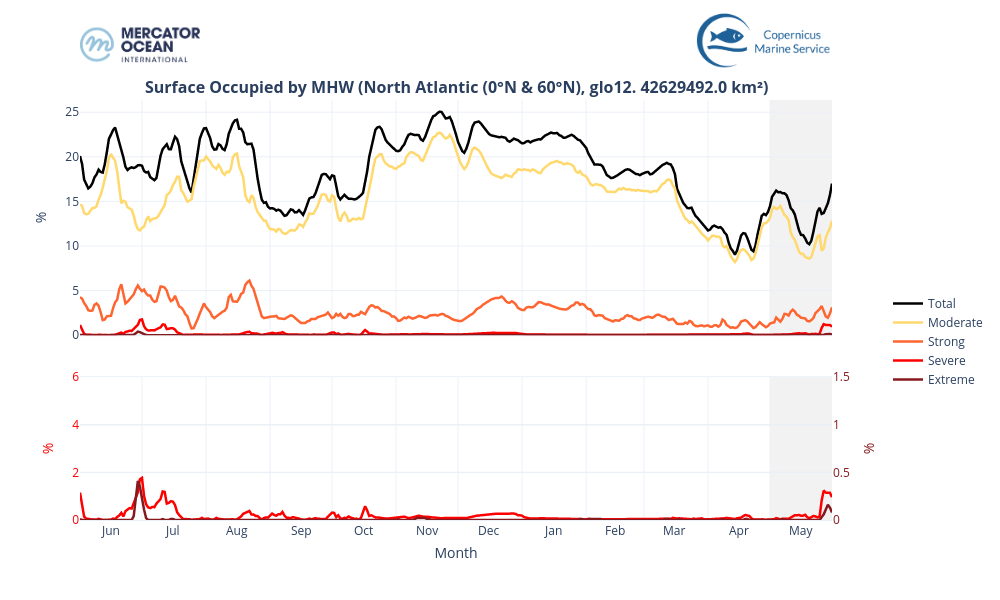
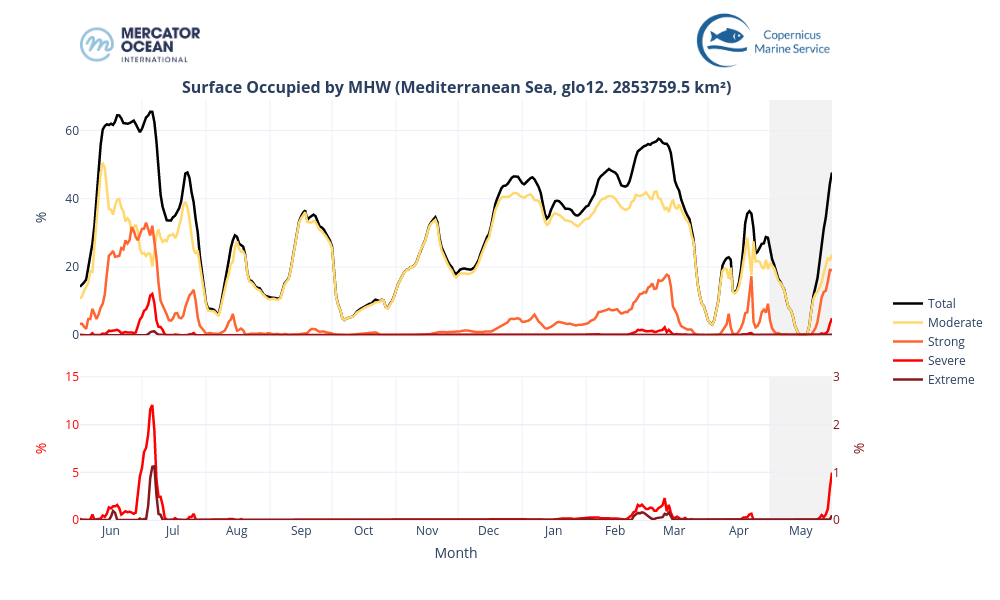
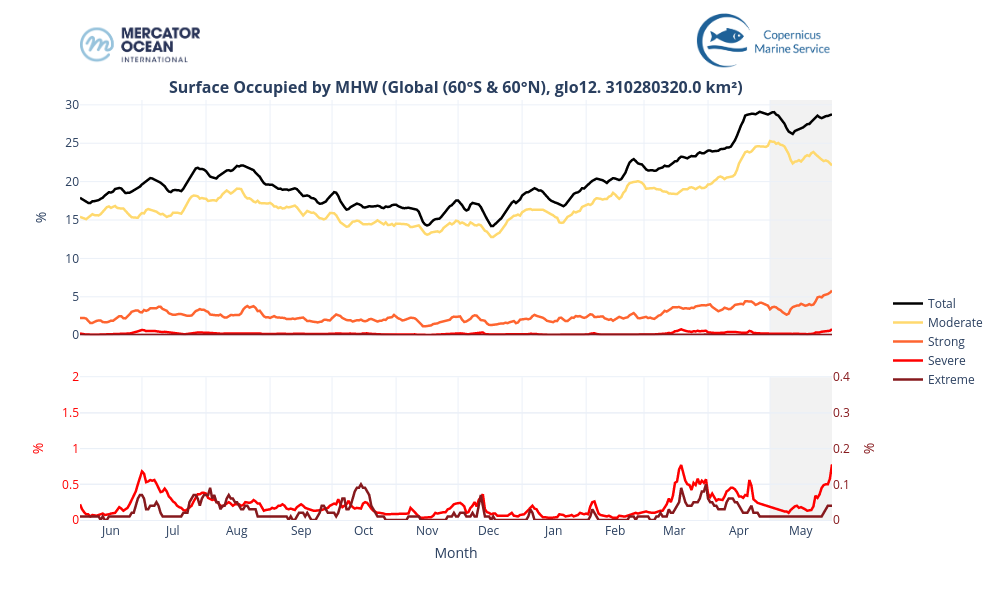
Daily sea surface temperatures averaged for the global ocean (left), the Mediterranean Sea (middle) and the North Atlantic Ocean (right) between 1991-2020 using ESA’s Climate Change Initiative (grey shades), and between 2021-2026 (coloured shades) using Mercator Ocean International’s GLO12 analysis and forecast.

  • At the global level (between 60°S and 60°N), May 2026 was the second-warmest May on record, with a mean sea surface temperature (SST) of 20.97 ± 0.06°C, surpassed only by May 2024 (20.99 ± 0.05°C).
  • In the Mediterranean Sea, May 2026 ranked as the ninth-warmest May on record, with a mean SST of 19.44 ± 0.30°C. The warmest May recorded in the basin remains May 2018, when the mean SST reached 20.03 ± 0.29°C.
  • In the North Atlantic (0°N–60°N), May 2026 also ranked among the ten warmest Mays on record, with a mean SST of 21.56 ± 0.11°C.


SEA SURFACE TEMPERATURE ANOMALIES


May 2026 Mean SST Anomaly relative to a 30-year climatology (1993-2022), calculated using daily data from Mercator Ocean International’s GLO12 analysis and forecasting system for 2026 and from the GLORYS12 reanalysis for the climatological mean.

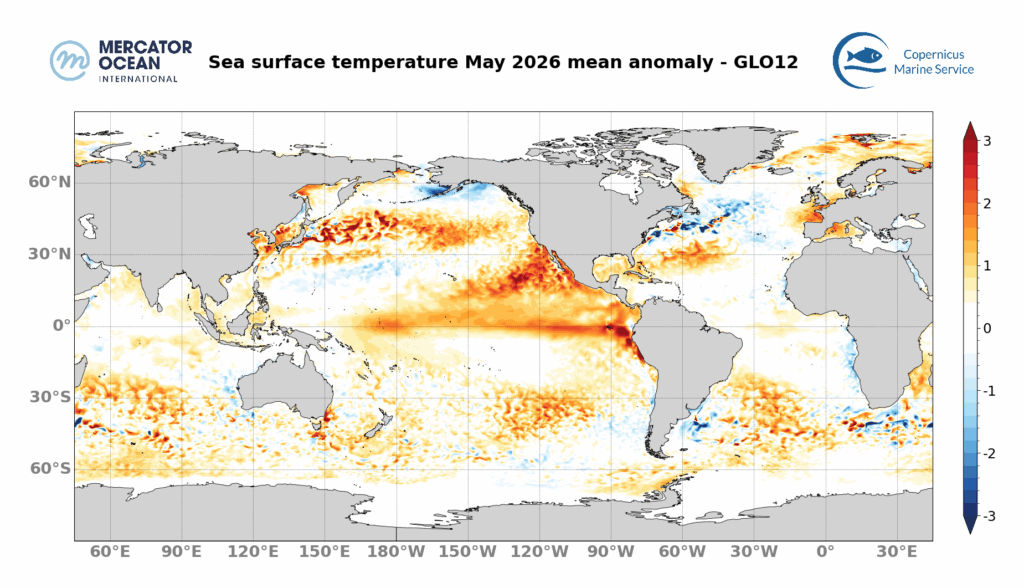
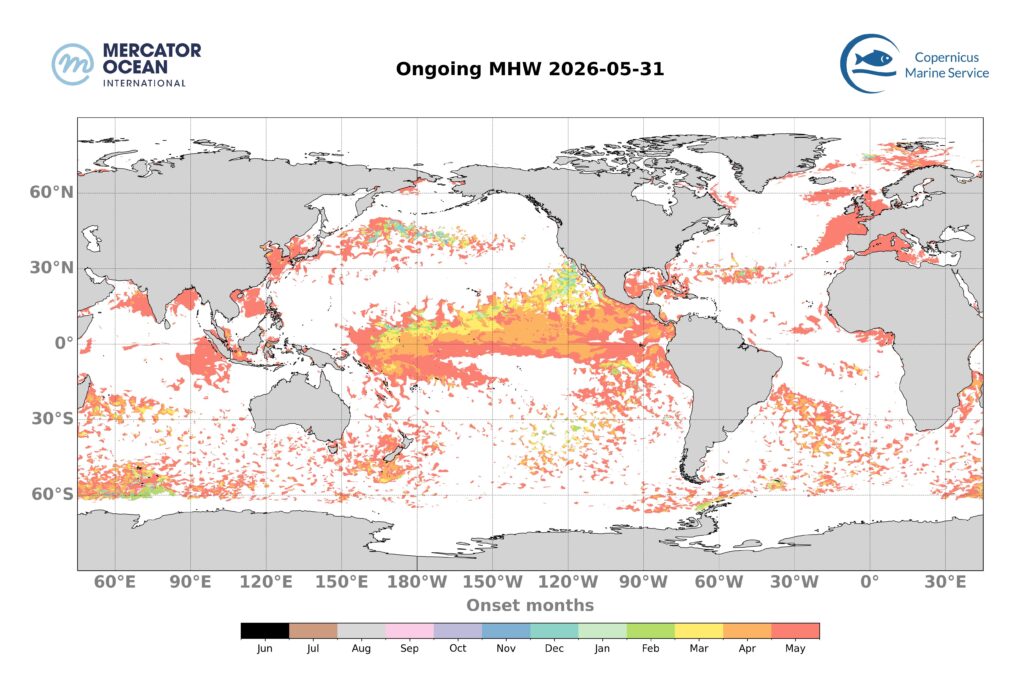
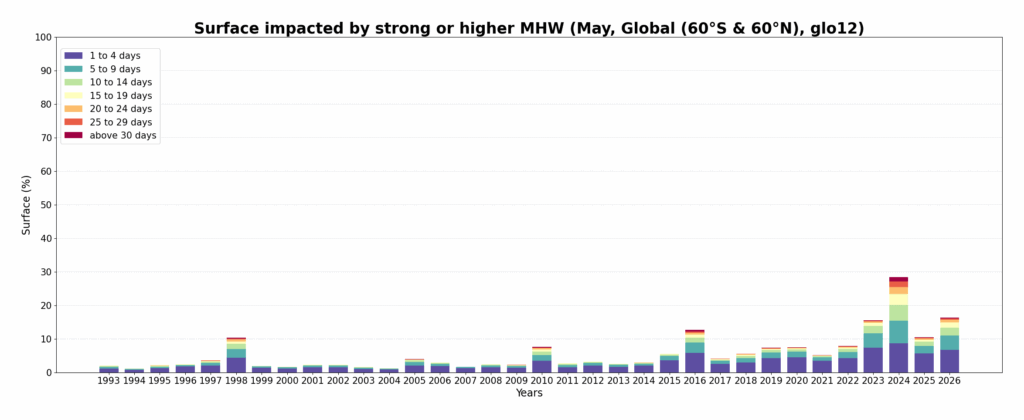
In May 2026 more than 3 quarters of the global ocean (between 60°S and 60°N) show above average mean SSTs (78%), and 19% of the global ocean is above average by at least 1°C (Figure 2).

  • Most of the Mediterranean Sea (70%) showed above-average SSTs, with stronger SSTs in the western part, reaching 1.5°C. 
  • The North Pacific Ocean showed predominantly warmer than average SSTsspanning the entire width of the basin and reaching 3°C above average in the Kuroshio region and  its extension as well as on the eastern part between Hawaii and Mexico . In the South Pacific, strong SSTs, reaching 3°C above average were observed off the Peru coast. In the Equatorial Pacific, ENSO conditions are in a neutral phase with mean SST above average for the entire width of the basin, continuing the warming of the area initiated at the beginning of the year. 
  • The North Atlantic, on the western side displayed above-average SSTs in the tropics and below average at midlatitude. The eastern part experienced above-average anomalies off the European coast reaching up to 2°C.
  • The South Atlantic showed below average temperature on the eastern part along the African coast 
  • In the Indian Ocean, above average SSTs are observed east of Madagascar, reaching up to 2°C above average. 


Ranking of average monthly SSTs reached in May 2026, calculated using daily data from Mercator Ocean International’s GLO12 analysis and forecasting system for 2026 and from the GLORYS12 reanalysis for the climatological mean. Colours indicate the rank of May 2026 among all months of May since 1993.

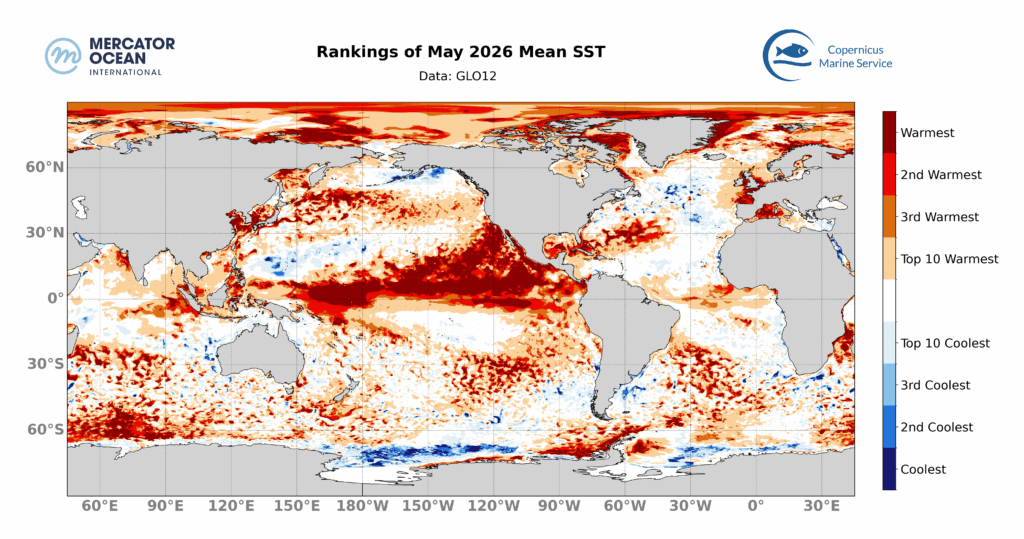
The ranking of average monthly SSTs is monitored so to contextualise the current situation relative to previous Mays. This ranking is based on May monthly SST averages from 1993 to 2026. Here, we look at the ranking of May 2026 among all May months since 1993. 

  • Around 9% of the global ocean (between 60°S and 60°N) ranked as the warmest May month on record, with regions in the equatorial Pacific, Southern Ocean and surrounding western Europe most affected. 
  • In the equatorial Pacific (30°S and 30°N) May 2026 was the warmest May for 17% of the region covering a large region from the north eastern equatorial region that extends to the west the full width of the basin. 

Ongoing Marine Heatwaves

Month of onset for the ongoing MHWs on the 31th of Mayl 2026. The colours indicate the month during which the MHW started. For instance, ocean pixels in red correspond to an MHW that developed during May 2026 and are less than one month old, in orange MHW between 1 and 2 months old, etc.
  • On the 30th of May, 29% of the global ocean (between 60°S and 60°N) was affected by MHWs.  
  • The majority of these MHWs developed recently, with 22% of the global Ocean (between 60°S and 60°N) affected by MHWs less than 1 month old and 5% by events between 1- and 2-month-old. 
  • Widespread and persistent MHWs are found in the central Pacific, spanning the entire width of the basin, with the oldest MHW developed in february in the western and north-eastern part. 3-month-old MHWs can also be found in the South Pacific around 120°W. In the North Pacific, off northern Japanese coasts, MHW are persisting since December 2025.  
  • In the Southern Ocean, between 60°E and 90°E, persistent MHWs are also present with duration reaching 3 to 4 months.

Total Surface Marine Heatwaves

Global Ocean (60°S-60°N)

Surface occupied by MHWs in the global ocean (between 60°S and 60°N) between Juin 2025 and Mayl 2026 based on daily monitoring. The black solid line represents the total surface of MHW, while the coloured lines represent the surface of each MHW category. The grey background highlights the month of May 2026.


  • In May 2026, the total surface area of MHW (black line) fluctuated between 25% an 30% of the global ocean (between 60°S and 60°N. 
  • The majority of MHWs events were of moderate categories (around 22to 25of the global ocean) with strong category events increasing steadily across the month to reach around 6% of the global ocean.
  • For comparison, the total surface occupied by MHWs at the end of  May 2025 was notably lower ( ~18% by the end of the month ).


Mediterranean Sea


Surface occupied by MHWs in the global ocean (between 60°S and 60°N) between Juin 2025 and Mayl 2026 based on daily monitoring. The black solid line represents the total surface of MHW, while the coloured lines represent the surface of each MHW category. The grey background highlights the month of May 2026.


  • For the Mediterranean Sea, the total area covered by MHWs increased during May 2026, from 26% to ~48%. These MHW were mainly moderate and strong in category (~24% and ~19% by the end of the month, respectively). 

North Atlantic (0°N-60°N)


Surface occupied by MHWs in the North Atlantic (between 0°N and 60°N) between June 2025 and May 2026 based on daily monitoring. The black solid line represents the total surface of MHW, while the coloured lines represent the surface of each MHW category. The grey background highlights the month of May 2026.


  • For the North Atlantic (between 0°N and 60°N)the total surface area of MHW fluctuated  around15% during May 2026, with minimum of ~10% mid month. These events are predominantly of moderate category.

Total Number Marine Heatwaves


May 2026 MHW days of strong and higher category. Number of days during which a MHW of category strong, severe or extreme occurred in May 2026. Blank areas mean that no MHW of strong or higher category happened during the month. Blue shaded areas in the polar regions represent the sea ice maximum from the climatological period (1993-2022). Monitoring SST extremes with the MHW categorization approach as used here is not best suited for such regions.


Year by year evolution of the surface impacted by strong and higher MHW during months of May. The size of the bar represents the proportion of the global ocean (between 60°S and 60°N) exposed to a strong or higher MHW during the month. As indicated by the colours, the proportion exposed to such MHWs is categorized according to the number of days impacted during the month.


  • 16% of the surface of the ocean was impacted by strong-or-higher MHW conditions for at least 1 day during May 2026. This is the 2nd widest extent of the last 34 years, after only 2024 (28%). The central Pacific is the most affected, with areas where MHWs persisted the entire month (Figure 7).
  • Regionally, 13% of the North Atlantic (between 0°N and 60°N) was impacted by strong, or higher, MHW conditions for at least 1 day. This corresponds to the 6th largest extent of the last 34 years for a May month.
  • For the Mediterranean Sea, 29% of the basin was affected by strong-or-higher MHW conditions for at least 1 day, which is the 4th largest extent for a May month, after 2018 (40%), 2013 (35%) and 2020 (33%).

Statistics

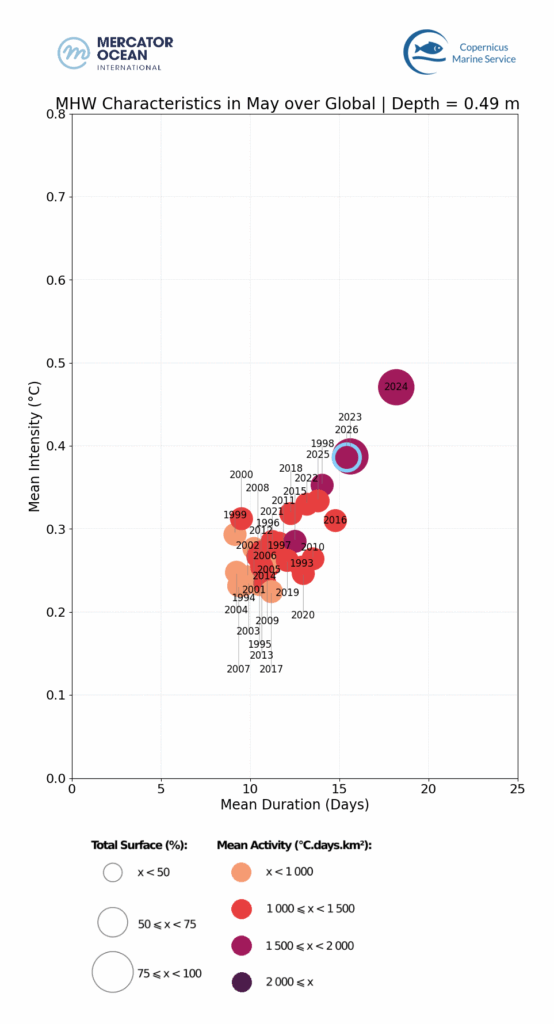
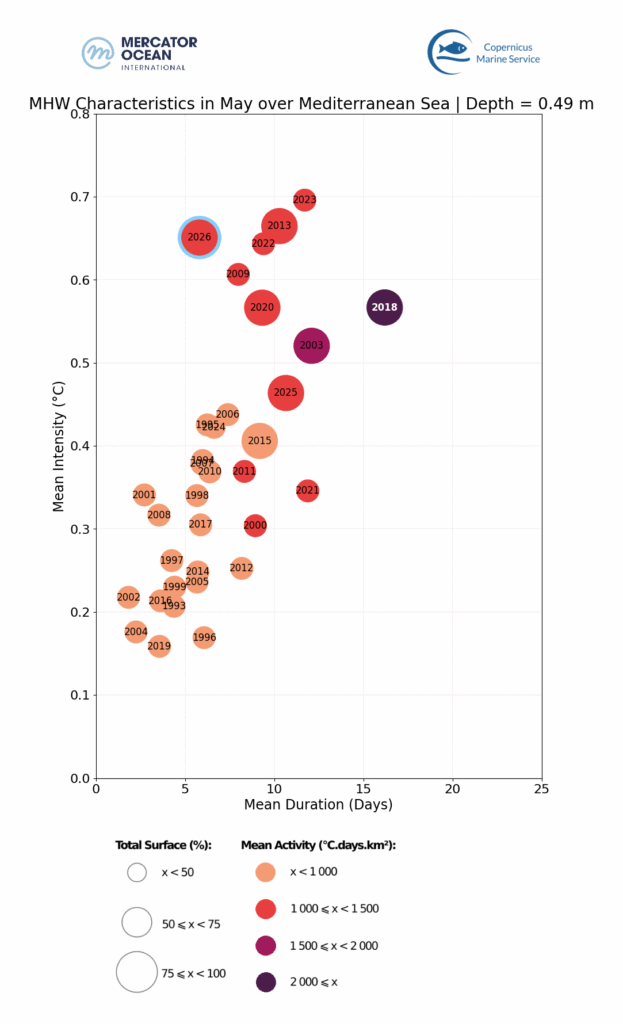
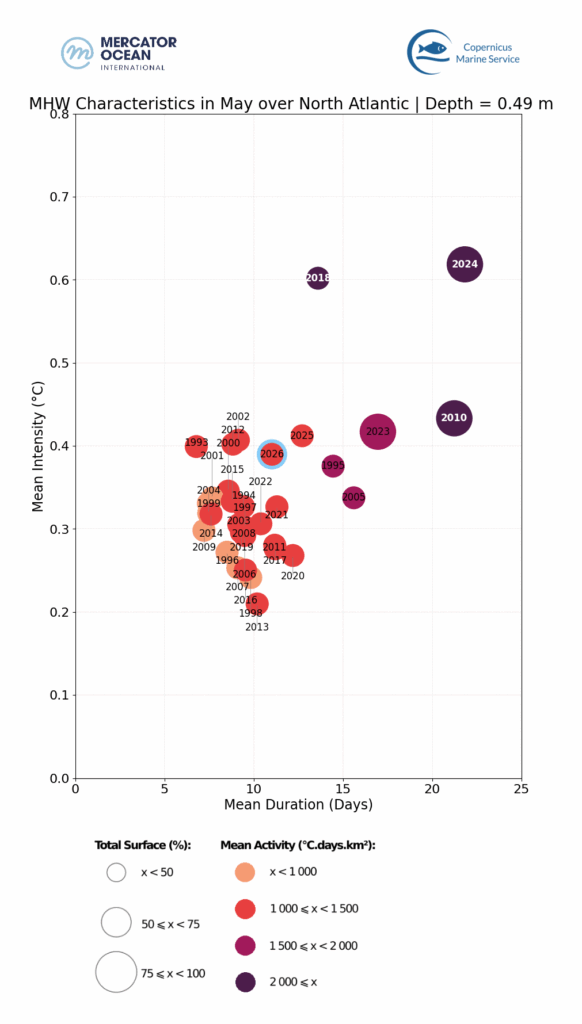
MHW Characteristics for Mat months from 1993 to 2026. Duration, intensity, extent and activity averaged for each March month between 1993 and 2026 for the global ocean (left), for the Mediterranean Sea (centreer) and the North Atlantic Ocean (right). May 2026 is highlighted with a blue edge. 

  • On a global scale, May 2026 was the 3rd most extreme May month in terms of MHW after 2023 and 2024.  
  • In the Mediterranean Sea, May 2026 was the 3th most extreme May in terms of MHW intensity, after, 2013 and 2023. 
  • In the North Atlantic, May 2026 stands within the 10 most extreme May month in terms of MHW from the last 34 years, areas particularly affected being the Sargasso Sea and the eastern part of the basin along the European coast (see Marine Heatwave Bulletin). 


About the Bulletin

Mercator Ocean International publishes a monthly sea surface temperature bulletin reporting on mean temperature and marine heatwave conditions for the month just passed. It includes:

  • Regions where MHWs are present and the time these events started,
  • Timeseries showing the total surface occupied by MHWs globally and for the European region,
  • The total number of days of exposure to MHW during the month (including only strong and higher intensity categories).

Data sets and products

Sea Surface Temperature

The results are obtained using the Copernicus Marine Service global analysis and forecasting system together with observation-based products.

  • GLOBAL_ANALYSISFORECAST_PHY_001_024 Global Ocean Physics Analysis and Forecast sea surface temperature. U. Copernicus Marine Service Information (CMEMS). Marine Data Store (MDS). DOI: https://doi.org/10.48670/moi-00016
  • ESA SST CCI reprocessed sea surface temperature analyses. E.U. Copernicus Marine Service Information (CMEMS). Marine Data Store (MDS). DOI: https://doi.org/10.48670/moi-00169
  • NOAA OI SST V2 High Resolution Dataset data provided by the NOAA PSL, Boulder, Colorado, USA, from their website at https://psl.noaa.gov, Huang, B., C. Liu, V. Banzon, E. Freeman, G. Graham, B. Hankins, T. Smith, and H.-M. Zhang, 2021: Improvements of the Daily Optimum Interpolation Sea Surface Temperature (DOISST) Version 2.1, Journal of Climate, 34, 2923-2939. doi: 10.1175/JCLI-D-20-0166.1
  • Global Ocean OSTIA Sea Surface Temperature and Sea Ice Analysis. E.U. Copernicus Marine Service Information (CMEMS). Marine Data Store (MDS). DOI: https://doi.org/10.48670/moi-00165
  • ODYSSEA Global Sea Surface Temperature Gridded Level 4 Daily Multi-Sensor Observations. E.U. Copernicus Marine Service Information (CMEMS). Marine Data Store (MDS). DOI: https://doi.org/10.48670/moi-00016

Notes: The global analysis system was used to study the ocean surface temperature from 2021 and 2025. To study surface temperature for previous years (1991 to 2020), it was used the ESA CCI data. The other observation-based sea surface temperature products (OSTIA, OI SST and Odyssea) were used for calculating monthly mean and uncertainty values for May 2026.

 Marine Heatwaves

The results are obtained using the Copernicus Marine Service global systems including the analysis and forecasting system together with the reanalysis product.

  • GLOBAL_ANALYSISFORECAST_PHY_001_024 Global Ocean Physics Analysis and Forecast sea surface temperature. U. Copernicus Marine Service Information (CMEMS). Marine Data Store (MDS). DOI: https://doi.org/10.48670/moi-00016
  • GLOBAL_MULTIYEAR_PHY_001_030 Global Ocean Physics Reanalysis sea surface temperature. U. Copernicus Marine Service Information (CMEMS). Marine Data Store (MDS). DOI: https://doi.org/10.48670/moi-00021

Notes: The global analysis system was used to study MHWs for 2024 and 2025. To study MHWs for previous Mays (1993 to 2025), it was used the reanalysis system. The reanalysis product was used for generating a daily climatology using the 30-year period from 1993 to 2022