
Mercator Ocean International oceanographers examine marine heatwaves across the global ocean for the month of July and forecasts for the 3rd week of July 2023. They analyse a variety of datasets from observation analyses (satellite sea surface temperature maps) to model analyses (assimilating satellite and in situ observations) and model forecasts.¹
Assessment for the first two weeks of July 2023
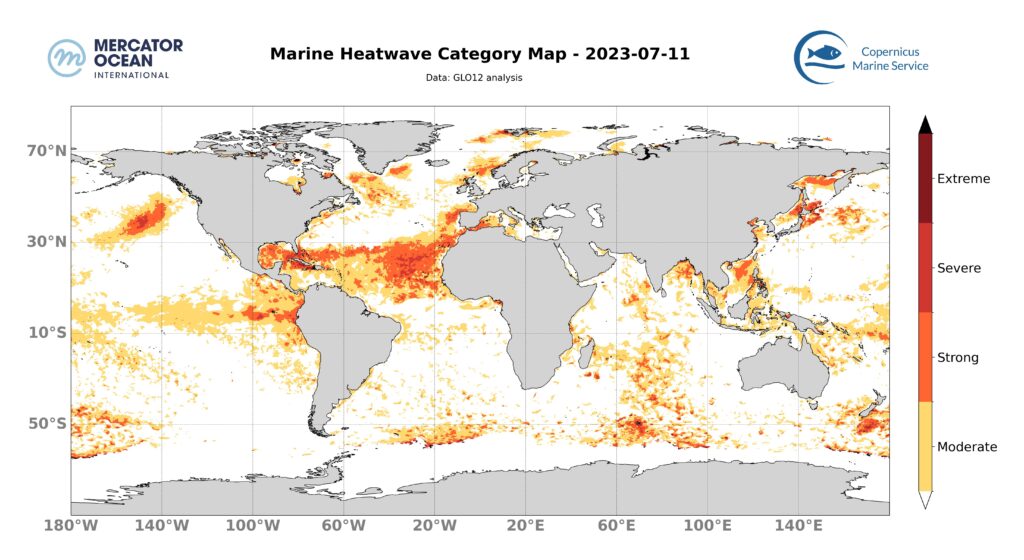
- The intensity of the heatwave that hit most of the North-East Atlantic in June 2023 continues to diminish, moving from extreme to moderate and locally strong off the Iberian Peninsula and in the northern North Sea between the British Isles and Norway.
- A heatwave is still present in the tropical North Atlantic (from 15N to 30N) and stretches across the entire width of the basin, ranging from strong to severe in the east and moderate to strong in the west.
- The presence of a heat wave south of Greenland in the Labrador Sea is suspected in the models.
- The heatwave in the north-east Pacific remains moderate to strong
- The tropical Pacific is experiencing a moderate heat wave reaching high intensity near the coast of Peru, which is consistent with current El Niño conditions.
- There are also heat waves in the southern hemisphere in the southern Indian Ocean and the Pacific.
Forecasts for the 3rd week of July 2023 and onwards
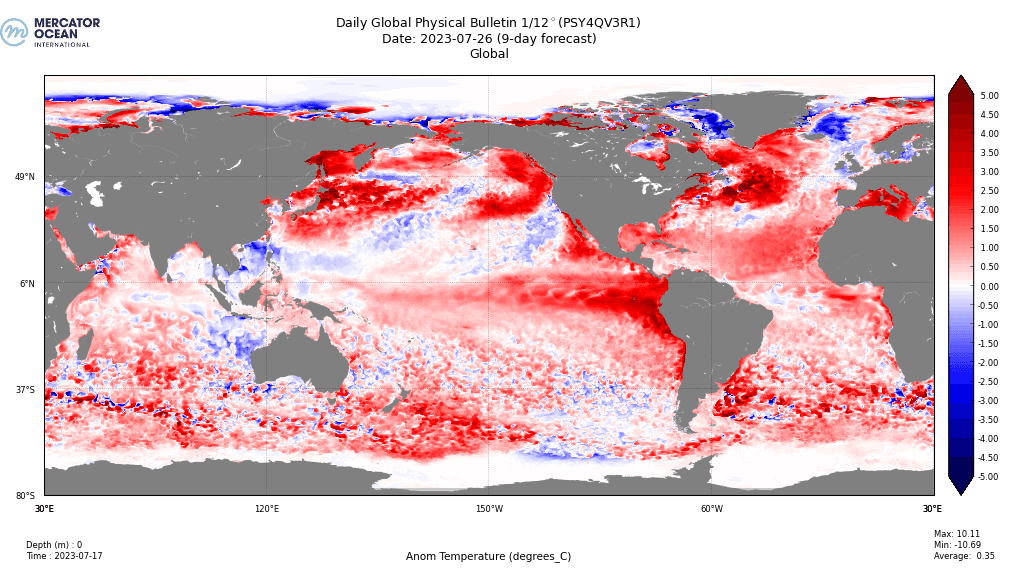
- In the North-East Atlantic zone, the heatwave continues to diminish, becoming moderate or disappearing, while in the North-West zone, the heatwave present locally in the model is increasing in size and intensifying from moderate to strong in the Labrador Sea.
- The heatwave in the tropical North Atlantic remains stable in the models.
- The heatwave in the west of the Mediterranean extends to the entire eastern basin, remaining in the moderate to strong category. In particular, it is moving from the strong and severe to the severe and extreme categories around the Straits of Gibraltar.
- The heatwave in the tropical North Pacific intensifies eastwards over Central America.
Marine heatwaves (MHW) are extreme rises in ocean temperature for an extended period of time. They can occur at different locations in the ocean, and their magnitude and frequency have increased over the last couple of decades, with harmful impacts on ecosystems, and human activities. According to the latest report released by the Intergovernmental Panel on Climate Change (IPCC AR6 SYR), it is found with high confidence that in the near-term at 1.5°C global warming, the increasing frequency of marine heatwaves will increase risks of biodiversity loss in the oceans, including from mass mortality events.2
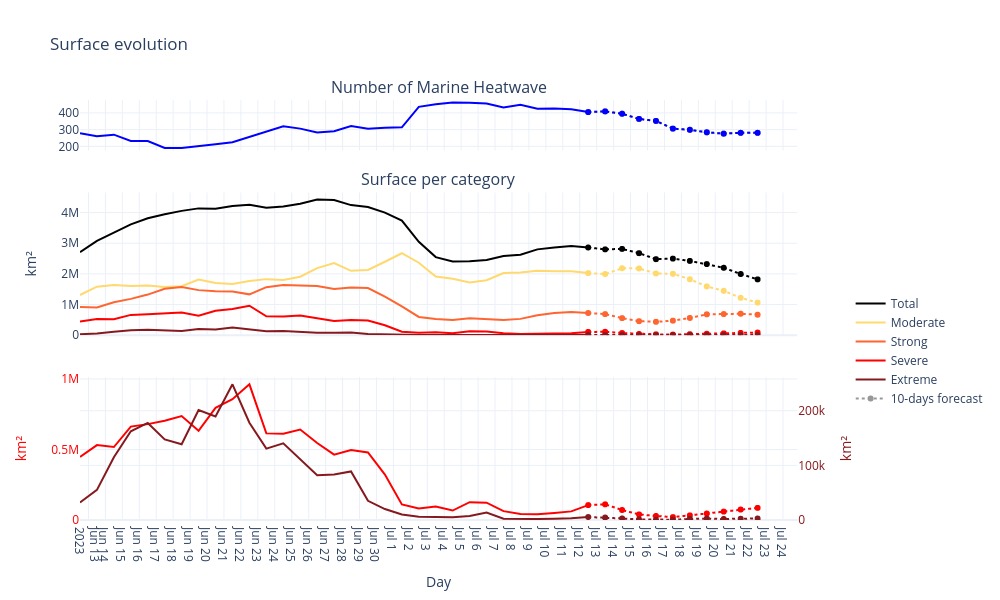
The bottom panel shows the curves for the severe (red) and extreme (brown) heatwaves in the middle panel, on a smaller scale to give a clearer picture of the trends (on the left, up to 1,000,000 square kilometres for the severe category; on the right, up to 250,000 square kilometres for the extreme category).
Criteria used: Oliver et al (2021) https://doi.org/10.1146/annurev-marine-032720-095144
¹Analysis of datasets: OSTIA sea surface temperature observations analysis (Copernicus Marine Service), OISST sea surface temperature observations analysis (NOAA), GLO12 model (Copernicus Marine Service, Mercator Ocean International)
² IPCC AR6 SYR 4.3 https://www.ipcc.ch/report/ar6/syr/downloads/report/IPCC_AR6_SYR_LongerReport.pdf