
The oceanographers at Mercator Ocean International (MOi) are studying marine heatwaves across the global ocean. They analyze a variety of datasets ranging from observational analyses (satellite-derived sea surface temperature maps) to model analyses (assimilating satellite and in situ observations) and model forecasts.[1]
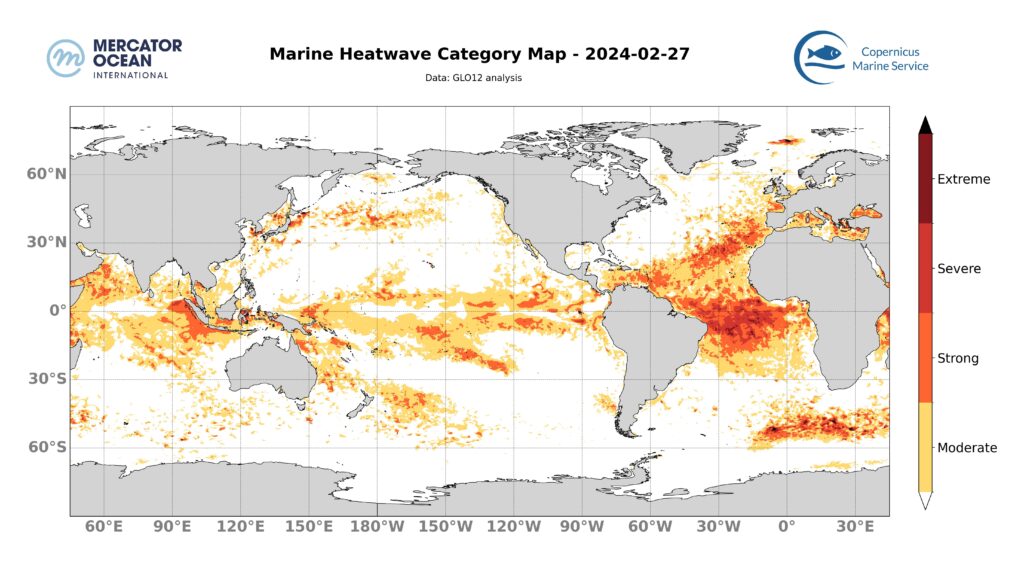
Summary for February 27th
Categories of marine heatwaves
North Atlantic
The intensity of the marine heatwave present for several months along the Northeast Atlantic coast is decreasing, transitioning from strong and severe categories to moderate in many areas
Mediterranean Sea
In the western Mediterranean basin, the marine heatwave is weakening in intensity with a decrease in the area covered by strong categories.
In the eastern Mediterranean basin, the marine heatwave remains stable, with predominantly moderate and strong categories
Tropical North Atlantic
Caribbean Sea – The intensity of the marine heatwave is diminishing, with a decrease in the area covered by strong categories.
At the equator, the marine heatwave is intensifying, with an increase in the area covered by severe categories in the central basin.
South Tropical Atlantic
The marine heatwave remains generally stable, with predominantly moderate to strong categories and locally severe.
Tropical Pacific
Eastern Pacific – the marine heatwave associated with El Niño conditions remains stable, with primarily moderate categories and locally strong categories.
South Pacific, – East of New Zealand, the intensity of the marine heatwave diminishes with the reduction in the area of the strong categories
Indian Ocean
Arabian Sea – marine heatwaves present in the Arabian Sea, off the Horn of Africa, north of Madagascar, and in the Bay of Bengal, decrease in intensity as the area of strong categories decreases in favor of moderate categories.
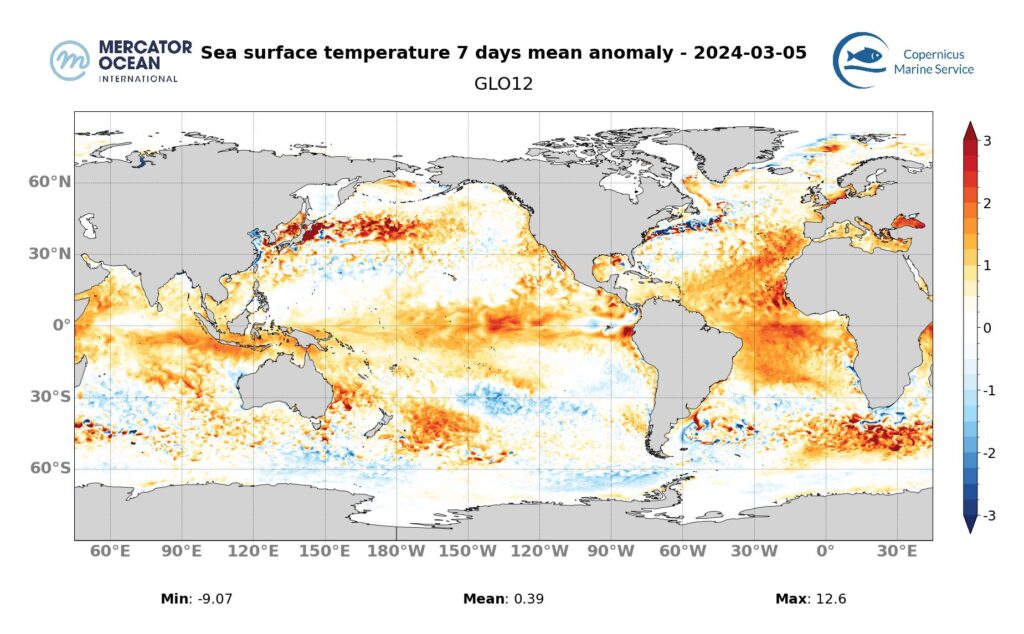
Weekly temperature anomalies
North-east Atlantic – 0.5°C et 2.5°C
Mediterranean Sea – 0.5°C à 1.5°C localement
Tropical North Atlantic – 0.5°C et 2.5°C (au large de l’Equateur – 0.5 °C et 1.5°C)
South Atlantic – 1°C à 3°C
South Tropical Atlantic – 0.5°C et 1.5°C
Southern Ocean – 1°C et 3°C.
Pacifique Tropical – 1°C et 2.5°C
South Pacific -1.5 °C et 3°C
Indian Ocean- 0.5°C et 2°C
Forecasts for March 5th
Europe Zone
North Atlantic – The Mercator Ocean International (MOI) forecasting system predicts that the marine heatwave will decrease in intensity along the Northeast Atlantic facade, with a reduction in strong categories as well as a decrease in the area of moderate categories
Mediterranean Sea – The marine heatwave is decreasing in intensity in the western part of the basin, with a reduction in strong categories and a decrease in the area of moderate categories. The eastern part of the basin remains stable.
Global Zone
North Tropical Atlantic – For March 5th, MOI predicts that the marine heatwave present in the North Tropical Atlantic will remain stable.
Equator – The marine heatwave is intensifying in intensity, with an increase in the area of strong, severe, and even extreme categories.
South Tropical Atlantic – The area of the strong category marine heatwave is increasing. The marine heatwave present in the Southern Ocean southwest of South Africa (between 30°W and 30°E) remains stable.
South Atlantic – the marine heatwave remains stable. The marine heatwave present in the Southern Ocean southwest of South Africa (between 30°W and 30°E) remains stable.
Tropical Pacific – In the Tropical Pacific, the marine heatwave associated with El Niño conditions remains generally stable. It strengthens around Papua New Guinea, where strong categories develop.
South Tropical Pacific – The marine heatwave present east of New Zealand is intensifying with an increase in the area of strong categories.
Indian Ocean – marine heatwaves present in the Arabian Sea, off the Horn of Africa, north of Madagascar remain generally stable in intensity with moderate to strong categories.
What are marine heatwaves?
Marine heatwaves (MHW) are extreme rises in ocean temperature for an extended period of time. They can occur at different locations in the ocean, and their magnitude and frequency have increased over the last couple of decades, with harmful impacts on ecosystems, and human activities. According to the latest report released by the Intergovernmental Panel on Climate Change (IPCC AR6 SYR), it is found with high confidence that in the near-term at 1.5°C global warming, the increasing frequency of marine heatwaves will increase risks of biodiversity loss in the oceans, including from mass mortality events.[2]
How are marine heatwaves calculated?
A marine heatwave is a heat episode during which the temperature is significantly higher than a certain threshold for at least 5 consecutive days.
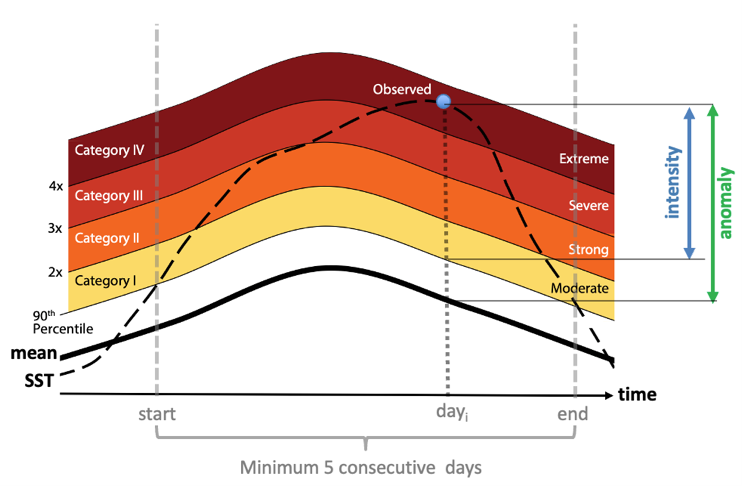
Figure adaptée de Hobday et al. (2018)
The seasonally-varying threshold is defined on a daily basis according to a sufficiently long climatic period (in this case 1993-2016). So, for a given place and a given day, knowing all the surface temperatures observed over the last 30 years, a heatwave situation is defined as one where the temperature measured is within 10% of the maximum values observed (i.e. above the 90th quantile, see diagram), for at least 5 consecutive days.
The main characteristics of heatwaves are their duration and intensity. The intensity for a given day corresponds to the value in degrees above the 90th quantile (blue arrow), which can either be calculated as the cumulative intensity throughout the heatwave event, or the maximum intensity.
Heatwaves are categorised on the basis of their deviation from the mean temperature or anomaly (green arrow): a deviation of more than 2 times the difference between the 90th quantile and the mean corresponds to a heatwave in the strong category; a deviation of more than 3 times corresponds to a heatwave in the severe category; and a deviation of more than 4 times corresponds to a heatwave in the extreme category.
[1] Analysis of datasets: OSTIA sea surface temperature observations analysis (Copernicus Marine Service), OISST sea surface temperature observations analysis (NOAA), GLO12 model (Copernicus Marine Service, Mercator Ocean International)
[2] IPCC AR6 SYR 4.3 https://www.ipcc.ch/report/ar6/syr/downloads/report/IPCC_AR6_SYR_LongerReport.pdf