
“So??? It’s hot?”
Authors: Romain Bourdallé-Badie, Eric Greiner, Clotilde Dubois, Fabrice Hernandez, Véronique Landes, Fabrice Messal.
Every summer on the French seaside, the temperature of the water at the beach is one of the most important topics of discussion. With a heatwave in the summer of 2018, the summer was particularly hot in Western Europe. On the Atlantic coast, tourists and residents are pleasantly surprised by the water temperature and inevitably ask themselves the question: Is this normal?
Do ocean analysis and forecasting models confirm that the temperature is really warmer than other years? How do we explain this phenomenon? Is this related to climate change?
Below, Mercator Ocean scientists answer the most frequently asked questions by journalists and individuals.
Questions and Answers on the sea surface temperatures on the French coasts for July 2018
Question: Are the sea surface temperatures in Western Europe for July 2018 warmer than usual?
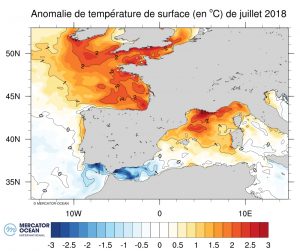
Answer: Yes. If we compare the average sea surface temperatures for July 2018 with the average for all the months of July from 2007 to 2017 in the same area (Figure 1), we see that all along the French mainland coasts, July 2018 was particularly hot. Average temperatures are 1°C higher than years past and can even exceed 2°C in some places.
Question: Are the average sea surface temperatures in July 2018 the warmest in recent years?
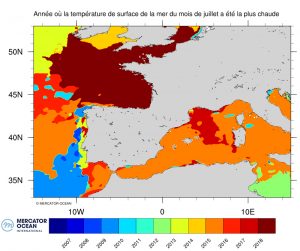
Answer: It depends where you look. If we compare the average sea surface temperatures in July 2018 with those of other years (Figure 2), we can see that this is indeed the case for the entire Bay of Biscay and the English Channel. July 2018 was the warmest month at this location on average over the past 12 years. However, this is not the case on the Mediterranean coasts where July 2015 and 2016 were, on average, warmer.
Question: Have similar maximum temperatures been observed in the same area in recent years?
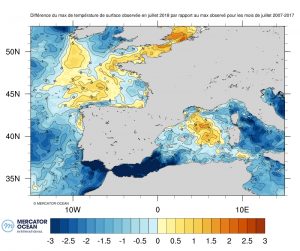
Answer: Again the answer depends on where you look. If we compare, the daily maximum temperature reached in July 2018 on each point on the map, with all the daily maximum temperatures in the same points for July 2007 to 2017 (Figure 3), we see that this year 2018 there were record temperatures in several coastal regions (in yellow and orange in Figure 3): the English Channel, Brittany and the Basque Country. Maximum temperatures were also reached further offshore in the Bay of Biscay and in the Mediterranean between Sardinia and the Balearic Islands.
Question: Are these warm sea surface temperatures due to climate change?
Answer: We cannot definitively make that assumption. It is impossible to attribute a particular year’s oceanic characteristics to climate change because we are looking at one or a few events and one cannot separate short-term fluctuations of the earth systems from longer-term variations such as those of climate change. Climate change can only be identified more certainly if episodes are repeated dozens of times over decades.
Question: Why are sea surface temperatures in July 2018 very high? (2)
Answer: As is often the case during anomalous episodes, it is caused by the convergence of several effects, atmospheric and oceanic:
- More sunshine than usual on most of the French coasts (Figure 4)
- Weaker winds thus less mixing of warmer surface water with the deeper, cooler waters (Figure 5).
Figure 4 shows a very strong positive solar flux anomaly (strong sunshine), north of the Bay of Biscay and in the English Channel, which warmed the sea surface more than usual. The surface air temperature is also affected (warmer than usual). This is notably a reflection of the unusually strong sunshine observed on the North French coasts at the beginning of summer.
In addition to this, there were weaker winds (Figure 5). With weaker winds there was weaker vertical mixing, meaning that the warm surface waters did not mix downwards with the deeper and cooler waters (see “Learn More” section). There is less warming of surface waters on the Mediterranean coasts because the positive solar flux anomaly is weaker.
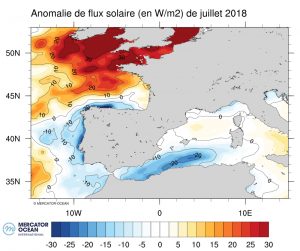
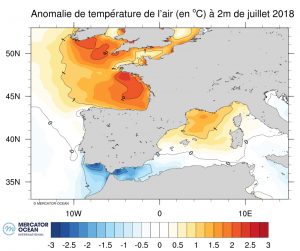
Figure 4 Solar flux (left) and air temperature anomaly at 2 meters (right) from July 2018 (western Europe)
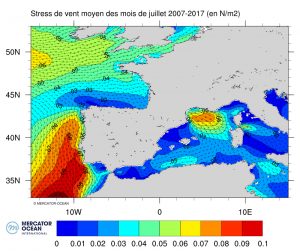
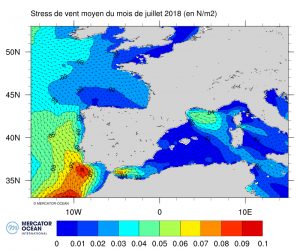
Figure 5 Energy transmitted into the ocean by wind, the average for the months of July 2007 to 2017 (left) and the average for July 2018 (right) (Western Europe).
Learn More
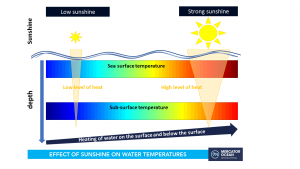
Below are two simplified diagrams to illustrate the effects of sunlight and wind strength on surface and deep water temperatures.
Effect of sunlight:
The effect of sunlight on sub-surface waters depends on the turbidity of the water (level of opacity, muddiness, for example). Generally, little light reaches 80 to 100 meters deep. The effect of sunlight therefore concerns the sea surface (the first few meters). The more sunshine, the warmer the surface and deep waters will become.
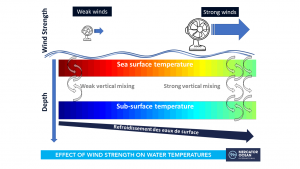
Effect of Winds (vertical mixing):
The wind that blows across the sea surface causes vertical mixing of the ocean waters, the strength of which depends on the force of the wind. The effect of this vertical mixing (which mixes warmer surface waters with cooler sub-surface waters thereby distributing heat to lower depths) can reach several tens of meters in depth. Thus, the stronger the wind is at the surface of the water, the greater the vertical mixing and the greater the cooling of the surface water (and visa versa).
Read more about Ocean Heat Content: Ocean Monitoring Indicators
Note: Feel free to use maps/images in publications or to diffuse them as you like.
Read more about the state of our ocean: Ocean State Report
(1) An anomaly is the difference between a quantity/amount of a variable from a particular moment and the quantity/amount of that same variable on average during a long-time series.
(2) A more detailed study on this summer period will be published in the fourth edition of the Copernicus Marine Service’s Ocean State Report for 2018
Note: The maps in this article are based on data from the ocean analysis and forecasting models of the Copernicus Marine Service, the European ocean monitoring service, operated by Mercator Ocean.