Key take-aways:
This year there was a drastic drop in sea ice on a global scale caused by a combination of the now usual major melting during the northern hemisphere spring in the Arctic, and the significant lack of sea ice growth during the southern hemisphere autumn in the Antarctic.
- Antarctic sea ice reached the lowest sea ice extents ever observed (on satellite record) for the months of June, July, August, and September of 2023.
- September 2023 is first time that Antarctic sea ice extent is below 17 million km2 since the first satellite observations (e.g. 1979).
- This year 2023, Antarctic sea ice has reached its maximum annual extent on the 7th of September, extending to 16.8 million km2, which is 1.9 million of km2 less compared to the 1993-2010 average for the same date. This corresponds to a sea ice loss of 3 times the size of France.
- More than 6 000 km3 of Antarctic sea ice has been lost in 2023, compared to the long-term average (1993-2010); This is equivalent to a sea ice loss of 67 times the volume of Leman Lake near Geneva (89 km3).
Record-Breaking Year for Antarctica in 2023
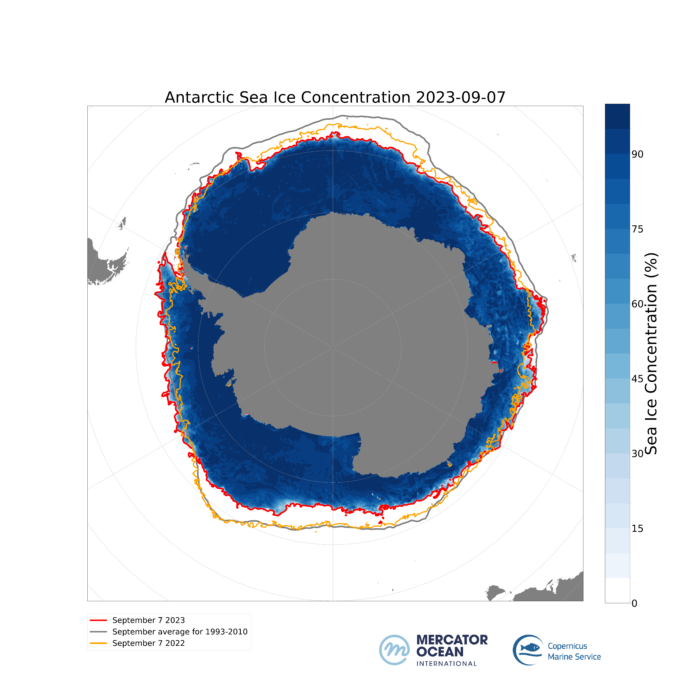
September 2023 sea ice extent
Since the beginning of May, which is generally the beginning of a time when sea ice grows during the austral autumn and winter, Antarctic Sea ice is at a record-low. It sits at approximately 1.8 million km2 below the long-term average (1993-2010). This year 2023, Antarctic Sea ice has reached its maximum annual extent on the 7th of September, extending to 16.8 million km2, which is 1.9 million of km2 less compared to the 1993-2010 average for the same date. This corresponds to a sea ice loss of 3 times the size of France (all regions). Last year, 2022, was already at a low with 18.4 million km2 of sea ice. This is the first time since the beginning of the satellite record (1979) that Antarctic sea ice extent is below 17 million km2.
The September 2023 maximum is at an unprecedented low and indicates that sea ice has not well been reformed in the cold season of the southern hemisphere. Figure 1 illustrates the Antarctic Sea ice concentration for the 7th of September 2023 in dark red well below the previous record-low in 2022 (orange line). These are both far below the sea ice concentration for the long-term average between1993-2010 (grey line) for the same date in the year. Compared to the 1993-2010 period, large areas of sea ice cover are missing in the Atlantic and Pacific sectors while it is slightly compensated in Bellingshausen Sea (figure 1).
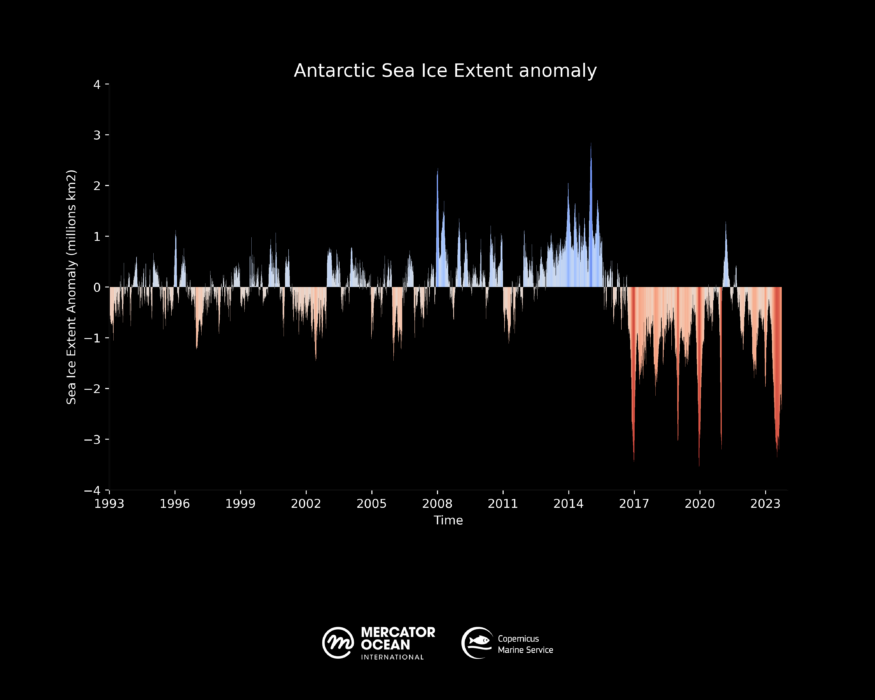
This historical loss of sea ice surface in 2023 follows several consecutive years of negative anomalies, meaning sea ice decline. Figure 2 represents sea ice extent anomalies, the blue lines showing more sea ice, and red showing sea ice loss compared to the long-term average (1993-2010 reference period). The cause of the recent sea ice lows, which could indicate the start of a long-term trend is still being debated. A recent numerical study seems to show that warming of subsurface water masses in the Southern Ocean could be the cause (Zhang et al., 2022). Moving to the north pole, we observe continued sea ice decline in the Arctic, where the sea ice cover is shrinking with time towards higher latitudes.
Significance of monitoring in September
Monitoring the Arctic and Antarctic Sea ice extent in September is crucial because it represents the annual minimum point for sea ice coverage in the Arctic and the maximum in the Antarctic (September/October). These measurements of minimum and maximums provide a vital indicator of the impact of climate change.
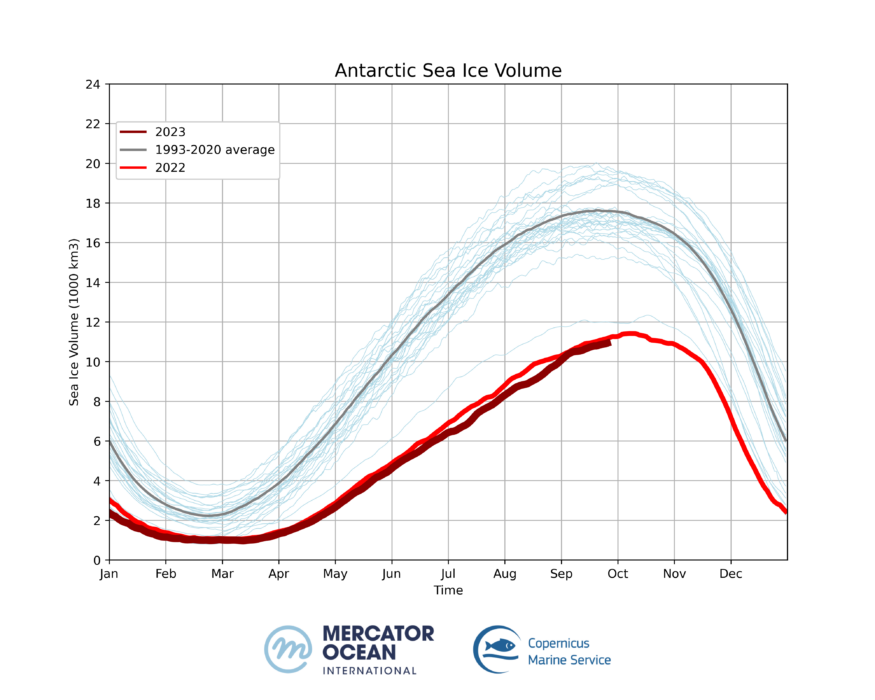
Antarctic Sea Ice Volume
The sea ice volume, calculated using sea ice concentration and thickness, is known as a sensitive climate indicator. The maximum Antarctic Sea ice volume usually reached during the month of September, oscillates between 15 400 and 20 000 km3 over the 1993-2016 reference period (see figure 3).
In recent years, the maximum extent reached each year has decreased dramatically, with successive historical low records reached for sea ice volume:
- 2021: 12 300 km3 (23rd Lowest on the satellite record)
- 2022: 11 400 km3 (2nd Lowest on the satellite record)
- 2023: 10 900 km3 (Lowest on the satellite record)
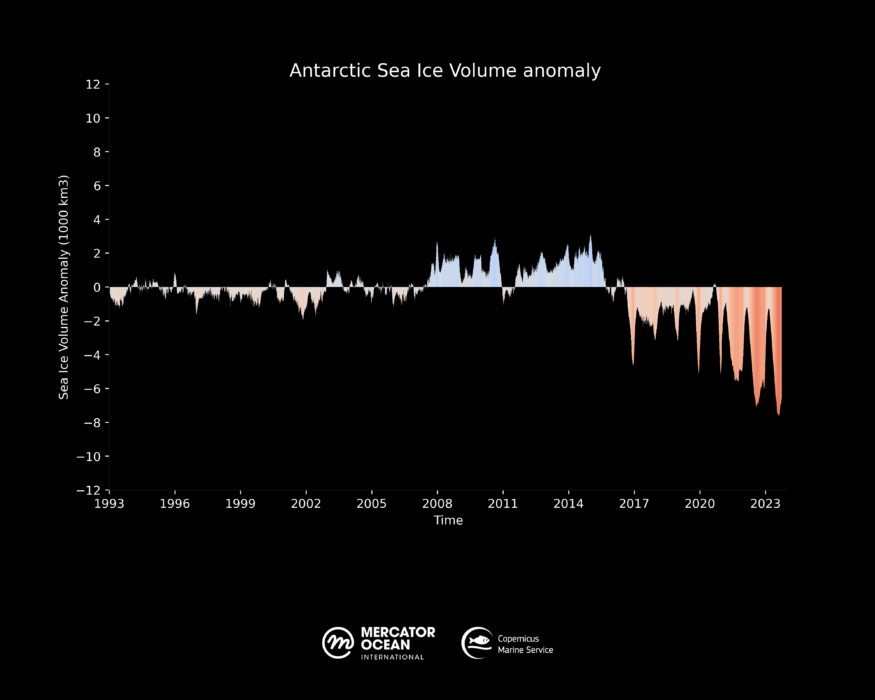
Antarctic sea ice volume and sea ice extent showed high variability, with no significant long-term trend until 2016. Figure 4 represents sea ice volume anomalies, the difference of each year compared to the long-term average (the 1993-2010 reference period); increases are illustrated in blue, while losses are in red. Since 2016, there has been a continuous loss of sea ice with sea ice lows never before observed. In 2023 more than 6 000 km3 of sea ice volume has been lost compared to the 1993-2010 average; This is equivalent to 67 times the volume of Leman Lake near Geneva (89 km3).
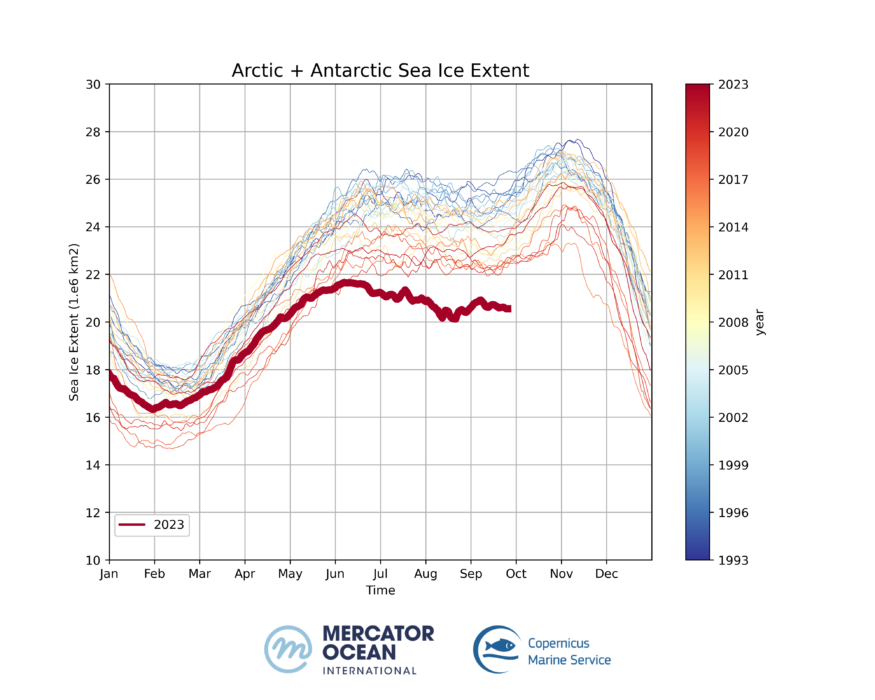
Declining Global Sea Ice Cover
This year there was a drastic drop in sea ice on a global scale caused by a combination of the now usual major melting during the northern hemisphere spring in the Arctic, and the significant lack of sea ice growth during the southern hemisphere autumn in the Antarctic. This global historical low sea ice extent decrease started in May and has continued, with sea ice cover in the two poles sitting between 20 and 22 million km2 since then. Illustrated in figure 5, the total Arctic and Antarctic Sea ice extent for 2023 is the lowest on record for June, July, August, and September, respectively.
Climate implications of global sea ice loss
The Earth’s albedo, or its ability to reflect sunlight, is heavily influenced by the extent of ice cover on the planet’s surface. Ice, with its high reflectivity, has a significant cooling effect on the Earth’s climate by bouncing a substantial portion of incoming solar radiation back into space. As global ice cover decreases due to climate change, more sunlight is absorbed by darker surfaces like water and land, potentially leading to increased warming, altered weather patterns, and exacerbating global climate change.
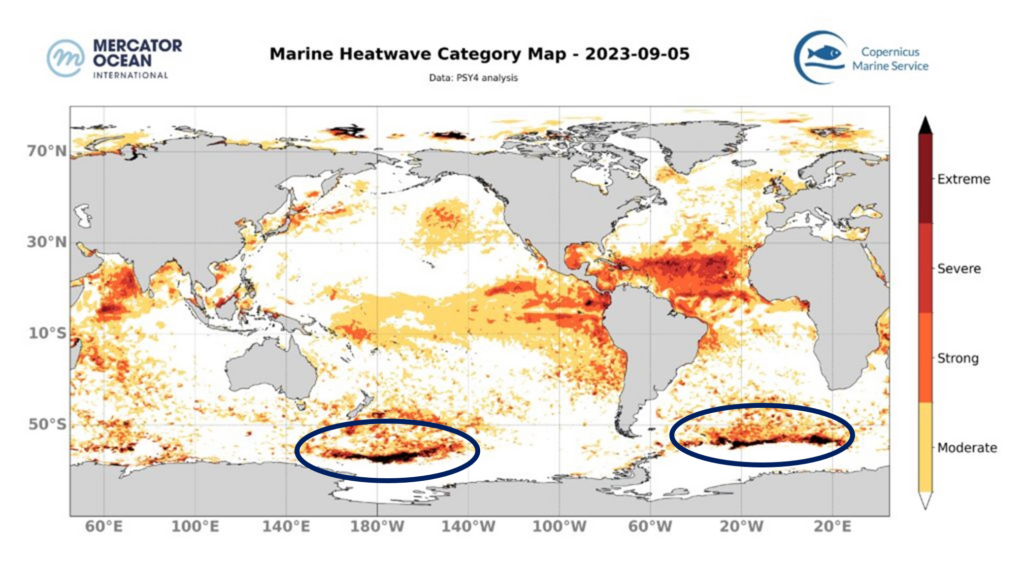
Connection between Antarctic sea ice and marine heatwaves
Until now, no scientific study has demonstrated that Antarctic sea ice loss can be attributed to the occurrence of Marine Heat Waves (MHW). The unusual presence of surface warm water masses depicted by two marine heat waves in the Atlantic and South-East Pacific sectors (see Marine Heatwave categories map Figure 6) may prevent the sea ice expansion in these specific locations (see Figure 1). The study of Zhang et al., 2022 show that warming of subsurface water masses in the Southern Ocean could play a role in sea ice melting.
The alarming loss of sea ice in both the Arctic and Antarctic underscores a critical challenge in our changing climate. This dramatic reduction in polar sea ice not only potentially exacerbates global warming by reducing Earth’s albedo but also threatens to disrupt delicate ecosystems, and potentially impact weather patterns worldwide. To address these pressing concerns and effectively mitigate the consequences, it is imperative that we closely monitor these regions.
Further Resources :
Mercator Ocean Marine Heatwave Bulletin
Copernicus Marine products used:
- GLORYS12V1 global ocean eddy-resolving (1/12° horizontal resolution, 50 vertical levels) reanalysis covering the altimetry (1993 onward). https://doi.org/10.48670/moi-00021
- The Operational Mercator global ocean analysis and forecast system at 1/12 degree. https://doi.org/10.48670/moi-00016
References:
Zhang, L., Delworth, T.L., Yang, X. et al. The relative role of the subsurface Southern Ocean in driving negative Antarctic Sea ice extent anomalies in 2016–2021. Commun Earth Environ 3, 302 (2022). https://doi.org/10.1038/s43247-022-00624-1
Jean-Michel L, Eric G, Romain Bé-B, Gilles G, Angélique M, Marie D, Clément B, Mathieu H, Olivier LG, Charly R, Tony C, Charles-Emmanuel T, Florent G, Giovanni R, Mounir B, Yann D and Pierre-Yves LT (2021) The Copernicus Global 1/12° Oceanic and Sea Ice GLORYS12 Reanalysis. Front. Earth Sci. 9:698876. doi: 10.3389/feart.2021.698876
Lellouche, J.-M., Greiner, E., Le Galloudec, O., Garric, G., Regnier, C., Drevillon, M., Benkiran, M., Testut, C.-E., Bourdalle-Badie, R., Gasparin, F., Hernandez, O., Levier, B., Drillet, Y., Remy, E., and Le Traon, P.-Y.: Recent updates to the Copernicus Marine Service global ocean monitoring and forecasting real-time 1∕12° high-resolution system, Ocean Sci., 14, 1093–1126, https://doi.org/10.5194/os-14-1093-2018, 2018.