Key take-aways:
This year there was a drastic drop in sea ice on a global scale caused by a combination of the now usual major melting during the northern hemisphere spring in the Arctic, and the significant lack of sea ice growth during the southern hemisphere autumn in the Antarctic.
- On the 12th of September 2023, Arctic sea ice extent reached its annual minimum, reaching 3.9 million km2, which is 1.7 million km2 less compared to the long term average (1993-2010). This corresponds to a sea ice loss of 2.8 times the size of France (all regions).
- In 2023, the September Arctic Sea ice volume minimum hit a historic record-low of 3 200 km3.
- In September 2023, the Arctic sea ice extent ranks as the sixth lowest observed since the beginning of the satellite record.
- The last 17 annual minimum Arctic sea ice extents are also the lowest 17 ever observed (since 1979).
Arctic Sea ice September lows
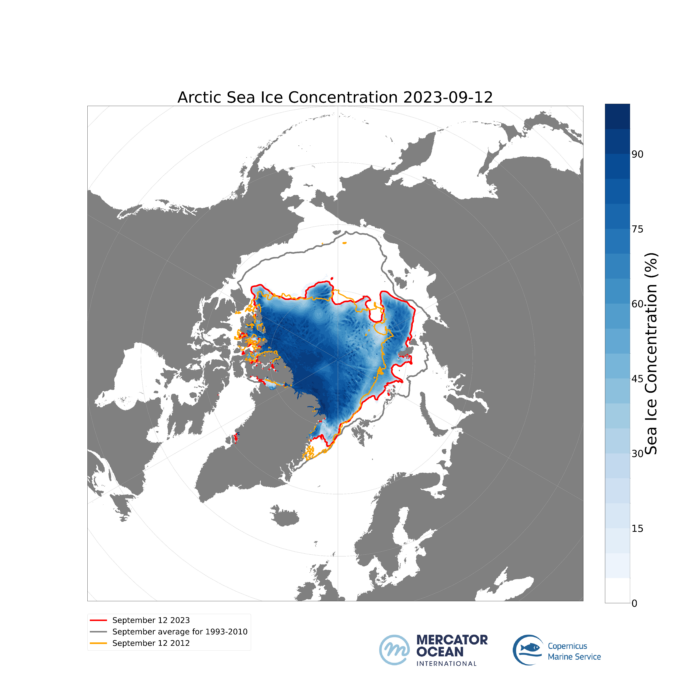
September 2023 sea ice extent
For 2023, Arctic Sea ice reached its minimum annual extent on12 September. There is a large decrease in sea ice cover in the Beaufort Gyre and along the Eurasian continent during northern hemisphere spring and summer periods. Routes of the Northwest Passage in the Canadian Archipelago appear largely ice free this year. Figure 1 highlights the Arctic Sea ice concentration for 12 September 2023 (in dark red), the year 2012 the lowest record ever observed (in orange), both well below the long-term average for 1993-2010 (in grey).
The historical record-lows for September annual sea ice extent minimums sit at:
- 2007: 3.7 million km2
- 2012: 3.2 million km2 (the lowest ever observed)
- 2019: 3.8 million km2
- 2020: 3.4 million km2
- 2023: 3.9 million km2 (the 6th lowest ever observed)
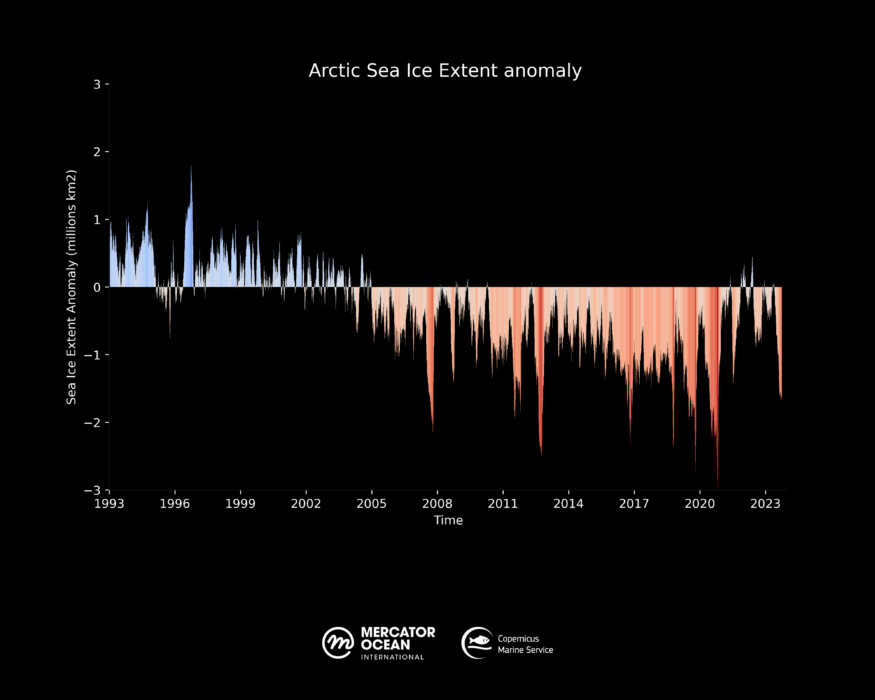
This year continues the trend of alarming sea ice decline in the Arctic. For 12 September 2023, the sea ice extent reached 3.9 million km2, this is 1.7 million km2 below the long-term average (1993-2010 climatology). This corresponds to a sea ice loss of 2.8 times the size of France (all regions). Figure 2 shows sea ice extent anomalies, with the blue lines showing increases, and red showing decreases compared to the long-term average.
Significance of monitoring in September
Monitoring the Arctic and Antarctic Sea ice extent in September is crucial because it represents the annual minimum point for sea ice coverage in the Arctic and the maximum in the Antarctic (September/October). These measurements of minimum and maximums provide a vital indicator of the impact of climate change.
Arctic Sea Ice Volume
Unlike the Antarctic, where regular sea ice decline only started in 2016, the Arctic has been regularly losing sea ice since 1993. Figure 3 illustrates Arctic Sea ice volume over time, highlighting the record-low years of 2023 (dark red line), 2020 (light red line), and 2012 (orange line), that sit well below the long-term average (1993-2020).
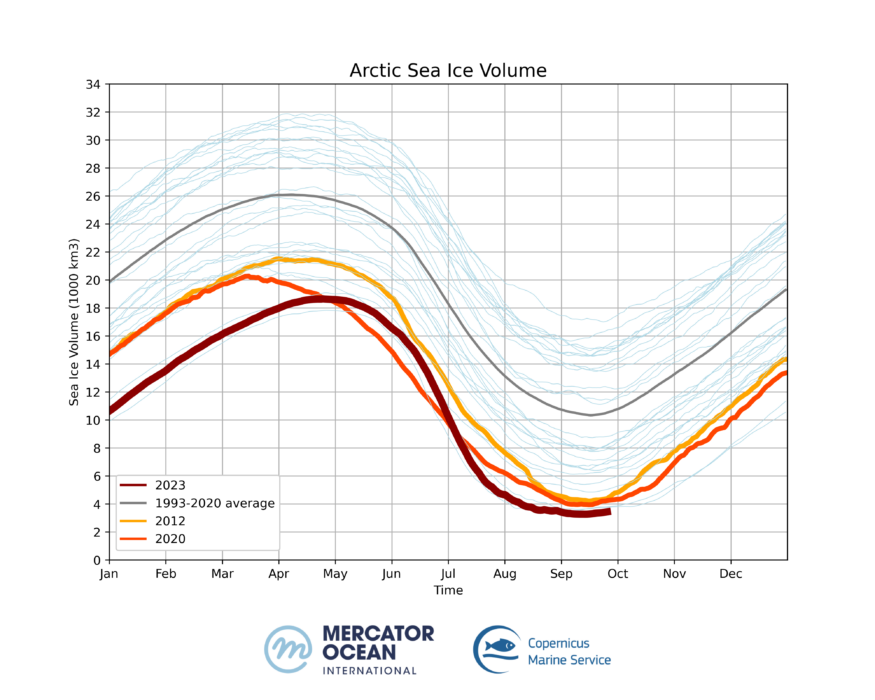
From 1993 to 2006, the September Sea ice volume minimum reached between 11 000 and 17 000 km3. Since 2007, the September Sea ice volume minimums descend to between 3 200 and 8 700 km3. The year 2007 was the first historical minimum with 7 100 km3.
New records for the September minimum Arctic Sea ice volume have been exceeded during the last years:
- 2007: 7 100 km3 (first historical low)
- 2012: 4 200 km3
- 2020: 3 900, km3
- 2021: 3 400 km3
- 2022: 3 600 km3
- 2023 3 200 km3 (lowest on record)
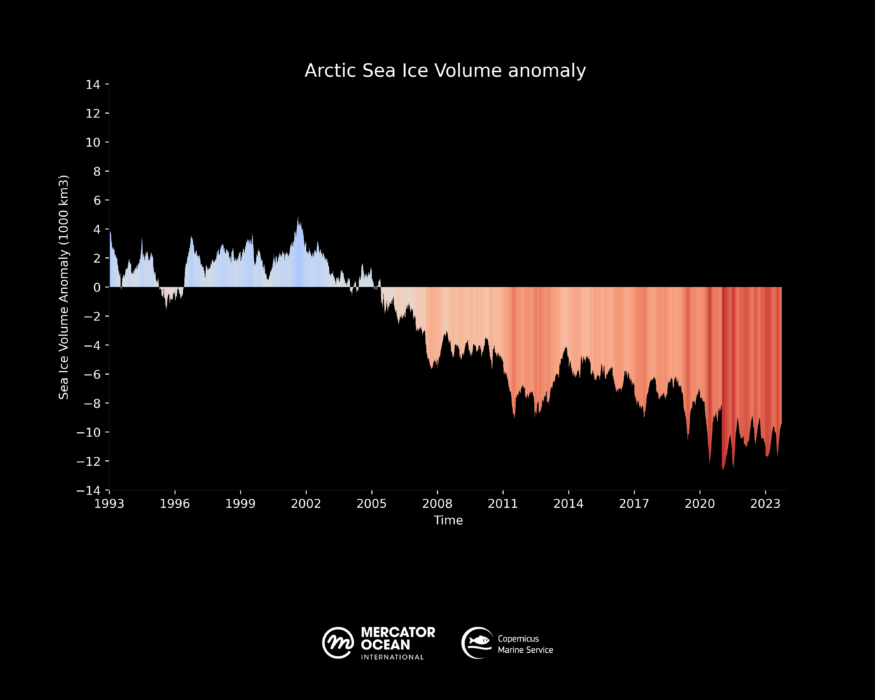
This behaviour highlights the continuous loss of thicker and multi-year ice, in accordance with observations. Figure 4 illustrates sea ice volume anomalies, which describes the gain of sea ice in blue and loss in red as compared to the long term average (1993-2010 reference period).
Declining Global Sea Ice Cover
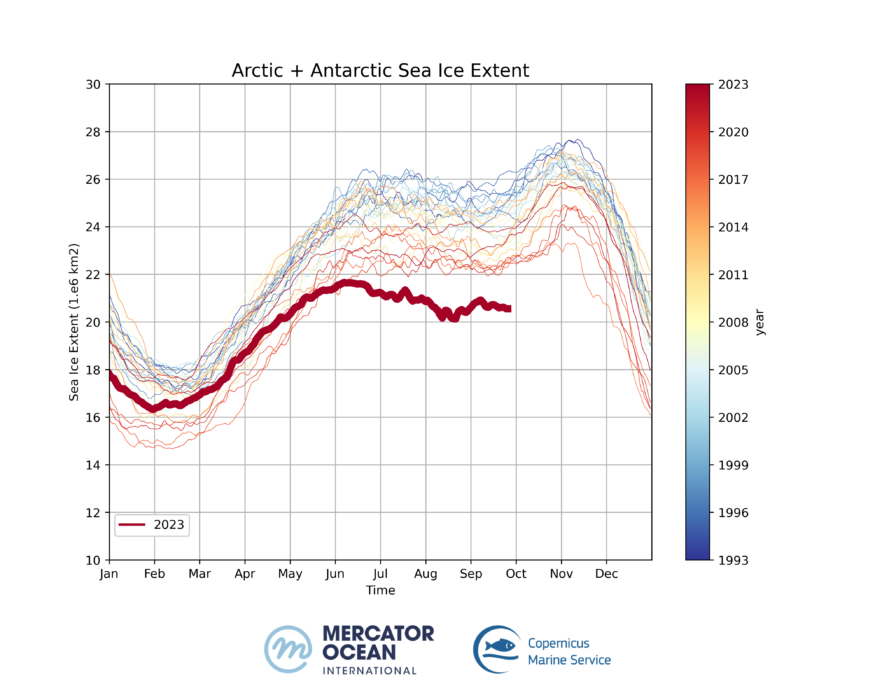
This year there was a drastic drop in sea ice on a global scale caused by a combination of the now usual major melting during the northern hemisphere spring in the Arctic, and the significant lack of sea ice growth during the southern hemisphere autumn in the Antarctic. This global historical low sea ice extent decrease started in May and has continued, with sea ice cover in the two poles sitting between 20 and 22 million km2 since then. Illustrated in figure 5, the total Arctic and Antarctic Sea ice extent for 2023 is the lowest on record for June, July, August, and September, respectively.
Climate implications of global sea ice loss
The Earth’s albedo, or its ability to reflect sunlight, is heavily influenced by the extent of ice cover on the planet’s surface. Ice, with its high reflectivity, has a significant cooling effect on the Earth’s climate by bouncing a substantial portion of incoming solar radiation back into space. As global ice cover decreases due to climate change, more sunlight is absorbed by darker surfaces like water and land, potentially leading to increased warming, altered weather patterns, and exacerbating global climate change.
Further Resources :
Copernicus Marine products used:
- GLORYS12V1 global ocean eddy-resolving (1/12° horizontal resolution, 50 vertical levels) reanalysis covering the altimetry (1993 onward). https://doi.org/10.48670/moi-00021
- The Operational Mercator global ocean analysis and forecast system at 1/12 degree. https://doi.org/10.48670/moi-00016
References:
Zhang, L., Delworth, T.L., Yang, X. et al. The relative role of the subsurface Southern Ocean in driving negative Antarctic Sea ice extent anomalies in 2016–2021. Commun Earth Environ 3, 302 (2022). https://doi.org/10.1038/s43247-022-00624-1
Jean-Michel L, Eric G, Romain Bé-B, Gilles G, Angélique M, Marie D, Clément B, Mathieu H, Olivier LG, Charly R, Tony C, Charles-Emmanuel T, Florent G, Giovanni R, Mounir B, Yann D and Pierre-Yves LT (2021) The Copernicus Global 1/12° Oceanic and Sea Ice GLORYS12 Reanalysis. Front. Earth Sci. 9:698876. doi: 10.3389/feart.2021.698876
Lellouche, J.-M., Greiner, E., Le Galloudec, O., Garric, G., Regnier, C., Drevillon, M., Benkiran, M., Testut, C.-E., Bourdalle-Badie, R., Gasparin, F., Hernandez, O., Levier, B., Drillet, Y., Remy, E., and Le Traon, P.-Y.: Recent updates to the Copernicus Marine Service global ocean monitoring and forecasting real-time 1∕12° high-resolution system, Ocean Sci., 14, 1093–1126, https://doi.org/10.5194/os-14-1093-2018, 2018.